Categories
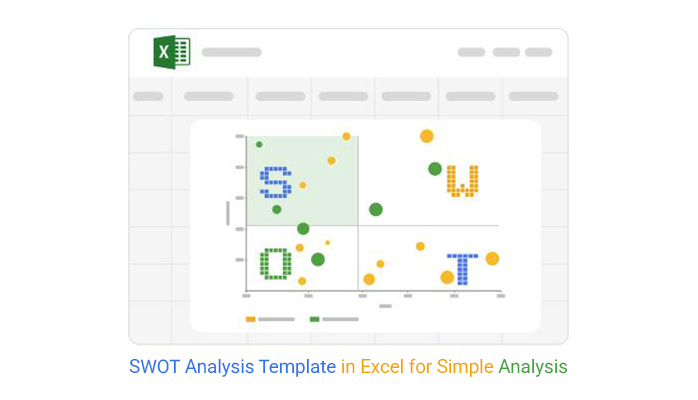
SWOT analysis templates in Excel—what makes them so useful for businesses? Companies rely on them to assess strengths, weaknesses, opportunities, and threats.
SWOT analysis templates in Excel provide a structured way to organize data without expensive software. Their clear format benefits small businesses and large corporations. Using a month-to-month comparison Excel chart alongside a SWOT analysis helps track changes over time and refine strategies.


Data-backed decisions lead to more substantial results. SWOT analysis templates in Excel turn raw insights into actionable steps. With everything laid out in one place, teams can spot risks before they become significant problems. Identifying box plot outliers within a SWOT analysis can highlight hidden weaknesses or unexpected opportunities.
Markets shift fast. A strategy that worked last year might not be as effective today. Businesses using Excel templates can quickly update their analysis. This helps them stay competitive. Whether launching a new product or entering a different market, identifying challenges makes a significant difference.
Pre-built templates save hours of work. Instead of starting from scratch, teams can focus on analyzing data. Customizing these templates to fit specific needs takes minutes. A text visualization tool can enhance clarity by making key points stand out.
SWOT analysis templates in Excel are practical, efficient, and widely used. Whether for small teams or multinational corporations, they provide clarity in decision-making. A strong strategy starts with understanding both internal and external factors. Excel makes that process simple and effective.
How?
Let’s find out…
Definition: A SWOT analysis template in Excel helps businesses evaluate strengths, weaknesses, opportunities, and threats. It organizes data in a clear, structured format, making decisions easier.
Excel’s flexibility allows quick customization. You can update information as conditions change. An exponential growth chart alongside a SWOT analysis helps visualize long-term trends and opportunities. It saves time with a ready-made framework. How? It allows you to focus on strategy instead of formatting.
Strong data analysis is key to making informed decisions. Excel makes SWOT analysis simple and effective. It helps structure insights, making identifying strengths, weaknesses, opportunities, and threats easier. Here’s why a SWOT template in Excel is a smart choice:
An excellent SWOT analysis template in Excel makes strategic planning more straightforward and effective. It should be well-structured, easy to customize, and visually appealing. Here’s what sets a good SWOT template apart:
A well-designed SWOT matrix template in Excel makes strategic planning more transparent and efficient. The right features help teams analyze data quickly and collaborate effectively. Here’s what makes a strong SWOT matrix template:
Creating a SWOT Analysis template in Excel is super easy and a great way to organize your thoughts. Whether you’re analyzing a business, a project, or even yourself, this tool will help you understand strengths, weaknesses, opportunities, and threats.
How?
A SWOT analysis template in Excel helps businesses map out strengths, weaknesses, opportunities, and threats. Excel is great for organizing data, but making sense of it is another story. Its basic charts and static tables can make data feel lifeless.
Good data analysis needs clear, engaging visuals to highlight insights. This is where ChartExpo, a powerful chart add-in for Excel, steps in. It transforms dull spreadsheets into interactive, easy-to-read charts.
ChartExpo helps you see the bigger picture if Excel limits your data storytelling.
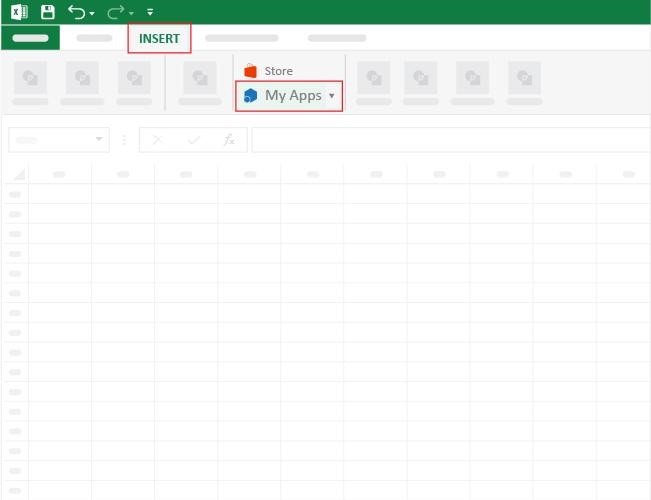
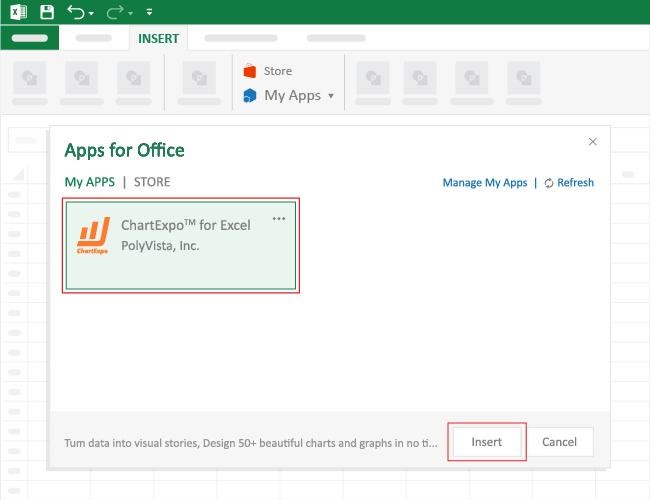
How to Install ChartExpo in Excel?
ChartExpo charts are available both in Google Sheets and Microsoft Excel. Please use the following CTAs to install the tool of your choice and create beautiful visualizations with a few clicks in your favorite tool.
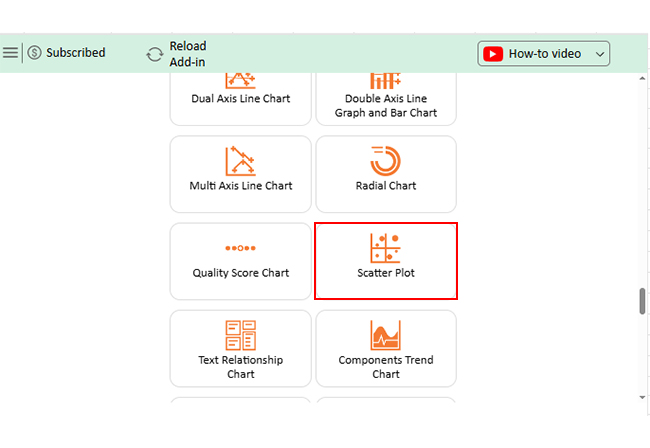
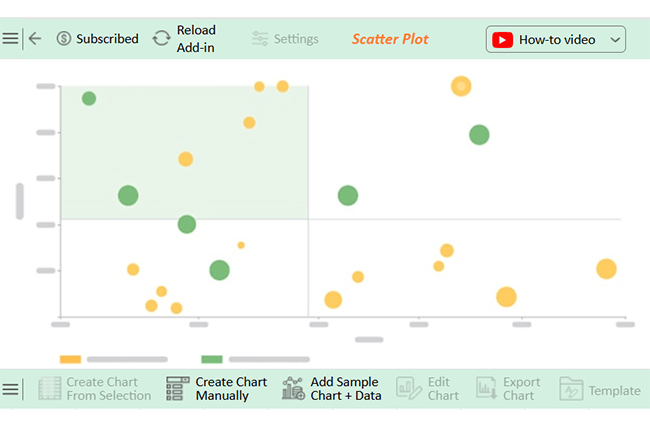
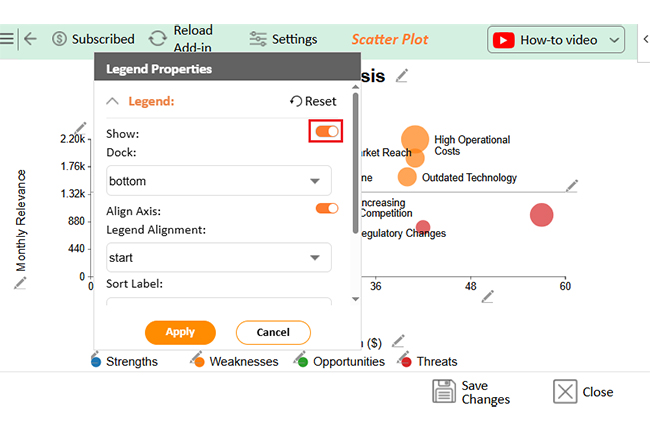
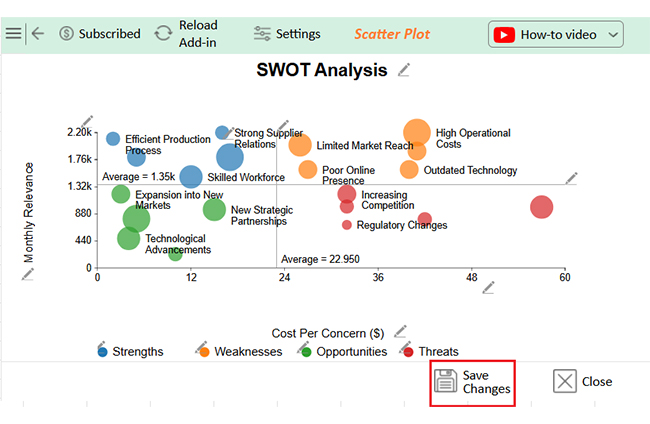
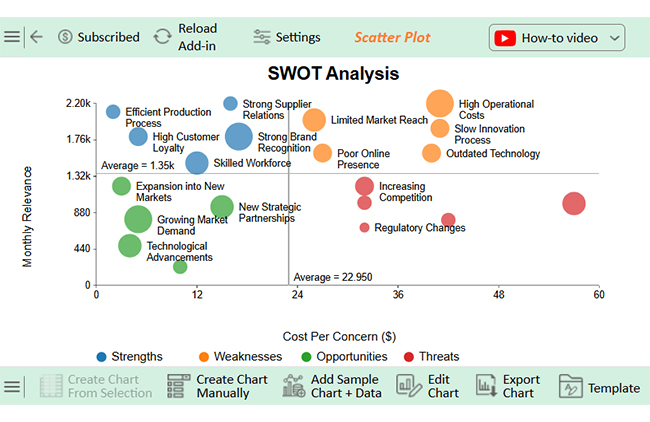
Let’s analyze and learn how to make a Scatter Chart in Excel using ChartExpo:
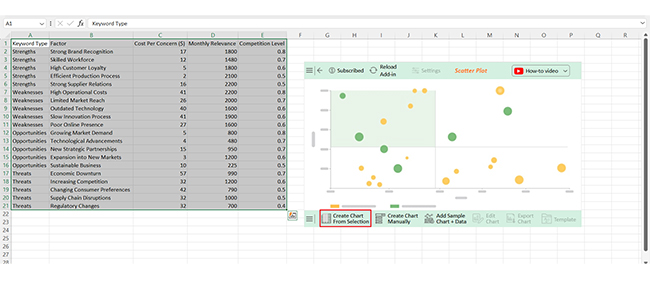
| Keyword Type | Factor | Cost Per Concern ($) | Monthly Relevance | Competition Level |
| Strengths | Strong Brand Recognition | 17 | 1800 | 0.8 |
| Strengths | Skilled Workforce | 12 | 1480 | 0.7 |
| Strengths | High Customer Loyalty | 5 | 1800 | 0.6 |
| Strengths | Efficient Production Process | 2 | 2100 | 0.5 |
| Strengths | Strong Supplier Relations | 16 | 2200 | 0.5 |
| Weaknesses | High Operational Costs | 41 | 2200 | 0.8 |
| Weaknesses | Limited Market Reach | 26 | 2000 | 0.7 |
| Weaknesses | Outdated Technology | 40 | 1600 | 0.6 |
| Weaknesses | Slow Innovation Process | 41 | 1900 | 0.6 |
| Weaknesses | Poor Online Presence | 27 | 1600 | 0.6 |
| Opportunities | Growing Market Demand | 5 | 800 | 0.8 |
| Opportunities | Technological Advancements | 4 | 480 | 0.7 |
| Opportunities | New Strategic Partnerships | 15 | 950 | 0.7 |
| Opportunities | Expansion into New Markets | 3 | 1200 | 0.6 |
| Opportunities | Sustainable Business | 10 | 225 | 0.5 |
| Threats | Economic Downturn | 57 | 990 | 0.7 |
| Threats | Increasing Competition | 32 | 1200 | 0.6 |
| Threats | Changing Consumer Preferences | 42 | 790 | 0.5 |
| Threats | Supply Chain Disruptions | 32 | 1000 | 0.5 |
| Threats | Regulatory Changes | 32 | 700 | 0.4 |


A SWOT analysis is only valuable if it leads to meaningful action. An Excel template helps structure insights, but how you use it determines its effectiveness. Incorporating trend analysis in Excel can reveal patterns in strengths, weaknesses, opportunities, and threats.
Using an employee SWOT Analysis template in Excel is a game-changer. It helps employees reflect, grow, and plan their careers with clarity. With Excel charts, employees can visualize their strengths and weaknesses more effectively. Here’s why it’s worth having:
A SWOT analysis in Excel is a powerful tool but has limits. While it helps organize insights, specific challenges can affect its effectiveness. Here are some key limitations to keep in mind:


Yes, Excel offers SWOT analysis templates. You can find them in the template library or create a custom one. These templates help organize strengths, weaknesses, opportunities, and threats. They are easy to use, customizable, and great for strategic planning.
Yes, Excel provides SWOT templates. You can find them in the template library or download one online. These templates help structure strengths, weaknesses, opportunities, and threats. They are customizable, easy to use, and valuable for business or personal analysis.
A SWOT analysis template in Excel is a simple yet powerful tool. It helps you identify strengths, weaknesses, opportunities, and threats. It has a clear layout, which makes organizing insights efficient.
Excel makes structuring a SWOT analysis easy. However, it has limitations in data visualization. Basic tables and static charts can make analysis less engaging. A scatter plot can improve insights by showing trends and relationships within SWOT data.
Strong decision-making requires more than raw data. Clear visuals help teams understand patterns and trends; essential insights may be overlooked without proper visualization. This is where ChartExpo becomes valuable. It enhances Excel by providing advanced charts and interactive visuals. With better data representation, businesses can make smarter decisions.
A well-structured SWOT analysis leads to strategic growth. It highlights areas for improvement and opportunities for exploration. When presented effectively, it becomes a roadmap for success. Integrating Excel tools like profit and loss templates alongside SWOT analysis can provide a more transparent financial perspective. This ensures a more substantial business planning.
Using the right approach ensures better insights and more potent strategies. Install ChartExpo today for a precise SWOT analysis that drives brilliant business moves.
How much did you enjoy this article?


Learn how to use sparklines in Excel to quickly visualize trends inside cells. Discover types, creation steps, customization, use cases, benefits, and best practices.

Learn what a confidence interval graph is, how to create it in Excel, and how to interpret results to make more reliable, data-driven decisions.

A correlation matrix in Excel helps identify relationships between variables. Learn how to create, read, and use it for effective data analysis.


