Categories
Artificial Intelligence in Excel—what does it mean? Excel has been a go-to tool for businesses for decades. AI is transforming it in ways that make data analysis faster and wiser. With AI, you can automate tasks, detect patterns, and make predictions without advanced coding skills.
AI-powered features like ideas, data types, and predictive analytics help turn raw numbers into insights within seconds. Data-driven decision-making becomes more precise as AI uncovers trends and suggests the best action.


Artificial Intelligence in Excel is also changing decision-making. Businesses can use machine learning to forecast sales, detect fraud, and optimize their supply chain. Business analytics improves as AI processes vast datasets, revealing hidden opportunities and risks. AI adapts to data patterns, making reports more accurate over time.
Microsoft’s AI-powered Copilot takes automation further. It can analyze complex datasets, write formulas, and suggest improvements based on past usage. Data enrichment enhances spreadsheets by pulling in external insights, making reports more valuable and comprehensive. This means less time spent on repetitive tasks and more focus on strategy.
Companies worldwide are integrating AI tools to stay ahead in data-driven industries. Whether a beginner or an expert, AI makes Excel smarter, faster, and more intuitive than ever.
Definition: AI for Excel enhances data analysis, automation, and decision-making. It helps you process large datasets quickly – features like predictive analytics and pattern recognition improve accuracy. AI-powered tools automate repetitive tasks, saving time and effort. Advanced functions assist with data cleaning and organization.
Machine learning integrations provide deeper insights for better forecasting. Analyzing and interpreting data becomes easier as AI uncovers trends and patterns. Add-ons like ChartExpo enhance data visualization with AI-driven charts.
In summary, AI transforms Excel into a more innovative, more efficient tool for businesses, analysts, and professionals.
Working with data can be time-consuming. Manually sorting, analyzing, and fixing errors takes hours. AI enhances data analytics by making spreadsheets smarter, faster, and more accurate. Whether handling small reports or massive datasets, AI saves time and improves results.
Here’s why it matters:
Excel isn’t just about rows and columns anymore. With AI, information design improves how data is structured and understood. It’s become a powerhouse for automating tasks, enhancing analysis, and providing insights. Let’s explore the 10 best ways AI transforms how we work with data in Excel.
AI is transforming it into a powerful data assistant. Tasks that once took hours now take minutes. AI makes Excel smarter, faster, and more intuitive. From analyzing trends to predicting outcomes, here’s how AI is reshaping Excel:
Excel is no longer just about numbers and formulas. AI is making data presentation more transparent and effective. It helps you analyze data, fix errors, and easily make predictions. Here are essential AI features in Excel:
Artificial Intelligence in Excel is a powerhouse, but not without its flaws. Though it speeds up tasks and makes analysis more efficient, it still isn’t adequate. Accuracy, data quality, and security issues may affect outcomes.
Here are several limits to consider:
Excel is evolving rapidly, with AI at the core. As more businesses rely on data visualization, insights become more transparent and impactful. The future of AI in Excel promises to make work even more intelligent, faster, and more intuitive. Here’s a peek at what’s coming next.
What is Artificial Intelligence in Excel? It’s the game-changer that automates tasks, analyzes data, and predicts trends. However, one big problem is that Excel’s data visualization tools fall short. Basic charts can’t always capture complex insights.
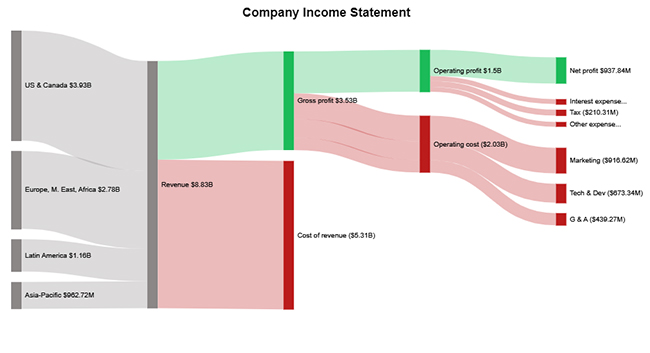
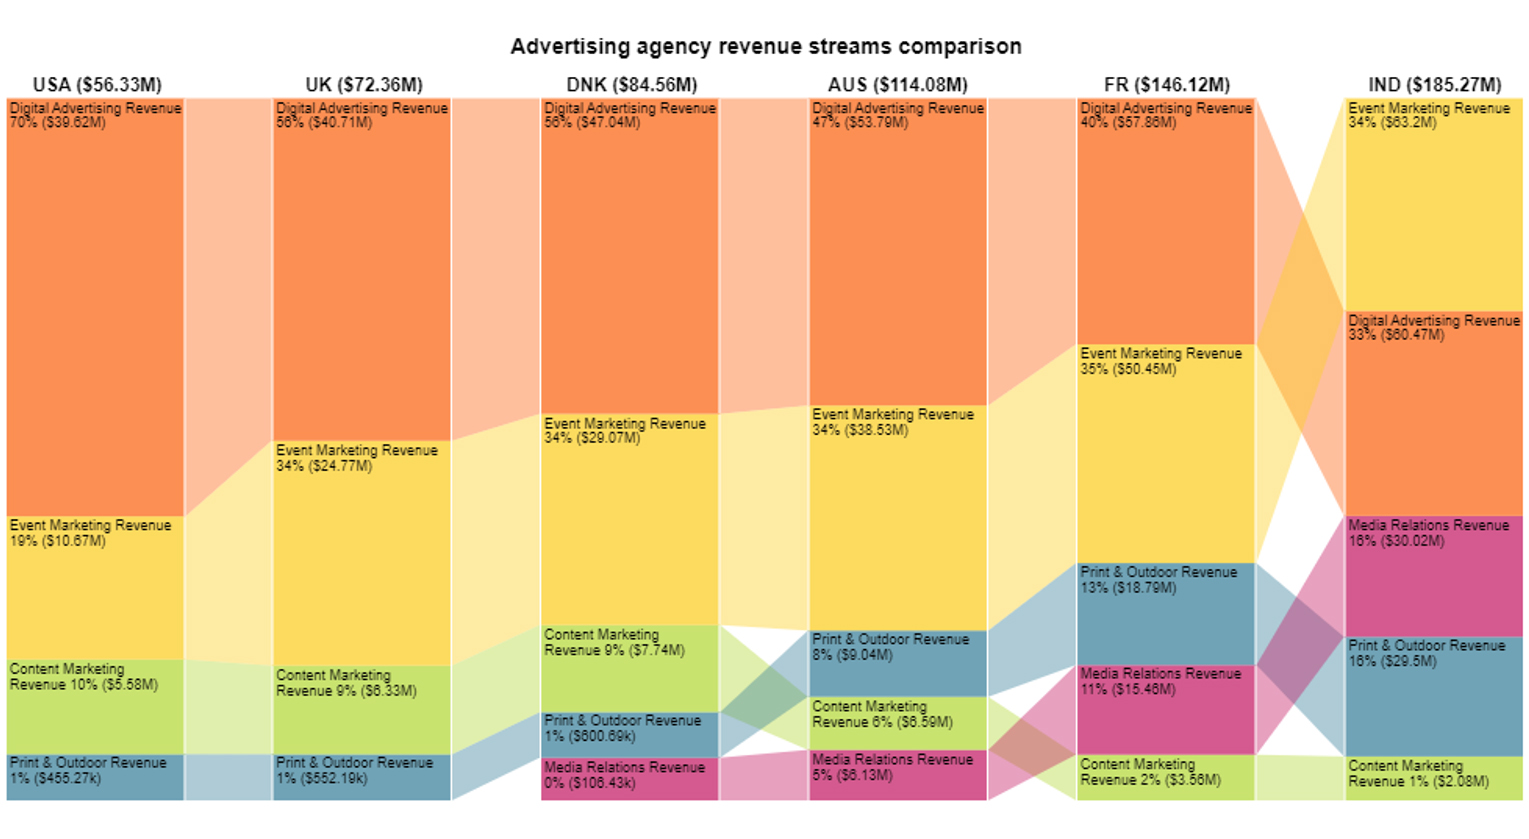
That’s where ChartExpo comes in. It transforms dull spreadsheets into insights and interactive visuals through a powerful Sankey diagram and other advanced charts. With AI and enhanced charting, you get more precise insights, faster decisions, and better reports—all within Excel.
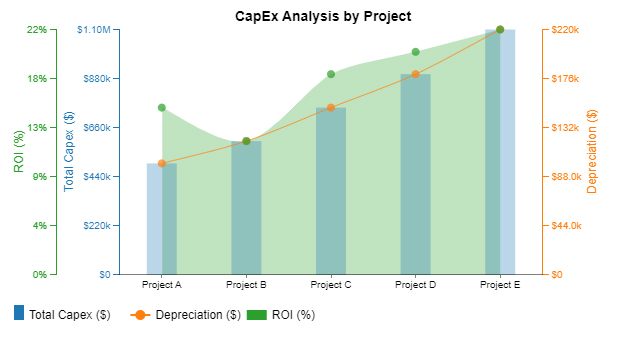
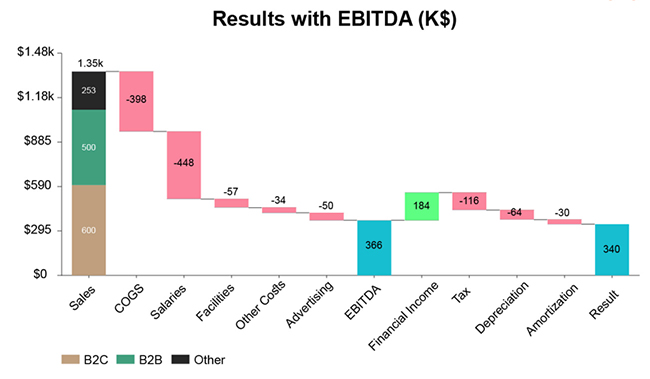
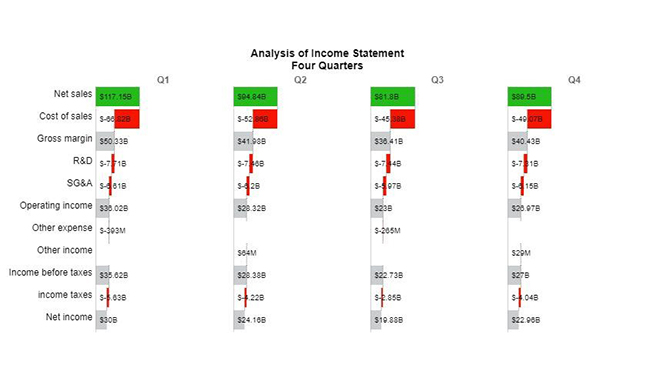
The charts below, including a Waterfall chart, were created using ChartExpo:
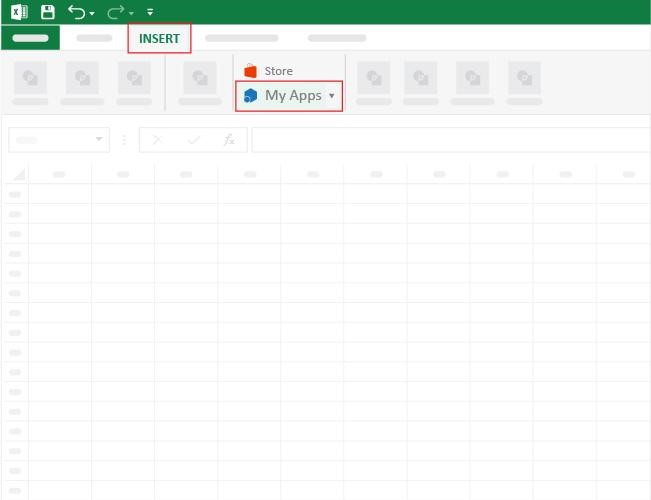
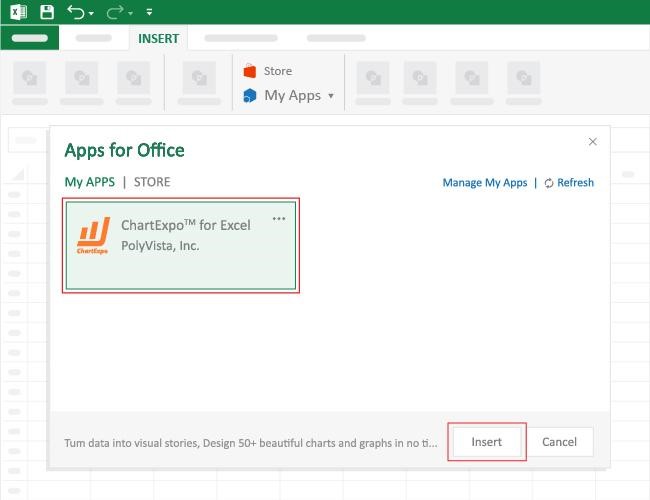
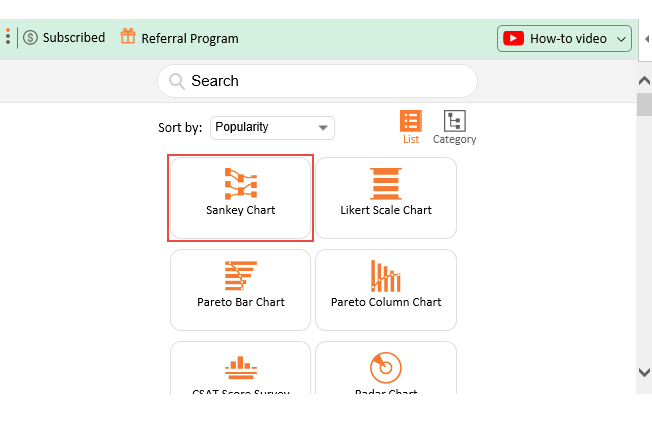
How to Install ChartExpo in Excel?
ChartExpo charts are available both in Google Sheets and Microsoft Excel. Please use the following CTAs to install the tool of your choice and create beautiful visualizations with a few clicks in your favorite tool.
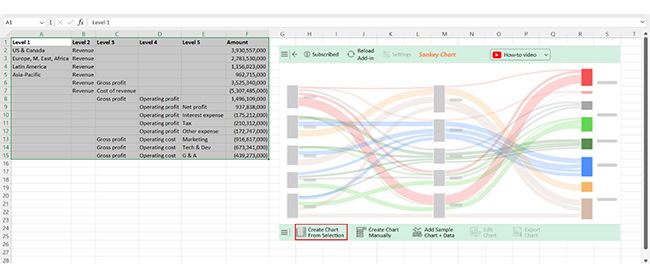
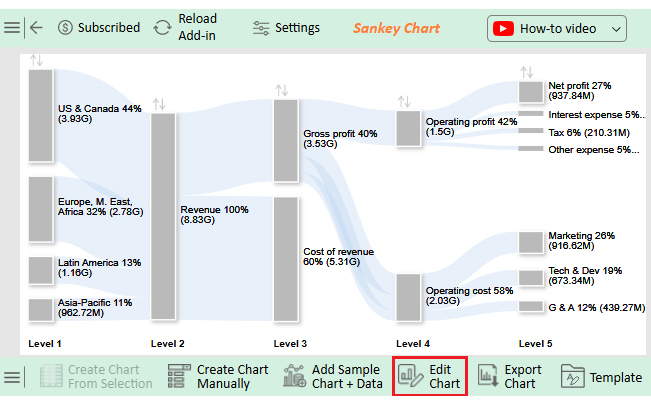
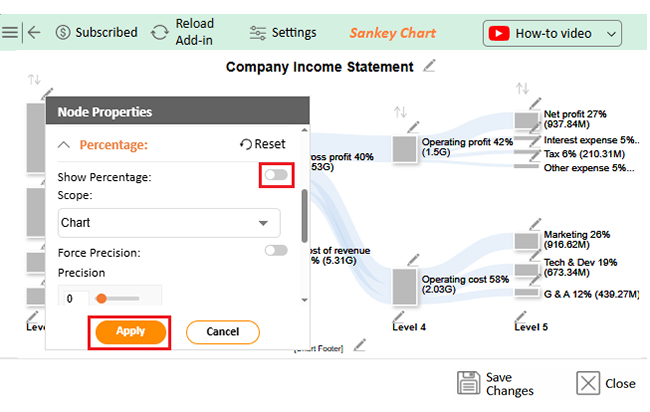
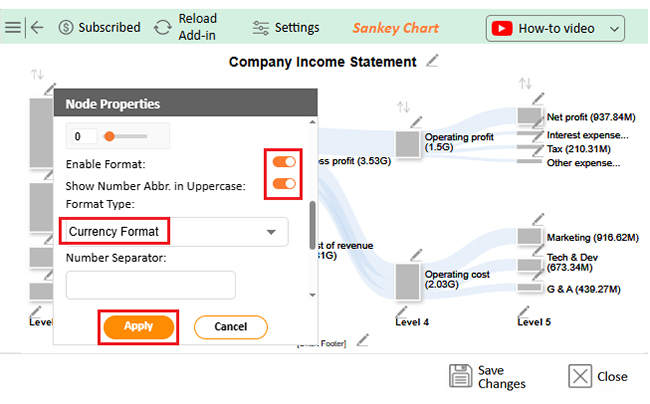
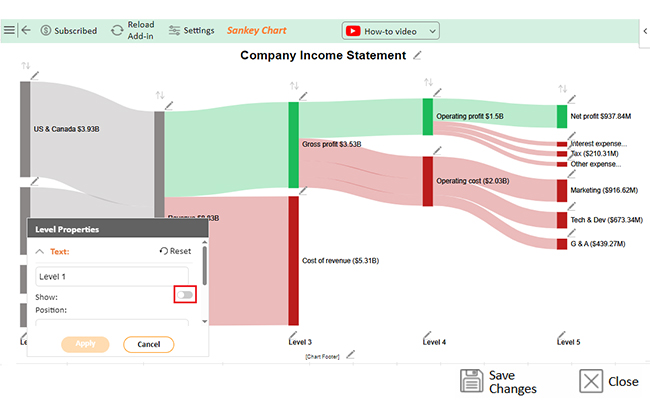
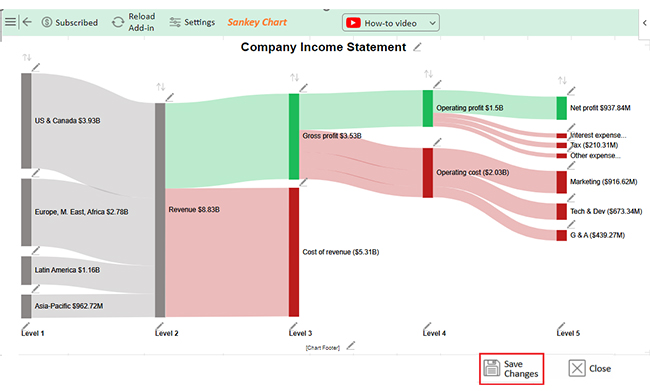
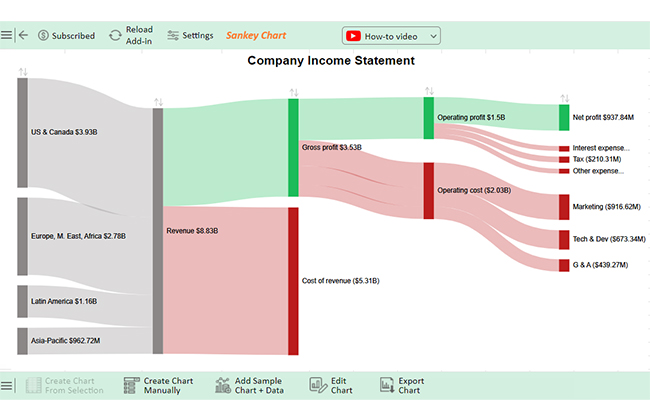
Let’s analyze the AI expense sample data below in Excel using ChartExpo and turn it into Excel charts. You can also use a Sankey chart in Excel to visualize how expenses flow across different categories for better financial charts.
| Level 1 | Level 2 | Level 3 | Level 4 | Level 5 | Amount |
| US & Canada | Revenue | 3,930,557,000 | |||
| Europe, M. East, Africa | Revenue | 2,783,530,000 | |||
| Latin America | Revenue | 1,156,023,000 | |||
| Asia-Pacific | Revenue | 962,715,000 | |||
| Revenue | Gross profit | 3,525,340,000 | |||
| Revenue | Cost of revenue | -5,307,485,000 | |||
| Gross profit | Operating profit | 1,496,109,000 | |||
| Operating profit | Net profit | 937,838,000 | |||
| Operating profit | Interest expense | -175,212,000 | |||
| Operating profit | Tax | -210,312,000 | |||
| Operating profit | Other expense | -172,747,000 | |||
| Gross profit | Operating cost | Marketing | -916,617,000 | ||
| Gross profit | Operating cost | Tech & Dev | -673,341,000 | ||
| Gross profit | Operating cost | G & A | -439,273,000 |
Yes, you can use AI in Excel. It automates tasks, analyzes data, and improves decision-making. Features like Ideas, Excel Copilot, and Predictive Analytics make work easier. AI helps clean data, detect errors, and create smart visualizations for better insights.
The new AI function in Excel is Excel Copilot. It helps automate tasks, suggests insights, and simplifies data analysis. Copilot offers smart formula suggestions, predictive forecasting, and natural language queries, making Excel more intuitive and efficient.
Artificial Intelligence in Excel is changing how we work with data. It automates tasks, analyzes trends, and improves accuracy. You save time and make better decisions with AI-powered tools.
Excel’s built-in AI features simplify exploratory data analysis, such as Ideas and Predictive Analytics. They detect patterns, suggest insights, and create forecasts, making even complex datasets easier to understand.
Despite its power, AI in Excel has limitations. Accuracy depends on data quality. Information overload can make it harder to focus on key insights. Large datasets can slow performance, and security concerns remain.
Basic Excel charts don’t always provide clear insights. Advanced data visualization is crucial for deeper analysis. Data storytelling turns raw numbers into meaningful narratives, making reports more engaging and insightful. This is where ChartExpo helps by transforming data into compelling visuals.
Artificial Intelligence in Excel isn’t a luxury—it’s a necessity. It transforms spreadsheets into powerful analytical tools. With AI, Excel becomes faster, wiser, and more efficient than ever.
Conclusively, AI in Excel continues to evolve, and Microsoft’s Excel Copilot is making automation even brighter. Don’t hesitate to install ChartExpo for advanced data visualizations.
How much did you enjoy this article?


Learn how to use sparklines in Excel to quickly visualize trends inside cells. Discover types, creation steps, customization, use cases, benefits, and best practices.

Learn what a confidence interval graph is, how to create it in Excel, and how to interpret results to make more reliable, data-driven decisions.

A correlation matrix in Excel helps identify relationships between variables. Learn how to create, read, and use it for effective data analysis.


