• Home
  • Tools dropdown img
    • Spreadsheet Charts

      • ChartExpo for Google Sheets
      • ChartExpo for Microsoft Excel
    • Power BI Charts

      • Power BI Custom Visuals by ChartExpo
    • Word Cloud

  • Charts dropdown img
    • Chart Category

      • Bar Charts
      • Circle Graphs
      • Column Charts
      • Combo Charts
      • Comparison Charts
      • Line Graphs
      • PPC Charts
      • Sentiment Analysis Charts
      • Survey Charts
    • Chart Type

      • Box and Whisker Plot
      • Clustered Bar Chart
      • Clustered Column Chart
      • Comparison Bar Chart
      • Control Chart
      • CSAT Survey Bar Chart
      • CSAT Survey Chart
      • Dot Plot Chart
      • Double Bar Graph
      • Funnel Chart
      • Gauge Chart
      • Likert Scale Chart
      • Matrix Chart
      • Multi Axis Line Chart
      • Overlapping Bar Chart
      • Pareto Chart
      • Radar Chart
      • Radial Bar Chart
      • Sankey Diagram
      • Scatter Plot Chart
      • Slope Chart
      • Sunburst Chart
      • Tornado Chart
      • Waterfall Chart
      • Word Cloud
    • Google Sheets
      Microsoft Excel
  • Services
  • Pricing
  • Contact us
  • Blog
  • Support dropdown img
      • Gallery
      • Videos
      • Contact us
      • FAQs
      • Resources
    • Please feel free to contact us

      atsupport@chartexpo.com

Categories
All Data Visualizations Data Analytics Surveys
Add-ons/
  • Google Sheets
  • Microsoft Excel
  • Power BI
All Data Visualizations Data Analytics Surveys
Add-ons
  • Google Sheets
  • Microsoft Excel
  • Power BI

We use cookies

This website uses cookies to provide better user experience and user's session management.
By continuing visiting this website you consent the use of these cookies.

Ok

ChartExpo Survey


Home > Blog > Data Analytics

Procurement Key Performance Indicators for Quick Insights

Are procurement Key Performance Indicators essential for business success? Yes! Companies rely on them to measure efficiency, control costs, and improve supplier relationships. Without clear metrics, procurement teams risk overspending and delays.

Procurement Key Performance Indicators

Poor management leads to wasted resources and missed opportunities. However, strong procurement Key Performance Indicators help track spending, delivery times, and supplier performance. Using a dynamic graph Excel, you can visualize trends and make quick, insightful decisions.

Late deliveries and supplier failures can disrupt operations. Well-defined procurement Key Performance Indicators identify weaknesses before they become costly problems. Merging KPI data in Excel helps combine supplier records and procurement data to create a clearer picture.

Technology is reshaping procurement. Automation and data analytics improve decision-making. Companies using digital procurement tools reduce errors and boost productivity. Measuring key metrics ensures that technology investments deliver real value.

Supplier relationships impact business success. Reliable vendors contribute to quality and efficiency. Poor supplier performance can hurt revenue and reputation. Comparing procurement KPIs tables vs charts helps determine the best way to analyze supplier performance.

Success starts with the correct data. Procurement teams that track performance improve efficiency and cost control. The right metrics drive smarter decisions and better results.

Let’s explore more…

Table of Contents:

  1. What Are Procurement KPIs?
  2. Why Are Procurement KPIs Useful?
  3. 11 Procurement KPI Examples
  4. How to Set Procurement Metrics?
  5. How to Visualize Procurement KPIs in Excel?
  6. Limitations of Procurement KPIs
  7. FAQs
  8. Wrap Up

What Are Procurement KPIs?

Definition: Procurement KPIs assess purchasing performance by tracking costs, efficiency, and supplier reliability. Well-defined KPIs support smarter spending and improved resource management.

Common procurement KPIs include cost savings, supplier performance, and order accuracy. These indicators highlight inefficiencies and areas for improvement. Data-driven decision-making ensures businesses act on insights rather than guesswork.

Tracking procurement KPIs helps companies reduce waste and improve profitability. Using a Chart maker, you can transform raw data into clear visuals and make analysis seamless. Strong procurement KPIs drive efficiency, cost control, and business growth.

Why Are Procurement KPIs Useful?

They provide valuable insights into spending, supplier reliability, and process performance. Companies face higher costs, supply chain disruptions, and missed opportunities without measurable data. Visual analytics of these KPIs helps make complex data easier to understand. Let’s see why tracking the right KPIs leads to smarter decisions and more substantial business outcomes.

  • Cost control and saving: KPIs help recognize needless expenses and reduce costs. Lowering procurement costs can improve profitability.
  • Process efficiency and optimization: These KPIs track the efficiency of the procurement workflows. Moreover, it streamlines processes to enhance productivity, reduce errors, and eliminate delays.
  • Supplier performance management: Procurement evaluates vendors’ reliability, quality of products, and consistency of services. Long-term relationships with suppliers reduce disruptions and strengthen multidisciplinary partnerships.
  • Supply chain security: KPIs ensure suppliers adhere to contracts, regulations, and industry standards. This reduces the risks of being fined and failing to operate.
  • Data strategies: Procurement data provides data-driven insights for improved planning and forecasting. It highlights market trends, helping businesses adapt to changes and allocate resources more effectively.
  • Sustainability & corporate responsibility: Evaluate the company’s practices related to ethical sourcing, environmental sustainability, and social good. Sustainable procurement enhances reputation, secures a better future, and ensures regulatory compliance for companies.

11 Procurement KPI Examples

Businesses rely on procurement KPIs to cut costs, improve efficiency, and strengthen supplier relationships. Data discovery helps uncover hidden trends for better decision-making. Without clear metrics, it’s easy to overspend, face delays, and miss opportunities.

Let’s explore the best procurement KPIs that help keep procurement on track.

Cost Management KPIs

  • Cost Savings: Measures the total amount saved through better pricing and negotiations. Lower costs mean higher profits.
  • Purchase Price Variance (PPV): Compares the actual purchase price to the expected cost. A higher variance signals potential inefficiencies.
  • Cost Avoidance: Tracks expenses prevented through more innovative sourcing and contract negotiations. Reducing hidden costs improves long-term savings.

Process Efficiency KPIs

  • Procurement Cycle Time: Measures the time it takes to complete a purchase from request to approval. Faster cycles boost efficiency and productivity.
  • Purchase Order Accuracy: Ensures that orders match requested quantities, prices, and terms. Fewer mistakes reduce delays and extra costs.
  • Supplier Lead Time: Tracks how long suppliers take to fulfill orders. Shorter lead times improve operational flow.

Supplier Performance KPIs

  • On-time Delivery Rate: This measures the percentage of orders delivered as scheduled. Late deliveries disrupt production and increase costs.
  • Supplier Defect Rate: This KPI tracks the percentage of defective or non-compliant goods. High defect rates affect quality and customer satisfaction.
  • Supplier Performance Score: Evaluates vendor reliability, quality, and responsiveness. A strong score ensures better partnerships.

Compliance and Risk Management KPIs

  • Contract Compliance: Checks if suppliers follow agreed terms and pricing. Non-compliance leads to financial risks.
  • Supplier Risk Score: Evaluates financial health, dependability, and possible risks. A high-risk score signals potential disruption.

How to Set Procurement Metrics?

Setting the right procurement metrics enhances decision-making and operational efficiency. Information design ensures data is presented clearly for better insights. Clear benchmarks help businesses control costs, improve supplier relationships, and drive overall performance. Let’s see how to harmonize these aspects to set insightful procurement metrics.

  1. Support business objectives: Procurement needs to closely correlate with company goals like cost reduction, efficiency, and risk control. Quantitative metrics should align with strategic priorities, ensuring a clear view of progress over time.
  2. Determine core procurement focuses: Look to the critical essential areas like contract compliance, supplier performance, and cost efficiencies. Knowing this lets you focus on the places you will count towards the most.
  3. Select relevant KPIs: The KPIs should include information that can be acted upon,  such as cost savings, supplier lead time, or order accuracy. Relevant KPIs monitor progress and identify areas for improvement.
  4. Set up systems for collecting data: Identify robust tools and procedures for consistently tracking procurement data. Well-organized and accurate data enables more informed and optimal decision-making.
  5. Monitor, analyze, and adjust: Review procurement metrics regularly to spot trends and inefficiencies. Keying into data-derived insights facilitates growth and incrementally better procurement outcomes.

How to Visualize Procurement KPIs in Excel?

Measuring procurement success without KPIs is like driving blindfolded. However, as data tells the story, numbers alone don’t reveal the whole picture. Thus, we rely on data visualizations to make insights clear.

Excel helps track procurement KPIs, but its charts often fall short. Static graphs and limited visuals make trends hard to spot. ChartExpo changes the game. It transforms raw data into clear, interactive visuals. With better insights, procurement decisions become faster and wiser.

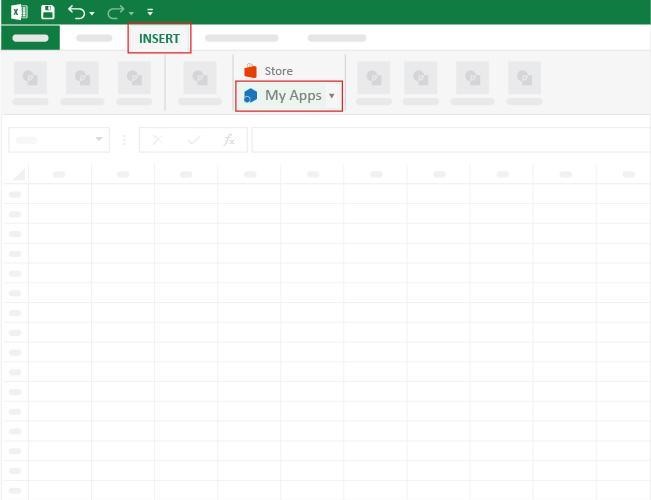
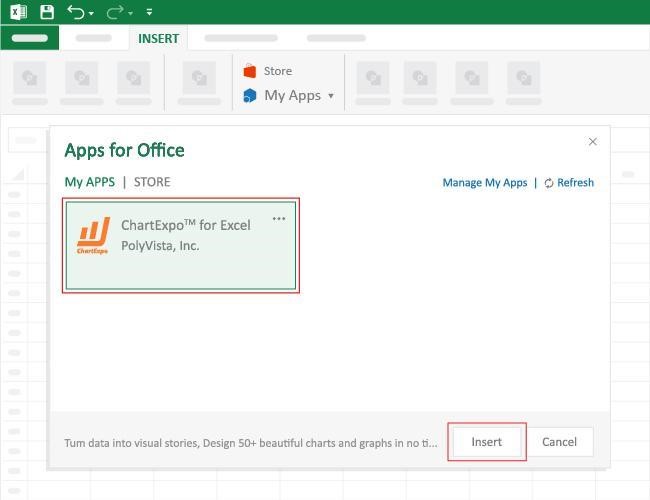
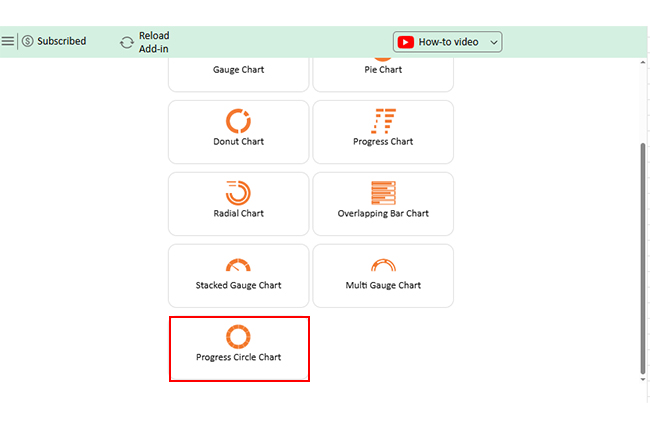
How to Install ChartExpo in Excel?

  1. Open your Excel application.
  2. Open the worksheet and click the “Insert” menu.
  3. You’ll see the “My Apps” option.
  4. In the Office Add-ins window, click “Store” and search for ChartExpo on my Apps Store.
  5. Click the “Add” button to install ChartExpo in your Excel.

ChartExpo charts are available both in Google Sheets and Microsoft Excel. Please use the following CTAs to install the tool of your choice and create beautiful visualizations with a few clicks in your favorite tool.

Example

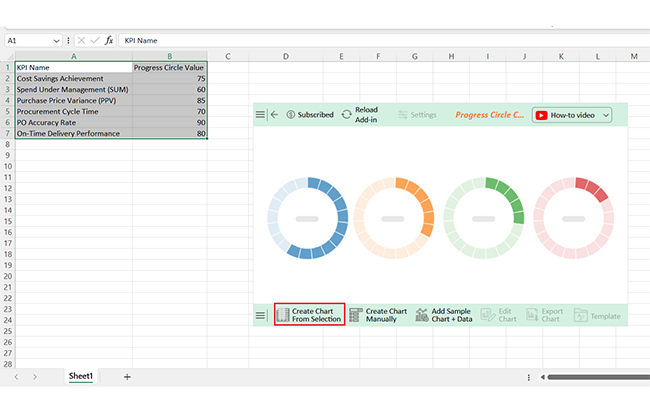
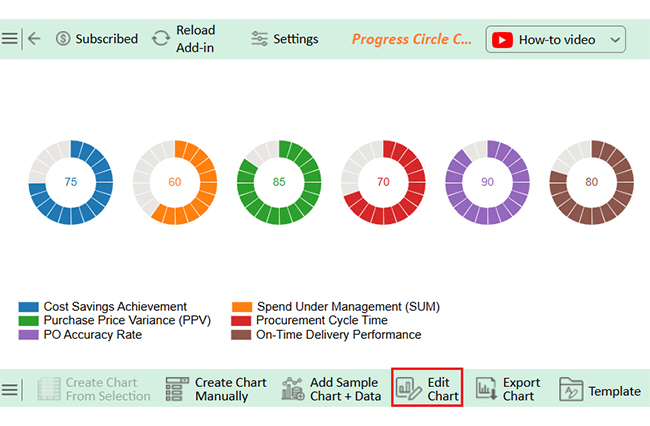
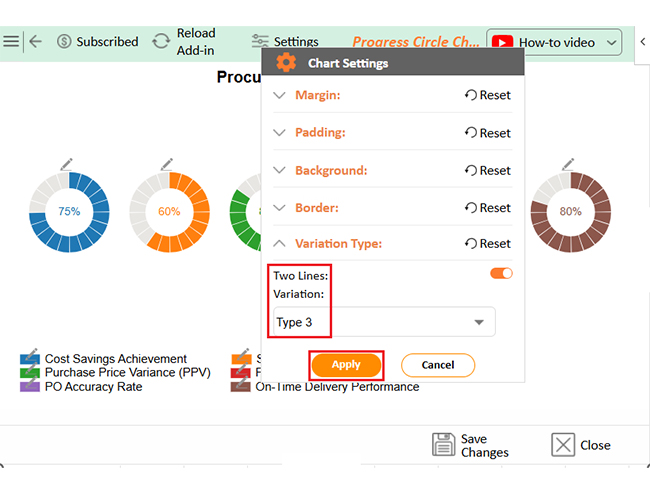
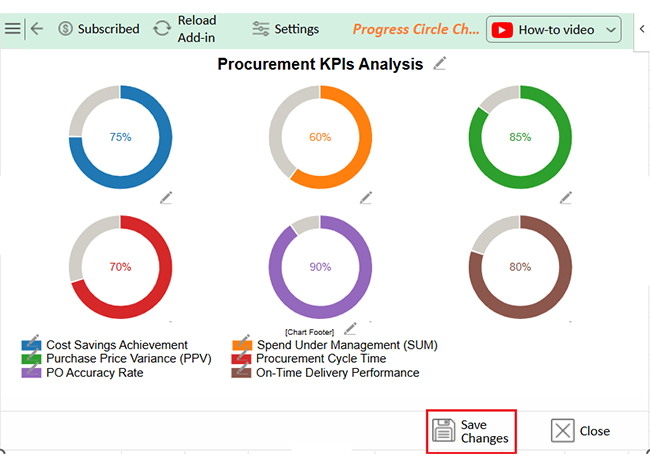
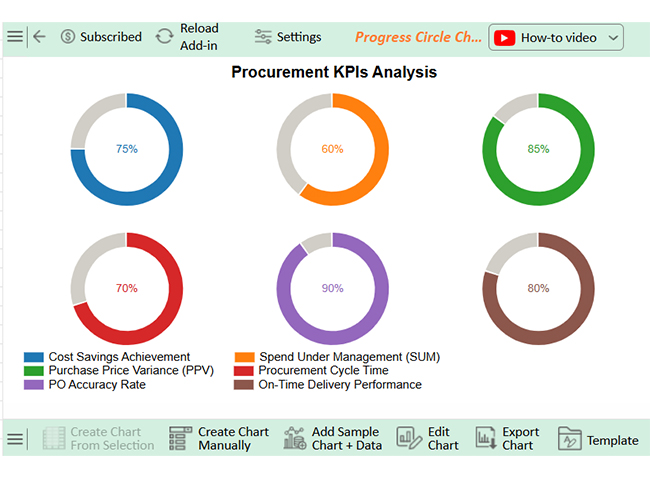
Let’s learn how to add trendlines in Excel using ChartExpo and analyze the visuals:
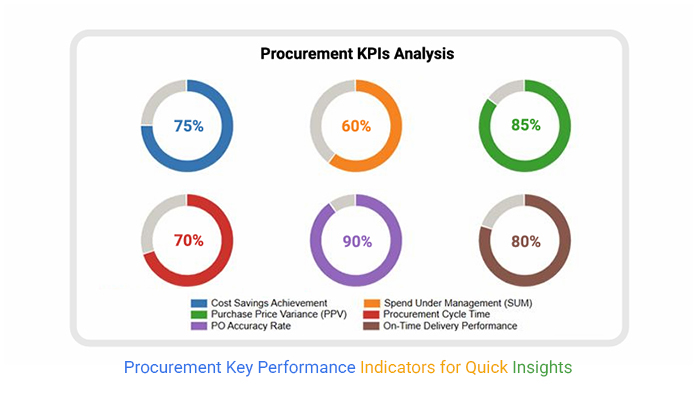
KPI Name Progress Circle Value
Cost Savings Achievement 75
Spend Under Management (SUM) 60
Purchase Price Variance (PPV) 85
Procurement Cycle Time 70
PO Accuracy Rate 90
On-Time Delivery Performance 80
  • To get started with ChartExpo, install ChartExpo in Excel.
  • Now Click on My Apps from the INSERT menu.
Procurement Key Performance Indicators
  • Choose ChartExpo from My Apps, then click Insert.
Procurement Key Performance Indicators
  • Once it loads, scroll through the charts list to locate and choose the “Progress Circle Chart”.
Procurement Key Performance Indicators
  • Click the “Create Chart From Selection” button after selecting the data from the sheet, as shown.
Procurement Key Performance Indicators
  • ChartExpo will generate the visualization below for you.
Procurement Key Performance Indicators
  • If you want to add anything to the chart, click the Edit Chart button:
  • Click the pencil icon next to the Chart Header to change the title.
  • It will open the properties dialog. Under the Text section, you can add a heading in Line 1 and enable Show.
  • Give the appropriate title of your chart and click the Apply button.
Procurement Key Performance Indicators
  • You can add the Percentage sign with all values as follows:
Procurement Key Performance Indicators
  • You can change the Data Representation by clicking on Settings as follows:
Procurement Key Performance Indicators
  • Click “Save Changes” to persist the changes made to the chart.
Procurement Key Performance Indicators
  • Your final Progress Circle Chart will look like the one below.
Procurement Key Performance Indicators

Insights

  • PO Accuracy: 90% – Strong performance
  • PPV: 85% – Well-managed
  • Cost Savings: 75% – Solid progress
  • On-Time Delivery: 80% – Improving
  • SUM: 60% – Needs optimization
  • Procurement Cycle Time: 70% – Room for improvement

Limitations of Procurement KPIs

Procurement KPIs offer insights but have limits. Sure, business analytics adds context, ensuring a balanced view of procurement performance. However, over-focusing on numbers can create blind spots. How?

  • Timeliness of data: KPIs should be updated regularly to provide meaningful insights. Poor decisions and costly mistakes stem from errors, missing data, or outdated information.
  • Focusing too much on savings: Every organization should manage costs, but focusing solely on price can harm quality and supplier relationships. Sometimes, the lowest cost is not the most sustainable or the most efficient.
  • Short-term: The KPIs focus on short-term savings rather than long-term success. Neglecting supplier relationships, innovation, and strategic growth will eventually spell the downfall of procurement.
  • Complexity and resource requirements: Managing multiple KPIs needs sophisticated tools, experienced professionals, and continuous oversight. Procurement generates vast data, making it challenging for small companies to manage and analyze.
  • Resistance to change: Employees and suppliers might resist new performance metrics. Without effective communication and training, KPI tracking may face significant pushback and reduced effectiveness.
  • Interpretation out of context: Procurement KPIs do not always tell the whole story. A high on-time delivery rate might appear impressive, but poor product quality can distort its true impact.

FAQs

In which procurement process can KPIs be used?

KPIs can be used in various procurement processes. They help in supplier selection, ensuring quality and reliability. Accuracy metrics benefit purchase order management, while cost control KPIs track savings. Delivery performance ensures timeliness and contract compliance KPIs reduce risks.

Which KPI is more widely used in procurement?

Cost savings is the most widely used KPI in procurement. It tracks financial efficiency and budget impact. On-time delivery ensures timely supply chain operations, while supplier performance measures reliability. PO accuracy prevents errors, and procurement cycle time improves process efficiency.

Wrap Up

Procurement Key Performance Indicators help businesses track efficiency, cost, and supplier performance. They provide measurable data to improve decision-making and resource management. Without them, procurement operations can become inefficient and costly. Therefore, analyzing procurement metrics vs. KPIs will help you focus on the proper performance indicators.

Clear KPIs help control expenses and highlight areas for savings. Monitoring spending ensures better budget management and prevents information overload from excessive data.

Efficiency matters in procurement. KPIs measure cycle times, order accuracy, and supplier reliability. Faster, error-free processes improve overall productivity.

Supplier performance affects business success. Tracking delivery times, defect rates, and contract compliance ensures strong vendor relationships. Reliable suppliers reduce risks and delays.

Risk management is essential. Procurement KPIs help businesses avoid financial losses and regulatory issues. Identifying risks prevents costly disruptions. Learning how to extrapolate in Excel can help forecast future trends based on procurement data.

Effective procurement KPIs drive more innovative strategies. They support long-term success by improving cost control, efficiency, and supplier management. Businesses that track the right KPIs gain a competitive advantage.

Do not hesitate;

Install ChartExpo for better procurement KPIs data visualization and analysis.

How much did you enjoy this article?

PBIAd1
Start Free Trial!
149896

Related articles

next previous
Data Analytics10 min read

Supplier Comparison Template: Download It Now

A supplier comparison template streamlines vendor evaluation by comparing cost and quality. Click here to learn its benefits and how to analyze them.

Data Analytics32 min read

Ecommerce Analytics: How to Fix What It Often Gets Wrong

Ecommerce analytics often lead to mixed signals and costly misreads. Fix attribution gaps, align teams, and act on the right data. Get started now!

Data Analytics30 min read

When Sales Funnel Breaks: Failures, Fixes, & Funnel Debt

Is your sales funnel hiding costly gaps? Learn how pipeline stalls, false metrics, and handoff chaos could be draining revenue. Get started now!

Data Analytics29 min read

Correlation Analysis: Don’t Worship Correlation, Question It.

Correlation analysis helps spot patterns, avoid costly mistakes, and guide decisions with data that matters. Want smarter strategy? Get started now!

Data Analytics33 min read

Product Analytics for Decisions, Not Decoration

Product analytics can mislead more than it guides. Learn how to spot false signals, wasted tools, and hidden churn before decisions go wrong. Read on!

ChartExpo logo

Turn Data into Visual
Stories

CHARTEXPO

  • Home
  • Gallery
  • Videos
  • Services
  • Pricing
  • Contact us
  • FAQs
  • Privacy policy
  • Terms of Service
  • Sitemap

TOOLS

  • ChartExpo for Google Sheets
  • ChartExpo for Microsoft Excel
  • Power BI Custom Visuals by ChartExpo
  • Word Cloud

CATEGORIES

  • Bar Charts
  • Circle Graphs
  • Column Charts
  • Combo Charts
  • Comparison Charts
  • Line Graphs
  • PPC Charts
  • Sentiment Analysis Charts
  • Survey Charts

TOP CHARTS

  • Sankey Diagram
  • Likert Scale Chart
  • Comparison Bar Chart
  • Pareto Chart
  • Funnel Chart
  • Gauge Chart
  • Radar Chart
  • Radial Bar Chart
  • Sunburst Chart
  • see more
  • Scatter Plot Chart
  • CSAT Survey Bar Chart
  • CSAT Survey Chart
  • Dot Plot Chart
  • Double Bar Graph
  • Matrix Chart
  • Multi Axis Line Chart
  • Overlapping Bar Chart
  • Control Chart
  • Slope Chart
  • Clustered Bar Chart
  • Clustered Column Chart
  • Box and Whisker Plot
  • Tornado Chart
  • Waterfall Chart
  • Word Cloud
  • see less

RESOURCES

  • Blog
  • Resources
  • YouTube
SIGN UP FOR UPDATES

We wouldn't dream of spamming you or selling your info.

© 2025 ChartExpo, all rights reserved.