Categories
What is an operating budget spreadsheet? If you’ve ever wondered how businesses keep their finances on track, this tool is the key. An operating budget spreadsheet helps you plan, monitor, and control your income and expenses. It’s also essential for data modeling in Google Sheets, allowing you to analyze and organize financial data more effectively.
Managing finances without a clear plan is risky. An operating budget spreadsheet gives a structured approach to forecasting revenue and controlling costs. It acts as a financial map, helping businesses allocate resources effectively. Whether estimating quarterly profits or tracking overhead expenses, every decision becomes clearer with a reliable spreadsheet.


Budgets aren’t only for corporations. Businesses and individuals benefit from tracking expenses. Therefore, having an operating budget spreadsheet isn’t optional but essential. Identifying potential shortfalls allows room for adjustments before issues escalate. Tools like the expense report template in Google Sheets simplify this process, offering pre-built layouts to streamline data entry.
The format of these spreadsheets varies. Some use simple columns for revenue, costs, and profit margins, while others include detailed breakdowns for departments or projects. Customization makes them versatile, fitting unique business needs. The best-designed dashboards also play a key role in presenting this data visually, turning numbers into actionable insights.
Using a spreadsheet minimizes risks and provides a clear view of financial health. Whether you’re a startup founder or managing a personal side hustle, mastering this tool is a game-changer.
Is your budget set up to guide your success? Let me take you on an insightful trip…
Definition: An operating budget spreadsheet is a tool for planning and tracking income and expenses. Businesses rely on it to forecast revenue, manage costs effectively, and conduct cohort analysis for deeper insights.
Having a structured budget is essential for financial stability. This spreadsheet organizes financial data, highlights potential shortfalls, and supports informed decisions. Whether for businesses or individuals, it ensures better economic management and helps avoid costly mistakes.
Managing budgets doesn’t have to feel like a chore. Why? Because Google Sheets gets you powerful tools that make the process easier, faster, and more collaborative. Its features make data presentation and analysis more effective and visually appealing. Here’s why it’s a must-have:
Managing expenses doesn’t have to be complicated. With the right spreadsheet, you can take control of your finances effortlessly. Here’s how the operating expenses spreadsheet helps:
When creating an operating budget in Google Sheets, it’s important to have a clear structure. This will help you manage and track all financial aspects of your business, making data analysis accurate and impactful.
Here are six key points to consider:
Creating an operating budget spreadsheet is simple and brings clarity to your finances, especially when applying performance-based budgeting. Whether for business or personal use, it tracks income and expenses effectively. If you’re unsure where to begin, learning how to create a monthly budget in Google Sheets is a great first step. Ready to start? Let’s dive in.
An operating budget spreadsheet is your blueprint for managing finances. It tracks revenue, expenses, and cash flow, keeping your business on course. But raw numbers can only do so much. Analyzing and interpreting data helps turn those numbers into actionable insights.
Data visualization makes analysis faster and easier. Unfortunately, Google Sheets has limited options for dynamic, professional visuals.
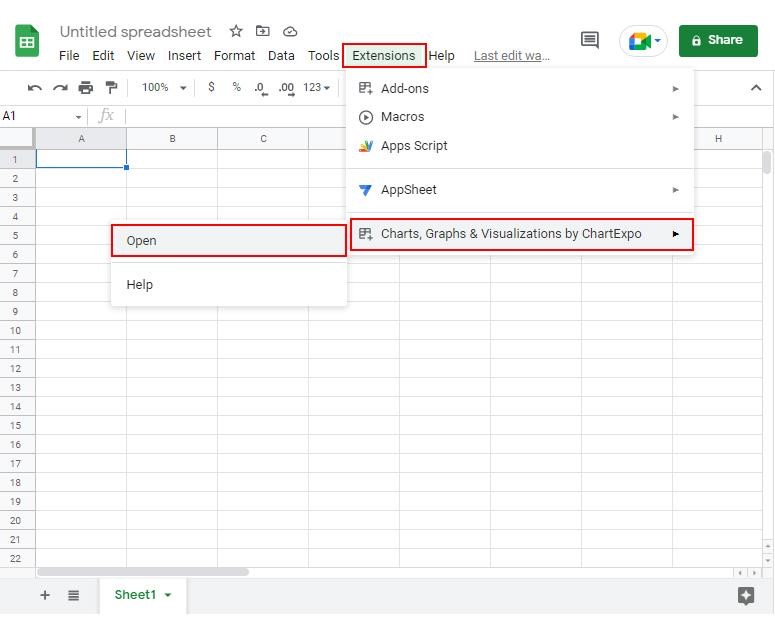
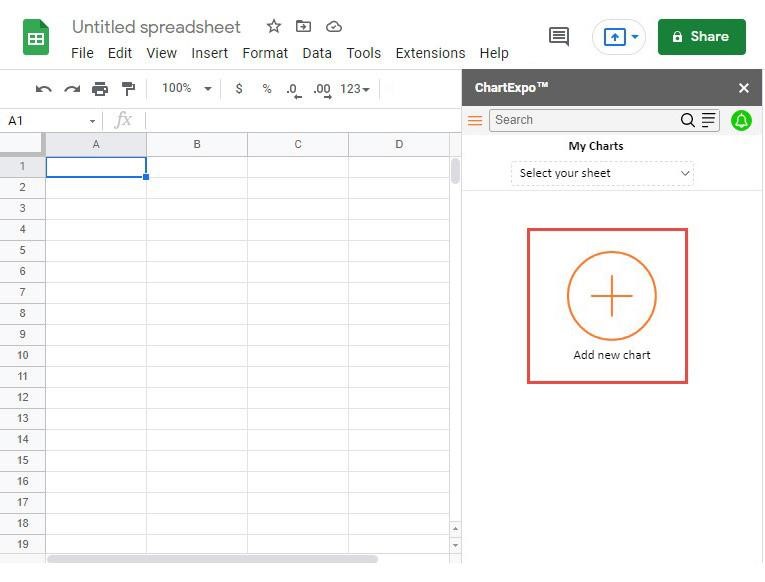
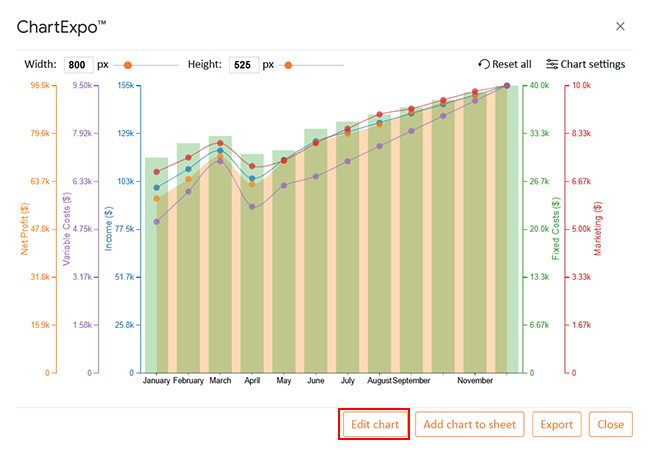
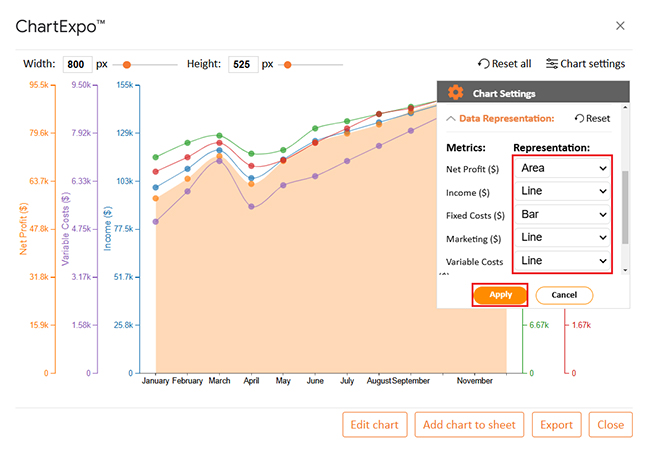
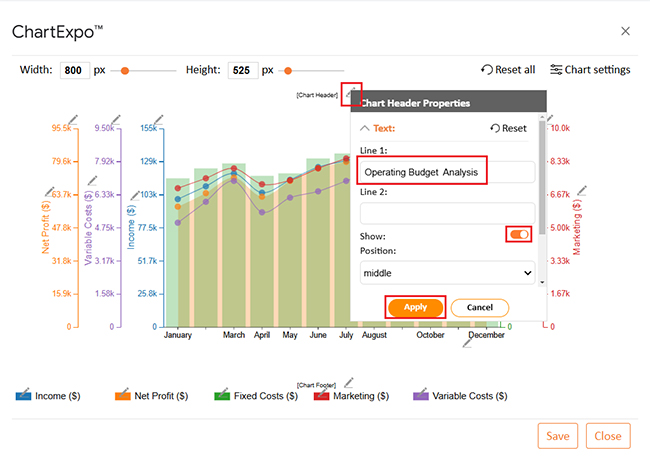
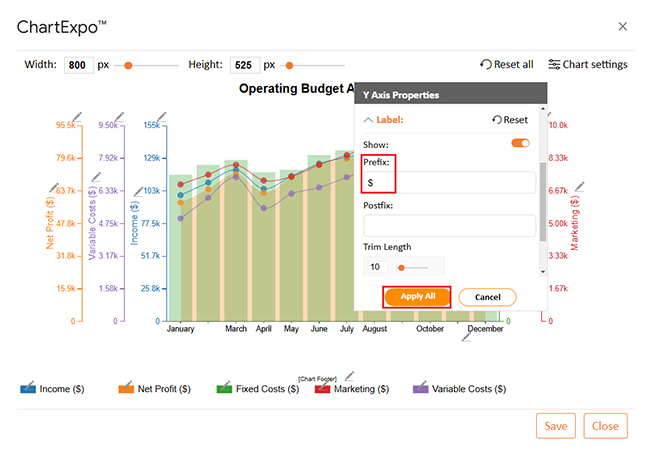
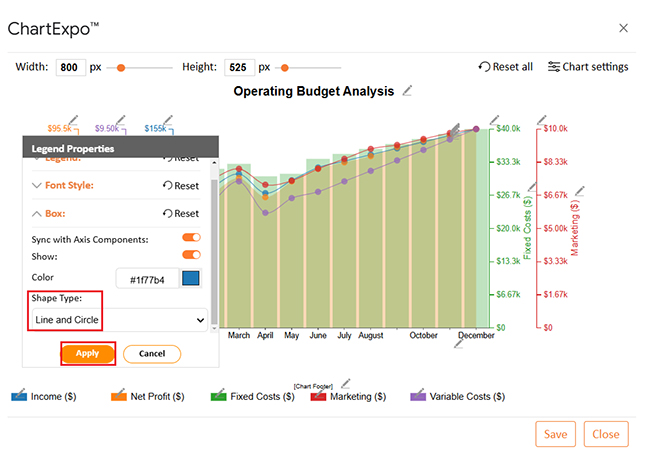
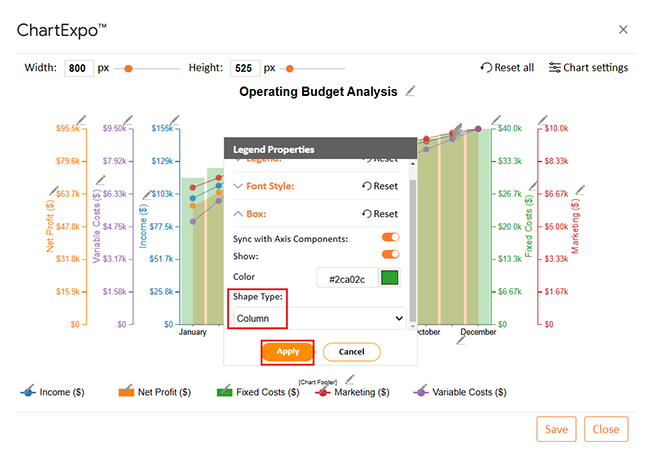
That’s where ChartExpo steps in. It’s a powerful add-on that fills the gap, offering insightful, easy-to-create charts for smarter decision-making.
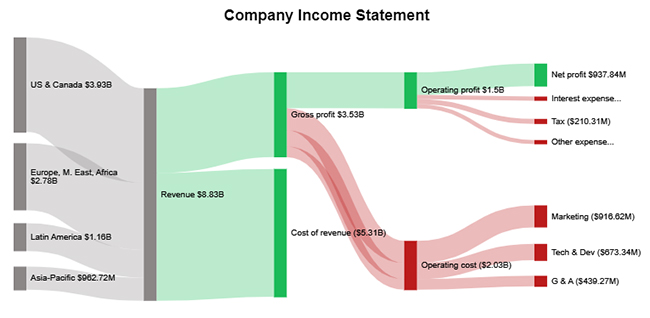
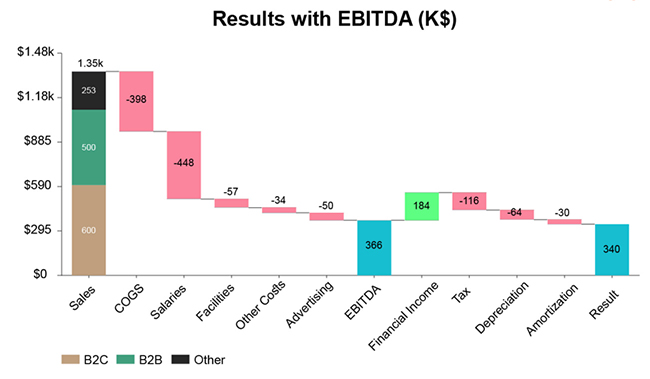
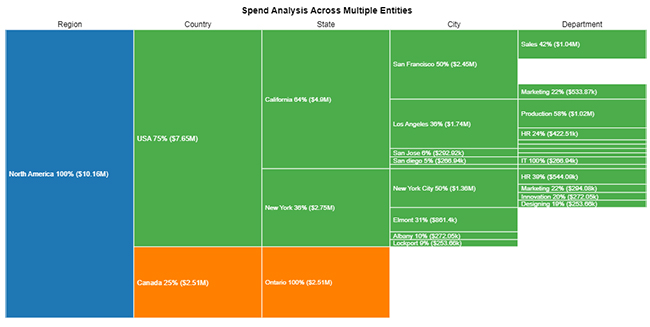
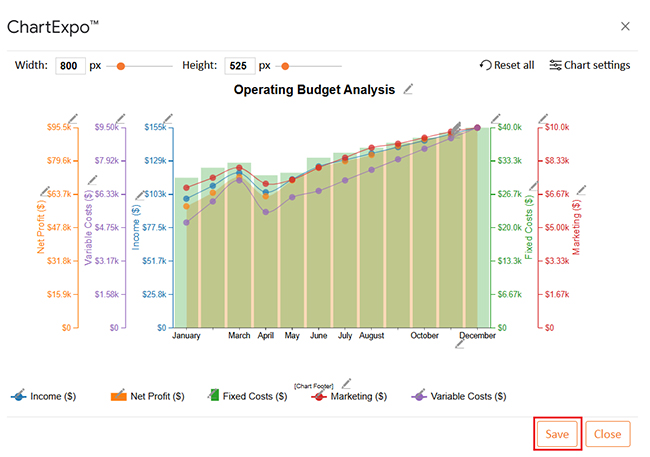
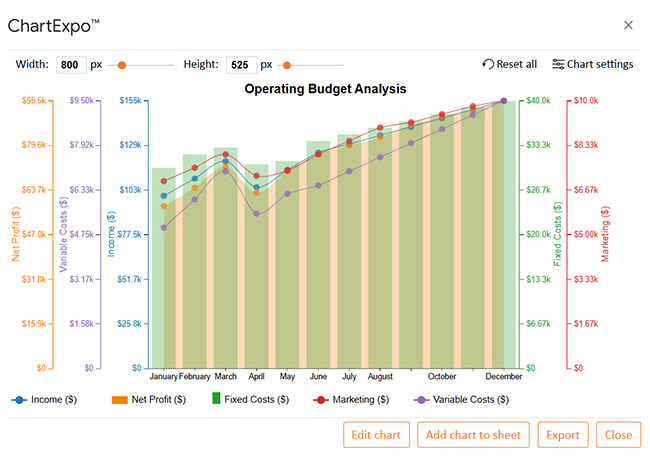
The charts below include a Sankey diagram in Google Sheets using ChartExpo:
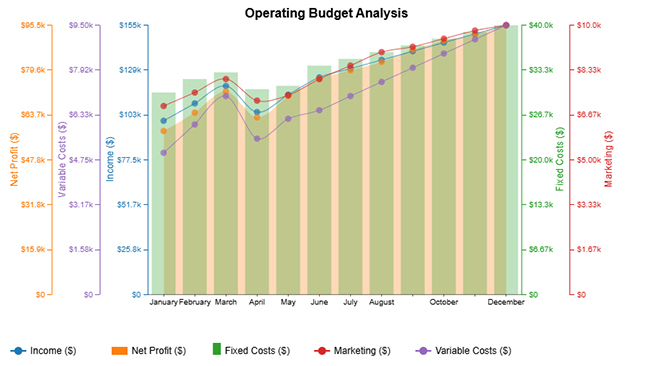
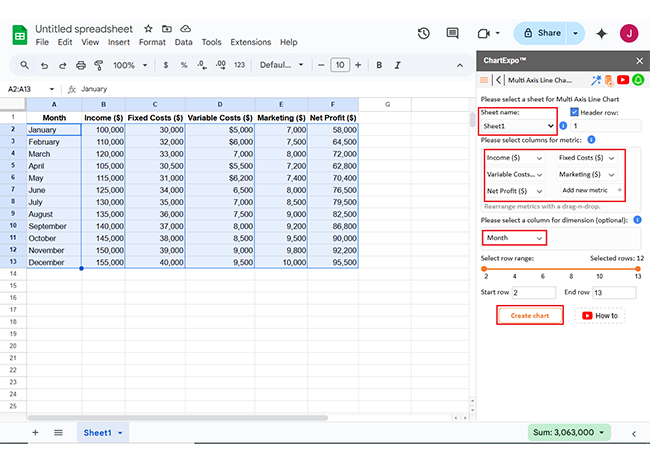
Let’s use the data below to learn how to transpose data in Google Sheets using ChartExpo.
| Month | Income ($) | Fixed Costs ($) | Variable Costs ($) | Marketing ($) | Net Profit ($) |
| January | 100000 | 30000 | 5000 | 7000 | 58000 |
| February | 110000 | 32000 | 6000 | 7500 | 64500 |
| March | 120000 | 33000 | 7000 | 8000 | 72000 |
| April | 105000 | 30500 | 5500 | 7200 | 62800 |
| May | 115000 | 31000 | 6200 | 7400 | 70400 |
| June | 125000 | 34000 | 6500 | 8000 | 76500 |
| July | 130000 | 35000 | 7000 | 8500 | 79500 |
| August | 135000 | 36000 | 7500 | 9000 | 82500 |
| September | 140000 | 37000 | 8000 | 9200 | 86800 |
| October | 145000 | 38000 | 8500 | 9500 | 90000 |
| November | 150000 | 39000 | 9000 | 9800 | 92200 |
| December | 155000 | 40000 | 9500 | 10000 | 95500 |
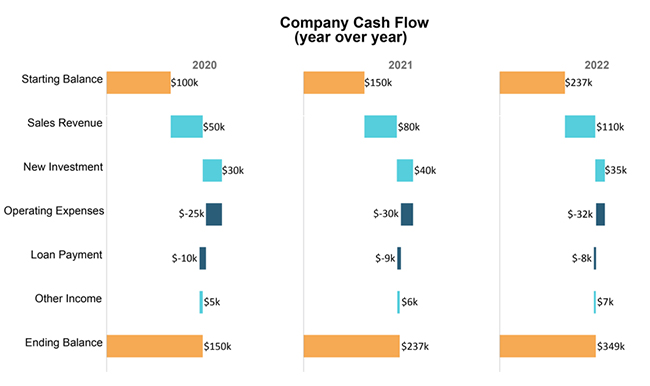
Using a Google Sheets operating budget template is an excellent way to manage your finances. It’s simple, efficient, and eliminates the need to create a spreadsheet from scratch. Moreover, cash flow analysis helps track your financial movement more effectively.
Here’s how to get the most out of it.
To create an operating budget in Google Sheets:
An operating budget spreadsheet is a powerful tool for managing finances. It organizes income and expenses into a clear, actionable format. Businesses and individuals use it to stay in control of their financial goals. Pairing this with an income statement template in Google Sheets can offer further insights into overall economic performance.
This spreadsheet helps forecast revenue and track spending, ensuring that resources are allocated wisely. However, its effectiveness depends on consistent updates and accuracy. Multivariate analysis can also identify relationships between variables, providing deeper insights into financial data.
Creating and maintaining an operating budget spreadsheet is essential. It highlights potential shortfalls early, giving you time to adjust. This proactive approach prevents unnecessary financial stress. Additionally, the spreadsheet simplifies decision-making.
With all data in one place, you can compare actual performance against your budget. Moreover, using a price comparison template in Google Sheets helps you manage costs. The spreadsheet also fosters accountability. It encourages discipline in managing money. Whether for a small business or personal use, it helps avoid overspending.
In conclusion, an operating budget spreadsheet is more than just numbers. It’s a roadmap for financial success. By merging it with ChartExpo, you can transform your data into clear, actionable insights. Regular updates and reviews, paired with visually impactful charts, will guide you toward achieving your goals.
How much did you enjoy this article?


SUMPRODUCT in Google Sheets handles multi-condition calculations without extra columns. Master its syntax, uses, and errors. Read on!

An annual budget template in Google Sheets organizes your yearly finances, tracks every dollar, and reveals spending patterns. Read on!

Learn the best graph to show profit and loss with practical examples and use cases. Discover how to visualize your business data, track trends, and make smarter financial decisions.


