• Home
  • Tools dropdown img
    • Spreadsheet Charts

      • ChartExpo for Google Sheets
      • ChartExpo for Microsoft Excel
    • Power BI Charts

      • Power BI Custom Visuals by ChartExpo
    • Word Cloud

  • Charts dropdown img
    • Chart Category

      • Bar Charts
      • Circle Graphs
      • Column Charts
      • Combo Charts
      • Comparison Charts
      • Line Graphs
      • PPC Charts
      • Sentiment Analysis Charts
      • Survey Charts
    • Chart Type

      • Box and Whisker Plot
      • Clustered Bar Chart
      • Clustered Column Chart
      • Comparison Bar Chart
      • Control Chart
      • CSAT Survey Bar Chart
      • CSAT Survey Chart
      • Dot Plot Chart
      • Double Bar Graph
      • Funnel Chart
      • Gauge Chart
      • Likert Scale Chart
      • Matrix Chart
      • Multi Axis Line Chart
      • Overlapping Bar Chart
      • Pareto Chart
      • Radar Chart
      • Radial Bar Chart
      • Sankey Diagram
      • Scatter Plot Chart
      • Slope Chart
      • Sunburst Chart
      • Tornado Chart
      • Waterfall Chart
      • Word Cloud
    • Google Sheets
      Microsoft Excel
  • Services
  • Pricing
  • Contact us
  • Blog
  • Support dropdown img
      • Gallery
      • Videos
      • Contact us
      • FAQs
      • Resources
    • Please feel free to contact us

      atsupport@chartexpo.com

Categories
All Data Visualizations Data Analytics Surveys
Add-ons/
  • Google Sheets
  • Microsoft Excel
  • Power BI
All Data Visualizations Data Analytics Surveys
Add-ons
  • Google Sheets
  • Microsoft Excel
  • Power BI

We use cookies

This website uses cookies to provide better user experience and user's session management.
By continuing visiting this website you consent the use of these cookies.

Ok

ChartExpo Survey


Home > Blog > Google Sheets

Bookkeeping Spreadsheets for Small Business for Insights

What are bookkeeping spreadsheets for small businesses? They are tools that simplify managing finances and tracking expenses. For many small business owners, keeping financial records organized is a challenge. Yet, accurate bookkeeping is crucial. It helps track cash flow, measure profitability, and prepare for taxes while avoiding information overload.

Bookkeeping spreadsheets for small businesses help avoid these challenges. They allow you to monitor every dollar coming in and going out. Spreadsheets are flexible and customizable, providing tools for data presentation and visualizations to suit specific needs.

Bookkeeping Spreadsheets for Small Business

Small businesses often operate with limited resources, and hiring an accountant might not always be feasible. Spreadsheets provide a cost-effective alternative. Tools like Excel and Google Sheets extensions make managing finances more accessible without requiring advanced software.

These tools are easy to learn and implement. You can create templates for invoices, expense tracking, and budgets. Automation features, such as formulas, save time and reduce errors, turning raw data into meaningful insights.

Bookkeeping spreadsheets for small businesses also promote transparency. They allow you to share clear financial data with partners, investors, or lenders, fostering trust and credibility.

Whether starting or scaling up, spreadsheets keep financial records organized. Combined with tools like Google Sheets Extensions and data visualizations, these spreadsheets give a smart route toward long-term success.

Let’s dive deep and learn more about bookkeeping spreadsheets for a small business.

Table of Contents:

  1. What is a Bookkeeping Spreadsheet for a Small Business?
  2. Why Use Accounting Spreadsheets for Small Businesses?
  3. 10 Best Bookkeeping Templates to Help Your Business
  4. How to Create a Small Business Bookkeeping System in Google Sheets?
  5. How to Analyze Google Sheets Bookkeeping Template?
  6. Wrap Up

First…

What is a Bookkeeping Spreadsheet for a Small Business?

Definition: A bookkeeping spreadsheet is a simple yet powerful tool for tracking finances. It helps organize income, expenses, and other financial data. Small businesses use it to monitor cash flow, plan budgets, and prepare for taxes.

Spreadsheets can be created in Excel, Google Sheets, or similar software. With Google Sheets you can even create dashboards in Google Sheets to visualize key financial metrics. They are customizable and easy to use.

Formulas and accounting spreadsheet templates save time and reduce errors. They provide an affordable solution for maintaining accurate financial records.

Why Use Accounting Spreadsheets for Small Businesses?

Managing finances is a priority for every small business owner. Using accounting spreadsheets for small businesses offers a simple yet powerful way to stay in control. These tools are practical, efficient, and accessible to anyone, regardless of their accounting experience.

Here’s why you should use these spreadsheets:

  • Cost-effective solution: Spreadsheets provide a budget-friendly alternative. They let you manage your books without breaking the bank.
  • Customization and flexibility: Spreadsheets allow you to tailor templates to fit your specific needs. You can create custom formulas and layouts for better organization.
  • Clear and organized financial overview: Spreadsheets help you see the bigger picture: track income, expenses, and cash flow in one place. An organized overview simplifies decision-making.
  • Easy record-keeping and access: Store your financial data in a spreadsheet and access it anytime. With cloud-based tools like Google Sheets, your records are always at your fingertips.
  • Compliance and tax preparation: Accurate records prepare you for the tax season. Spreadsheets help you stay compliant with financial regulations by keeping everything organized and up to date.

10 Best Bookkeeping Templates to Help Your Business

Keeping track of business finances can be overwhelming, but the right tools make it easier. Bookkeeping templates simplify management, save time, and reduce errors. Google Sheets, a popular alternative to Excel, offers free, flexible options for small businesses.

  1. Income statement template: This template tracks revenue and expenses to show your profits. It’s a must-have for understanding your business’s financial health.
  2. Balance sheet template: Use this to monitor your assets, liabilities, and equity. It provides a snapshot of your business’s financial standing at any time.
  3. Cash flow statement template: This template tracks money entering and leaving your business. It helps you avoid cash shortages and plan ahead.
  4. Expense tracking template: This template helps you record every expense and stay on top of your spending.
  5. Accounts receivable template: Never miss a payment again. This template lets you monitor outstanding invoices and track what customers owe.
  6. Accounts payable template: Keep your bills organized to maintain smooth operations and ensure timely vendor payments. This simple practice supports cash flow and enhances your data analytics. How? By providing clear, actionable insights into your financial obligations.
  7. Payroll template: Simplify paying employees by tracking salaries, taxes, and deductions.
  8. Sales tracker template: Analyze your sales trends and easily identify growth opportunities.
  9. Budgeting template: Plan your spending and savings to achieve financial stability.
  10. Tax preparation template: Stay ready for tax season by organizing records in one place.

How to Create a Small Business Bookkeeping System in Google Sheets?

Google Sheets is a free and flexible tool that can help you manage your business finances effectively. It also offers powerful visualization options for effective data storytelling. Follow these steps to set up a simple yet powerful bookkeeping system:

  • Start with a new Google sheet: Create a new spreadsheet and give it a simple, straightforward name. This will be your centralized hub for tracking all financial activities.
  • Structure and organize tabs: Set up separate tabs for Income, Expenses, Budget, and Cash Flow to keep your data well-organized. In each tab, define columns like Date, Description, Category, Amount, and Balance for easy tracking.
  • Add clever formulas for automation: Use formulas to simplify calculations, such as =SUM(range) for totals and running balance formulas to monitor cash flow. Automating repetitive tasks reduces errors and saves you valuable time.
  • Categorize income and expenses: Create a list of income and expense categories to label transactions, such as Sales, Rent, or Marketing. Use dropdown menus for quick selection, ensuring consistency and more straightforward analysis.
  • Create a budget and monitor cash flow: In the Budget tab, set monthly or yearly spending limits by category and track actuals against goals. Use the Cash Flow tab to monitor inflows and outflows, ensuring you avoid cash shortages.
  • Update and review regularly: Schedule routine updates to record new transactions and reconcile them with bank statements. Regular reviews help you spot trends, catch errors, and make informed financial decisions.

How to Analyze Google Sheets Bookkeeping Template?

Bookkeeping spreadsheets are the lifeline of small businesses. They track expenses, revenue, and everything in between. However, raw numbers can be overwhelming without proper tools for data analysis and visualization. Visual analytics simplifies complex information, making decisions smarter and more effective.

Data visualization makes analysis simpler and decisions sharper. However, while Google Sheets is great for organizing data, its native tools can feel limiting. Enter ChartExpo—a powerful add-on that enhances your data analysis capabilities. It transforms your spreadsheets into insightful, eye-catching visuals, making visual analytics accessible and impactful.

ChartExpo is the perfect solution for making sense of your numbers easily. By integrating advanced charts and graphs, it turns ordinary spreadsheets into dynamic tools for decision-making.

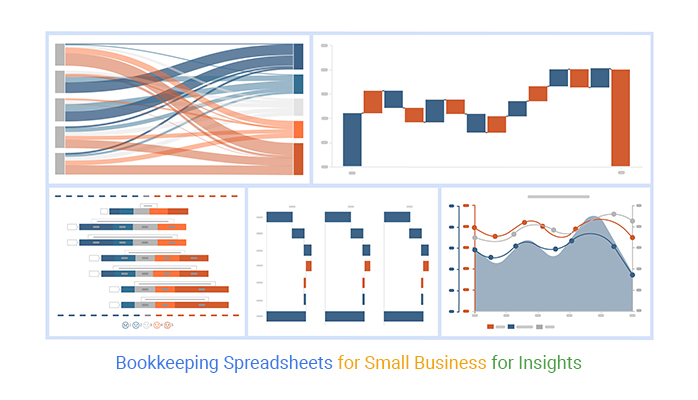
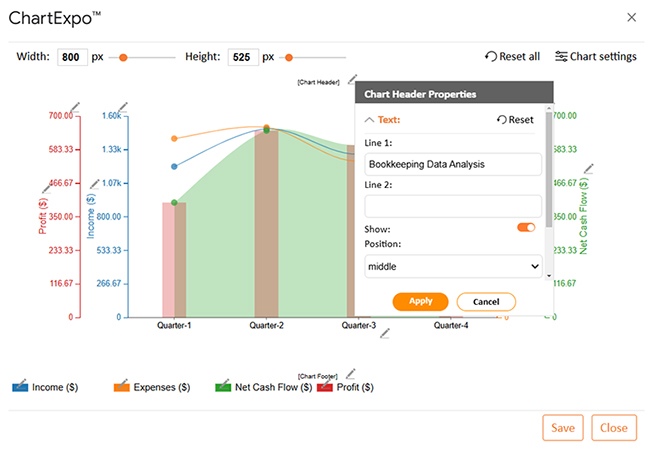
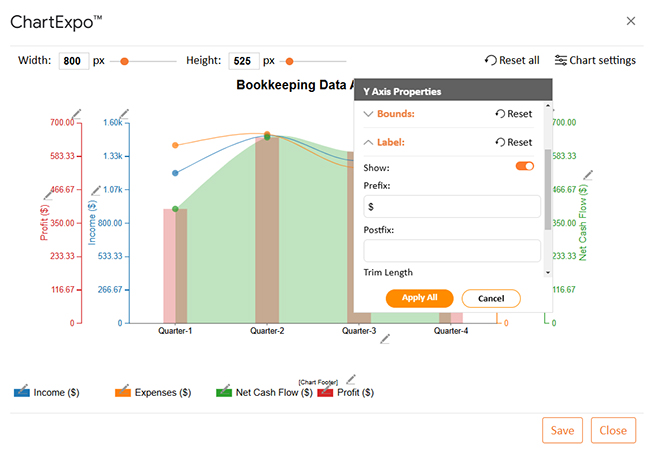
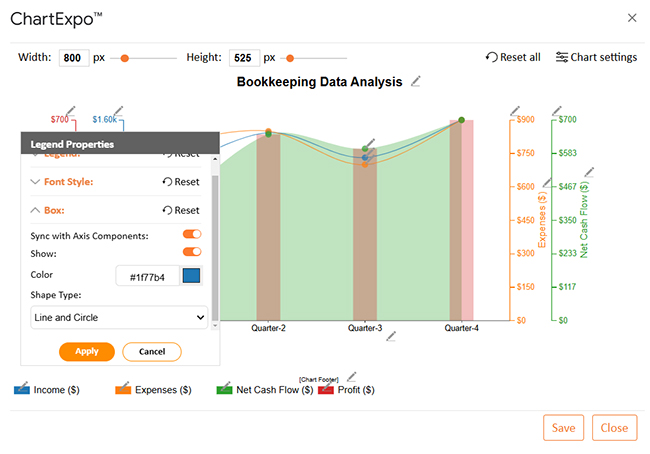
The charts below were created in Google Sheets using ChartExpo:

Multi-Axis Line Chart

Multi Axis Line Chart After Learning Bookkeeping Spreadsheets for Small Business

Horizontal Waterfall Chart

Horizontal Waterfall Chart After Learning Bookkeeping Spreadsheets for Small Business

Likert Scale Chart

Likert Scale Chart After Learning Bookkeeping Spreadsheets for Small Business

Sankey Chart

Sankey Chart After Learning Bookkeeping Spreadsheets for Small Business

Waterfall Chart

Waterfall Chart After Learning Bookkeeping Spreadsheets for Small Business

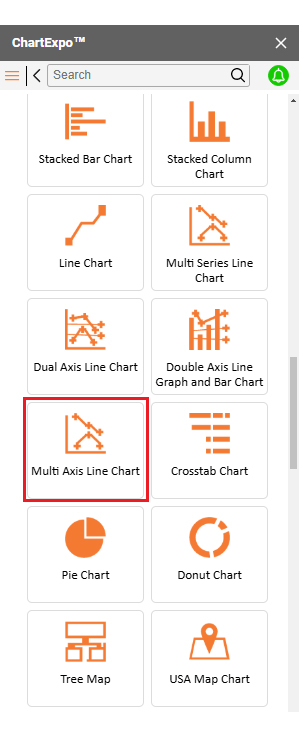
Let’s learn how to install ChartExpo in Google Sheets.

  1. To start using ChartExpo, download it directly from the Google Sheets program. To do this, select Extensions from the top toolbar.
  2. A menu will appear. Click the Get add-ons option.
  3. Search for ChartExpo, and click on Charts, Graphs & Visualizations by ChartExpo when it appears in the results.
  4. Click the Install button. You will have to confirm your Google account and accept some permissions.

ChartExpo charts are available both in Google Sheets and Microsoft Excel. Please use the following CTAs to install the tool of your choice and create beautiful visualizations in a few clicks in your favorite tool.

Example

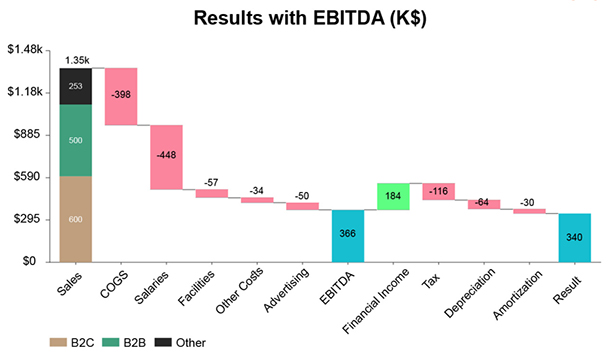
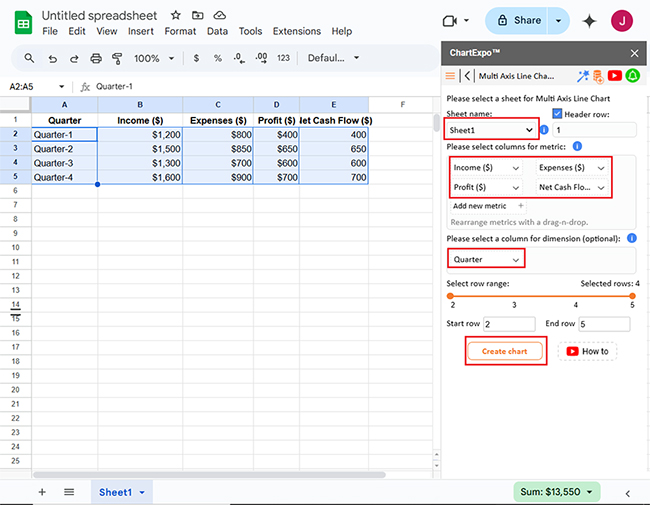
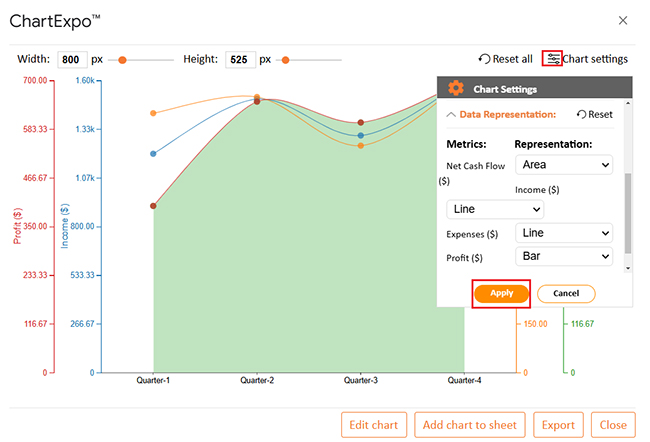
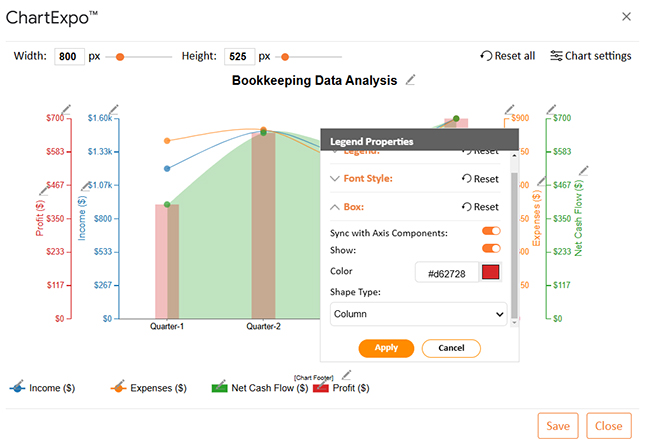
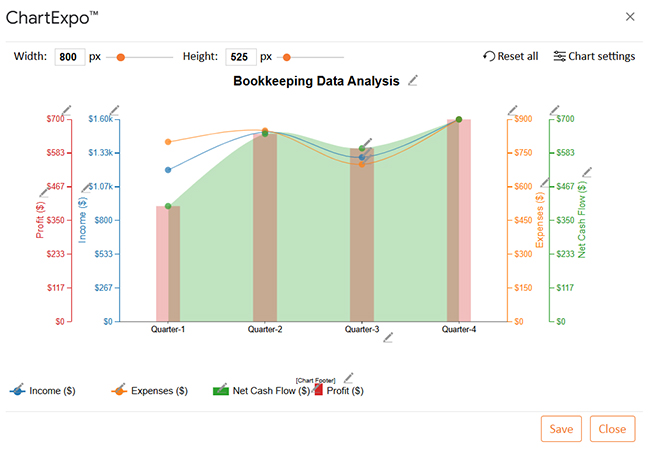
Let’s use the data below to learn how to create a chart in Google Sheets using ChartExpo for analyzing and interpreting data effectively.

Quarter Income ($) Expenses ($) Profit ($) Net Cash Flow ($)
Quarter-1 $1,200 $800 $400 400
Quarter-2 $1,500 $850 $650 650
Quarter-3 $1,300 $700 $600 600
Quarter-4 $1,600 $900 $700 700
  • To get started with ChartExpo, install ChartExpo in Google Sheets.
  • Go to Extensions > Charts, Graphs & Visualizations by ChartExpo > Open.
open chartexpo in google sheets
  • To access the charts library, click the Add new chart button.
add new chart in google sheets
  • Once it loads, scroll through the charts list to locate and choose the “Multi-Axis Line Chart”.
search multi axis line chart in google sheets
  • Click the “Create Chart” button after selecting the data from the sheet, as shown.
Click Create Chart After Learning Bookkeeping Spreadsheets for Small Business
  • If you want to add anything to the chart, click the Edit Chart button:
Click Edit Chart After Learning Bookkeeping Spreadsheets for Small Business
  • Click on Settings and change the “Data Representation” as follows.
Change Data Representation After Learning Bookkeeping Spreadsheets for Small Business
  • Click the pencil icon next to the Chart Header to change the title.
  • It will open the properties dialog. Under the Text section, you can add a heading in Line 1 and enable Show.
  • Give the appropriate title of your chart and click the Apply button.
Add Chart Header After Learning Bookkeeping Spreadsheets for Small Business
  • You can add the Dollar Sign ($) with all values and also change the precision value to zero as follows:
Add Prefix with All Values After Learning Bookkeeping Spreadsheets for Small Business
  • You can change the label shape of Income and Net Cash Flow into “Line and Circle” as follows:
Change Label Shape of Income and Net Cash Flow After Learning Bookkeeping Spreadsheets for Small Business
  • You can change the label shape of Profit into “Column” as follows:
Change Label Shape of Profit into Column After Learning Bookkeeping Spreadsheets for Small Business
  • After making all the changes, you can click on the “Save” button as follows:
Click Save Button After Learning Bookkeeping Spreadsheets for Small Business
  • Your final Multi Axis Line Chart will look like the one below.
Final Bookkeeping Spreadsheets for Small Business

Insights

  • Income and profit grow steadily each quarter.
  • Expenses increase but remain well-managed.
  • Profit margins stay positive, with improving net cash flow.
  • Quarter 4 marks the peak for income and profit.
  • Controlled expenses support profitability and healthy cash flow all year.

Enhancing Small Business Bookkeeping with Charting in Google Sheets:

  1. Open your Google Sheets Application.
  2. Install ChartExpo Add-in for Google Sheets from Google Workspace Marketplace.
  3. Select the Multi Axis Line Chart from the list of charts.
  4. Fill in the necessary fields.
  5. Click on the “Create Chart” button.
  6. Customize your chart properties to add header, axis, legends, and other required information.
  7. Export your chart and share it with your audience.

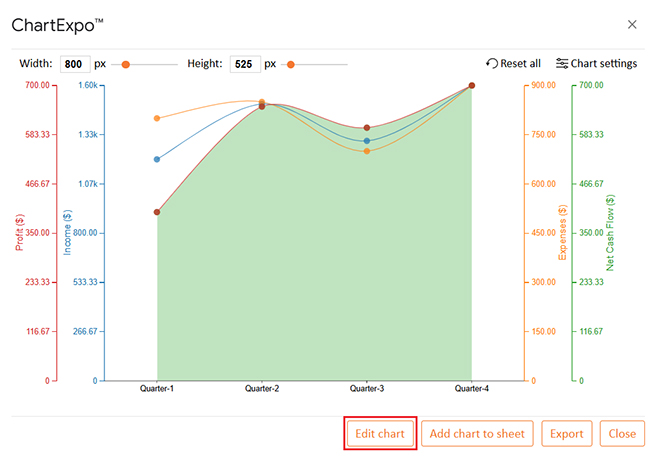
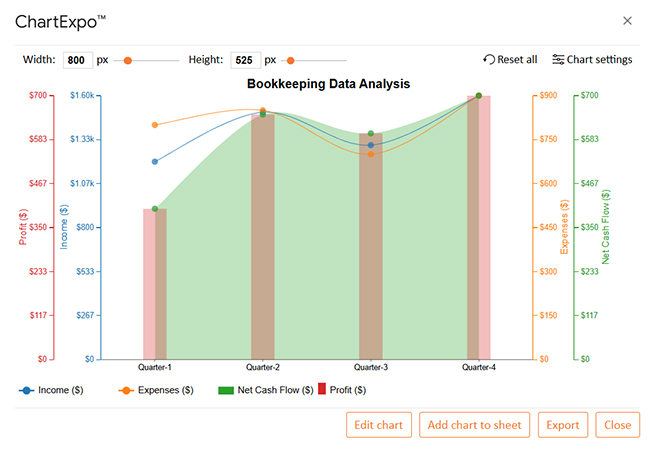
The following video will help you to create a Multi Axis Line Chart in Google Sheets.

FAQs

How do I make a bookkeeping Spreadsheet?

  • Create a new spreadsheet.
  • Add tabs for Income, Expenses, and Cash Flow.
  • Include columns for Date, Description, Category, and Amount.
  • Use formulas for totals and balances.
  • Categorize transactions.
  • Regularly update and review to maintain accuracy and track finances.

Can you use Google Sheets for bookkeeping?

Yes, Google Sheets is great for bookkeeping. You can track income, expenses, and cash flow. Use formulas for automatic calculations. It’s easy to update and access from anywhere, making it perfect for small business management.

Wrap Up

Bookkeeping spreadsheets for small businesses are essential tools. They help you track income, expenses, and cash flow with ease. Organized financial records are the foundation of a successful business and are crucial when analyzing and interpreting data.

These spreadsheets simplify financial management by providing clear insights into your business’s performance. It enables you to make informed decisions and plan confidently, turning raw numbers into visual storytelling that resonates with stakeholders.

Spreadsheets are cost-effective and flexible. You can customize them to meet your business’s unique needs – ideal for small businesses with limited resources. However, removing duplicates in Google Sheets ensures your data remains accurate and reliable.

Bookkeeping spreadsheets also support tax preparation and compliance. Utilizing features like removing duplicates in Google Sheets lets you keep your data clean and organized in one place. This simplifies the process of meeting regulatory requirements. It ensures your business stays on the right track, with clean and accurate data ready for visual storytelling.

In today’s competitive landscape, staying organized is crucial. Using bookkeeping spreadsheets for small businesses with ChartExpo can help you manage your finances effectively. Whether starting your journey or scaling up, these reliable tools empower you to grow and succeed.

How much did you enjoy this article?

GSAd2
Start Free Trial!
146822

Related articles

next previous
Google Sheets10 min read

Google Workspace for Education for Better Insights

Google Workspace for Education boosts collaboration and remote learning. Explore its features, benefits, and how ChartExpo enhances data analysis.

Google Sheets9 min read

Google Workspace Marketplace for Boosting Insights

Google Workspace Marketplace provides apps to enhance Gmail, Drive, and Docs. Learn about this tool and how to improve data visualization and analysis.

Google Sheets12 min read

Google Sheets CRM Templates for Insightful Decisions

Google Sheets CRM templates help businesses track contacts, sales, and customer data. Learn their benefits, setup steps, and expert tips to boost efficiency.

Google Sheets10 min read

Histogram Chart in Google Sheets: A Quick Walkthrough

A Google Sheets Histogram makes data visualization simple by revealing patterns. Learn how to create, customize, and optimize histograms for better insight.

Google Sheets10 min read

Google Sheets Amortization Schedule with Clear Visuals

A Google Sheets Amortization Schedule tracks loan payments, interest, and balances. Learn how to create your schedule for better loan management.

ChartExpo logo

Turn Data into Visual
Stories

CHARTEXPO

  • Home
  • Gallery
  • Videos
  • Services
  • Pricing
  • Contact us
  • FAQs
  • Privacy policy
  • Terms of Service
  • Sitemap

TOOLS

  • ChartExpo for Google Sheets
  • ChartExpo for Microsoft Excel
  • Power BI Custom Visuals by ChartExpo
  • Word Cloud

CATEGORIES

  • Bar Charts
  • Circle Graphs
  • Column Charts
  • Combo Charts
  • Comparison Charts
  • Line Graphs
  • PPC Charts
  • Sentiment Analysis Charts
  • Survey Charts

TOP CHARTS

  • Sankey Diagram
  • Likert Scale Chart
  • Comparison Bar Chart
  • Pareto Chart
  • Funnel Chart
  • Gauge Chart
  • Radar Chart
  • Radial Bar Chart
  • Sunburst Chart
  • see more
  • Scatter Plot Chart
  • CSAT Survey Bar Chart
  • CSAT Survey Chart
  • Dot Plot Chart
  • Double Bar Graph
  • Matrix Chart
  • Multi Axis Line Chart
  • Overlapping Bar Chart
  • Control Chart
  • Slope Chart
  • Clustered Bar Chart
  • Clustered Column Chart
  • Box and Whisker Plot
  • Tornado Chart
  • Waterfall Chart
  • Word Cloud
  • see less

RESOURCES

  • Blog
  • Resources
  • YouTube
SIGN UP FOR UPDATES

We wouldn't dream of spamming you or selling your info.

© 2025 ChartExpo, all rights reserved.