Categories
Conditional formatting in Power BI is a feature that allows users to highlight and draw attention to important data trends in their visualizations. By applying color-coded formatting to specific criteria, users (and other stakeholders) can quickly and easily identify patterns and outliers in their data sets.


In this guide, you’ll discover the benefits of the Power BI conditional formatting function and how to apply a conditional format in a Power BI matrix/table.
First…
Definition: Conditional formatting in Power BI is a feature that automatically changes the appearance of data—such as background color, font color, icons, or data bars—based on specific rules or conditions. It helps users highlight important values, identify trends, and make reports easier to read and interpret by visually emphasizing key insights.
Power BI conditional formatting makes your reports clearer and more insightful by highlighting key data automatically.
It helps you:
Power BI provides several types of conditional formatting top 5 are as follows:
This option changes the background color of cells based on specific values or ranges. It’s useful for showing intensity, such as higher values in darker shades and lower ones in lighter tones.
Font color formatting changes the text color according to data values. It’s a simple way to emphasize differences without altering the background—perfect for quick comparisons.
Data bars display horizontal bars within cells to visually compare numbers. Longer bars represent higher values, making it easy to spot performance levels at a glance.
Icon sets use symbols like arrows, check marks, or warning signs to represent performance or status trends. They help users quickly identify positive or negative results.
This feature turns cell values into clickable links that direct users to external reports, dashboards, or related resources, adding interactivity to your visuals.
Here are easy steps to help you apply conditional formatting in Power BI for a matrix (or table):
Step-by-Step Guide to adding conditional formatting in Power BI to evaluate data, a Color by Rules:
Select “Rules” in the Format by field of the Background color (or Font color dialogue box to format the cell background (or font color) according to the rules. In the “Based on field” section, select the field on which the formatting is based. The “Summarization” displays the field’s aggregate type.
Enter one or more value ranges and colors for each under Rules. There’s the “If” value condition, a value condition, and a color for each value range. Each value range’s cell backgrounds or fonts are colored with the specified color. Look out for the three rules in the example below:
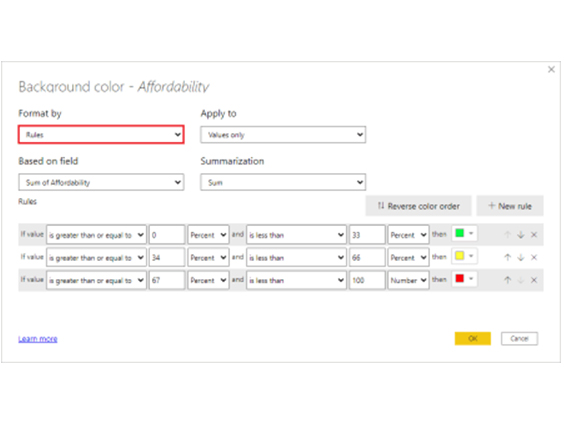
If you choose Percent from the options, the rule boundaries will be specified as a percentage of the whole range of values from lowest to maximum. If the lowest data point was 100 and the highest was 400, the preceding rules would color anything under 200 green, anything between 200 and 300 yellow, and anything over 300 red.
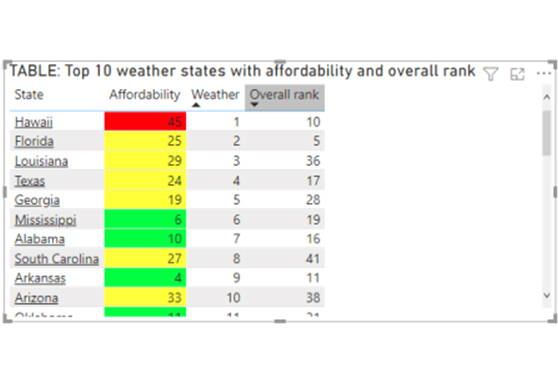
The illustration table below has rules-based background color formatting dependent on the Percent column in the Affordability column:
Steps for DAX conditional formatting in Power BI:
This formula returns green for values above 50,000 and red for lower ones.
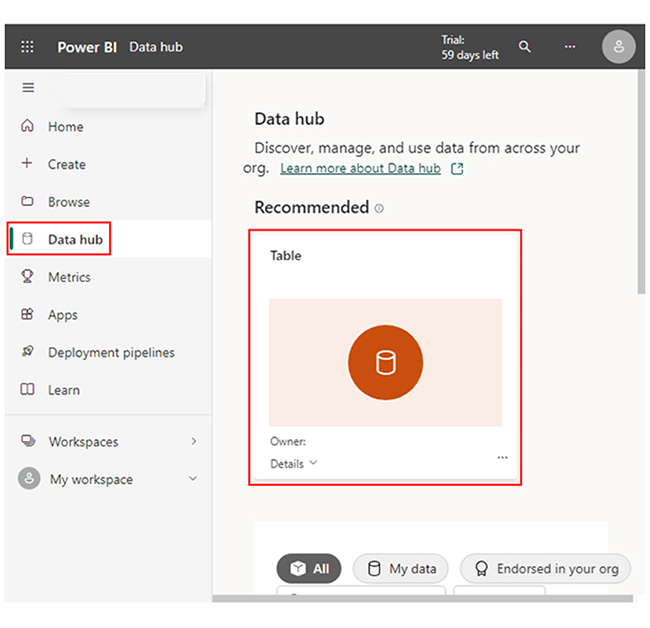
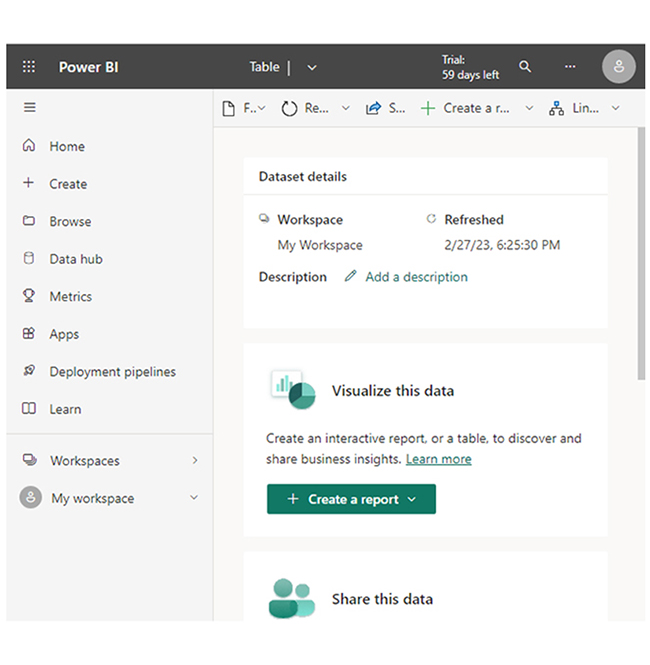
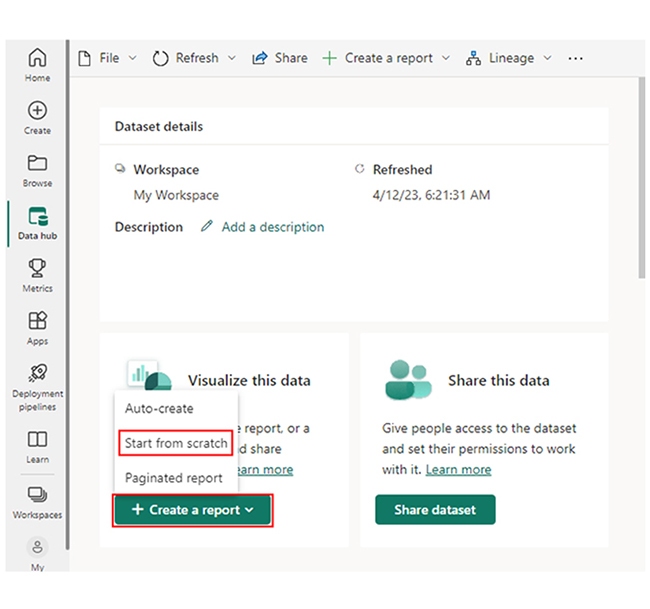
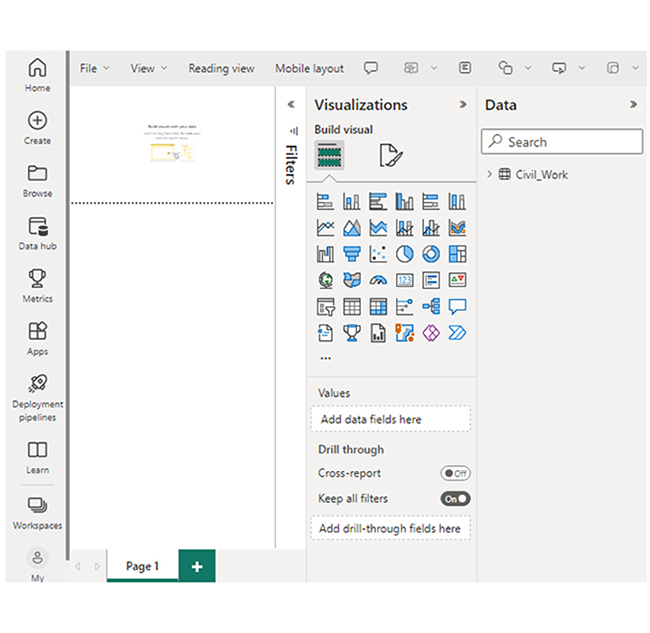
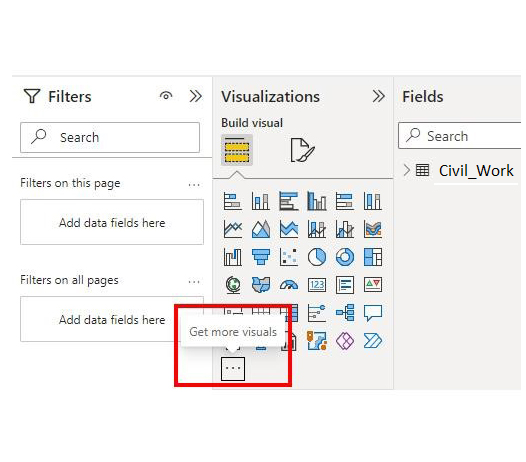
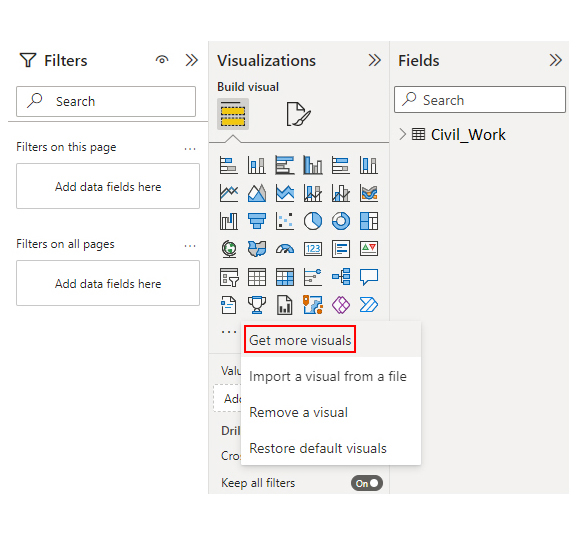
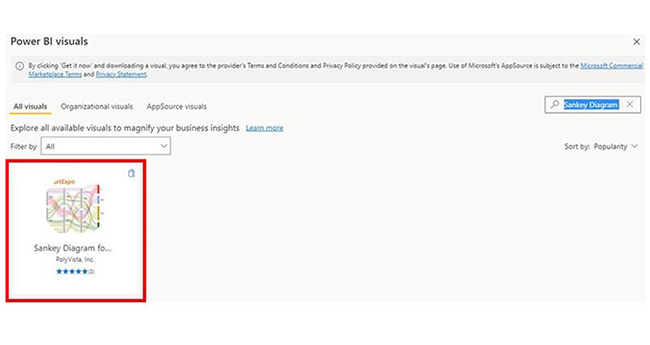
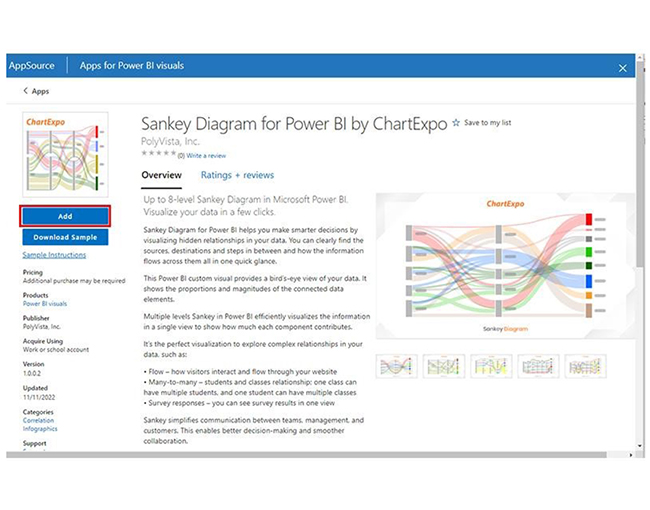
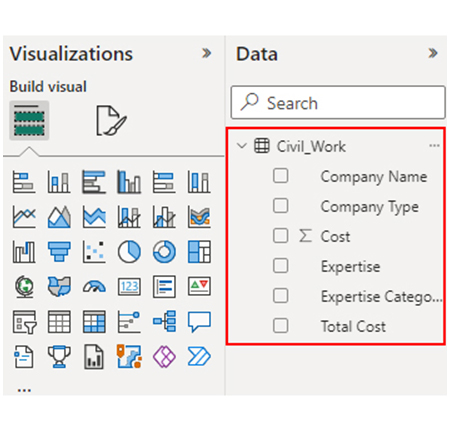
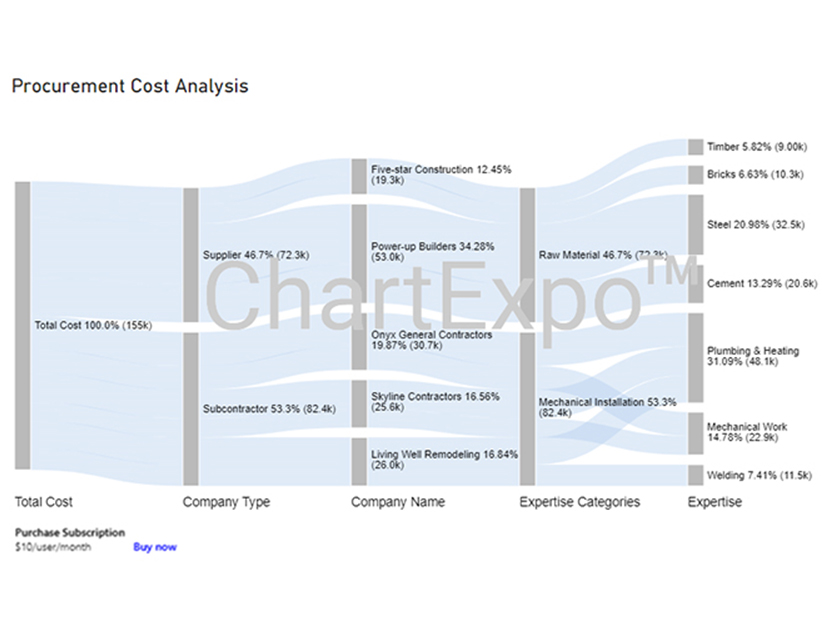
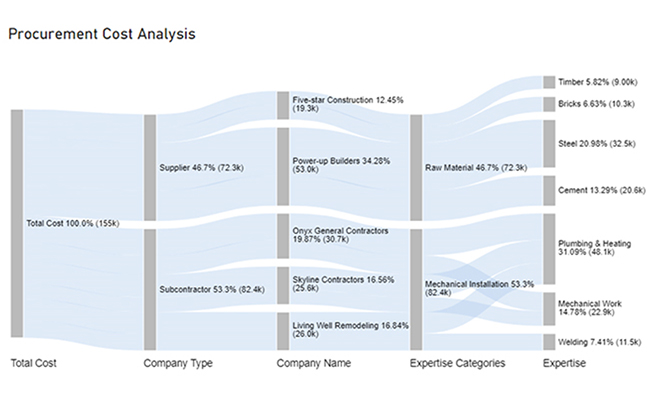
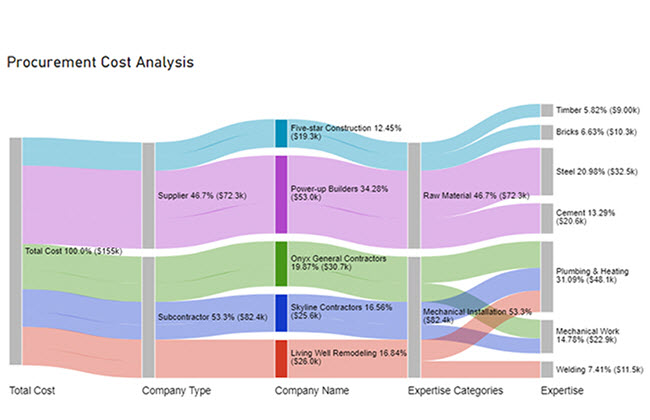
Here, we will create the Sankey Diagram in Power BI step by step.
Stage 1: Logging in to Power BI


| Total Cost | Company Type | Company Name | Expertise Categories | Expertise | Cost |
| Total Cost | Subcontractor | Skyline Contractors | Mechanical Installation | Plumbing & Heating | 15456 |
| Total Cost | Subcontractor | Skyline Contractors | Mechanical Installation | Mechanical Work | 10159 |
| Total Cost | Subcontractor | Onyx General Contractors | Mechanical Installation | Plumbing & Heating | 18045 |
| Total Cost | Subcontractor | Onyx General Contractors | Mechanical Installation | Mechanical Work | 12695 |
| Total Cost | Subcontractor | Living Well Remodeling | Mechanical Installation | Plumbing & Heating | 14589 |
| Total Cost | Subcontractor | Living Well Remodeling | Mechanical Installation | Welding | 11456 |
| Total Cost | Supplier | Power-up Builders | Raw Material | Cement | 20561 |
| Total Cost | Supplier | Power-up Builders | Raw Material | Steel | 32456 |
| Total Cost | Supplier | Five-star Construction | Raw Material | Bricks | 10253 |
| Total Cost | Supplier | Five-star Construction | Raw Material | Timber | 9000 |
Insights
Fix: Stick to 2–3 main colors and use them consistently (for example, green for growth, red for decline).
Fix: Adjust your rules based on what each dataset represents and its value range.
Fix: Combine color with icons, data bars, or labels for better accessibility.
Fix: Use DAX measures or field values to make your formatting update automatically.
Fix: Keep your formatting simple and focus on highlighting what truly matters.
To add conditional formatting in Power BI to a measure, select the measure, go to the “Format” pane, navigate to “Conditional formatting,” and configure rules for visual representation based on values.
In DAX (Data Analysis Expressions), use the FORMAT function to add conditional formatting in Power BI. Within the function, define logical conditions to format measure outputs based on specified rules or criteria.
Conditional formatting in Power BI allows users to visually enhance data representation by applying formatting rules based on values. It is crucial for highlighting patterns, anomalies, and trends. It also makes data interpretation more intuitive and facilitates informed decision-making.
In Power BI, conditional formatting can be applied in color scales, data bars, icon sets, and rules-based formatting. Color scales can be used to assign different colors to data points based on their values. Data bars are horizontal bars that are added to a field to represent its value visually.
Icon sets allow you to display icons (like flags, arrows, or traffic lights) next to the data points. Finally, rules-based formatting helps in defining custom rules to format data based on certain criteria.
By following the steps outlined in this guide, you’ll be able to create compelling visualizations while incorporating conditional formatting into the entire data analysis process.
How much did you enjoy this article?


Power BI Copilot converts natural language into instant reports, dashboards, and data insights for teams at every level. Read on to learn more!

Recruitment dashboards turn hiring data into real-time KPIs. Track metrics, reduce time-to-hire, and remove bottlenecks. Learn more!
Learn how to use Power BI Report Builder to create paginated, print-ready reports. Discover when to use it, key features, and real reporting use cases.