• Home
  • Tools dropdown img
    • Spreadsheet Charts

      • ChartExpo for Google Sheets
      • ChartExpo for Microsoft Excel
    • Power BI Charts

      • Power BI Custom Visuals by ChartExpo
    • Word Cloud

  • Charts dropdown img
    • Chart Category

      • Bar Charts
      • Circle Graphs
      • Column Charts
      • Combo Charts
      • Comparison Charts
      • Line Graphs
      • PPC Charts
      • Sentiment Analysis Charts
      • Survey Charts
    • Chart Type

      • Box and Whisker Plot
      • Clustered Bar Chart
      • Clustered Column Chart
      • Comparison Bar Chart
      • Control Chart
      • CSAT Survey Bar Chart
      • CSAT Survey Chart
      • Dot Plot Chart
      • Double Bar Graph
      • Funnel Chart
      • Gauge Chart
      • Likert Scale Chart
      • Matrix Chart
      • Multi Axis Line Chart
      • Overlapping Bar Chart
      • Pareto Chart
      • Radar Chart
      • Radial Bar Chart
      • Sankey Diagram
      • Scatter Plot Chart
      • Slope Chart
      • Sunburst Chart
      • Tornado Chart
      • Waterfall Chart
      • Word Cloud
    • Google Sheets
      Microsoft Excel
  • Services
  • Pricing
  • Contact us
  • Blog
  • Support dropdown img
      • Gallery
      • Videos
      • Contact us
      • FAQs
      • Resources
    • Please feel free to contact us

      atsupport@chartexpo.com

Categories
All Data Visualizations Data Analytics Surveys
Add-ons/
  • Google Sheets
  • Microsoft Excel
  • Power BI
All Data Visualizations Data Analytics Surveys
Add-ons
  • Google Sheets
  • Microsoft Excel
  • Power BI

We use cookies

This website uses cookies to provide better user experience and user's session management.
By continuing visiting this website you consent the use of these cookies.

Ok

ChartExpo Survey


Home > Blog > Microsoft Excel

How to Analyze Customer Survey Questionnaire Data in Excel?

Imagine yourself as a business owner running a thriving pizza joint. Your customers are happy, your employees are content, and the business is booming.

But wait, what if your customers are not as happy as you think? What if they have concerns about the quality of your pizza or the service they receive?

This is where customer satisfaction survey questions come in handy.

customer survey questionnaire

Asking your customers for feedback allows you to identify areas for improvement. Then take corrective actions before it’s too late.

However, collecting feedback is just the first step. The real challenge lies in analyzing the data to reveal valuable insights to improve your business. This is where Excel proves invaluable. With its powerful data analysis tools, Excel can make your life as a business owner much easier.

You can transform your raw survey data into valuable insights with a few clicks and keystrokes.

How?

Table of Content:

  1. What are Customer Satisfaction Survey Questions?
  2. 25 Best Customer Satisfaction Survey Questions to Ask
  3. How to Create a Customer Satisfaction Survey Questions?
  4. Evaluate Customer Satisfaction Survey Questions Results
  5. Wrap Up

What are Customer Satisfaction Survey Questions?

Customer satisfaction survey questions are like a treasure map that leads businesses to valuable customer insights and opinions. It involves crafting insightful questions designed to extract valuable customer feedback. Here are various survey ideas you can incorporate into your questionnaire

This questionnaire is crucial for businesses seeking to stay attuned to customer sentiment. It facilitates informed decision-making based on data to fuel growth and success.

25 Best Customer Satisfaction Survey Questions to Ask

We have listed some best customer satisfaction survey questions examples which you can include in your next questionnaire.

  1. How did you hear about our product/service?
  2. What motivated you to choose our product/service over competitors?
  3. How satisfied are you with your overall experience with our product/service?
  4. Would you recommend our product/service to others?
  5. Have you encountered any issues or challenges while using our product/service?
  6. How would you rate the customer service/support you received?
  7. What are the most valuable features or aspects of our product/service?
  8. How frequently do you use our product/service?
  9. How does our product/service compare to similar offerings in the market?
  10. How likely are you to continue using our product/service in the future?
  11. How would you rate the overall quality of the customer service you received?
  12. Did the customer service representative respond to your inquiries on time?
  13. Were you greeted and treated with courtesy and professionalism?
  14. How satisfied are you with the solution provided by our customer service?
  15. Did the customer service representative actively listen to your concerns?
  16. How knowledgeable and competent was the customer service representative?
  17. Were your expectations met or exceeded during your interaction with customer service?
  18. How would you rate the ease of reaching customer service (e.g., phone, email, live chat)?
  19. Did the customer service representative empathize with your situation and make you feel valued?
  20. How likely will you recommend our company based on your customer service experience?
  21. Did the customer service representative satisfactorily resolve your issue?
  22. Were you provided with adequate options and solutions to choose from?
  23. Did the customer service representative follow up to ensure your issue was resolved to your satisfaction?
  24. How would you rate the availability and accessibility of customer service channels?
  25. Did the customer service representative take ownership of your issue and show a genuine desire to help?

How to Create a Customer Satisfaction Survey Questions?

Let’s say you run an online store. You want to conduct a customer satisfaction survey consisting of the following questions.

  • How satisfied are you with the variety of products offered by the store?
  • How satisfied are you with the quality of our product?
  • How satisfied are you with our delivery service?
  • How satisfied are you with the product descriptions?

You want respondents to provide an answer to each question using the response scale below.

  1. Extremely Dissatisfied
  2. Dissatisfied
  3. Neutral
  4. Satisfied
  5. Extremely Satisfied

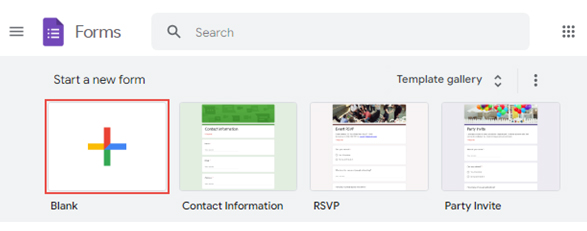
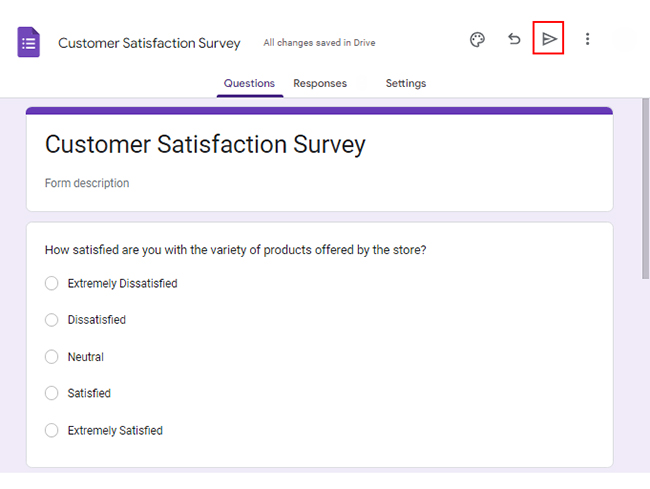
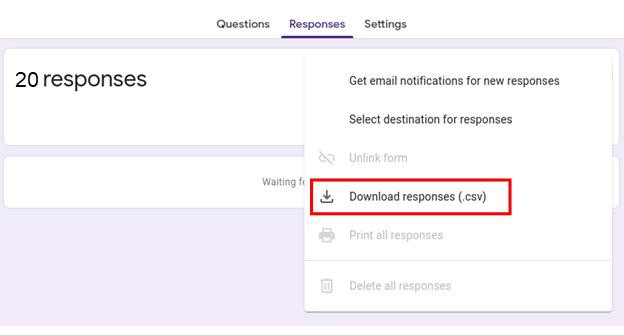
To create your customer satisfaction survey questionnaire in Google Forms:

  • Open Google Forms and sign in with your Google account.
  • Click the “Blank” button to create a new form.
survey in microsoft forms 1 ce365
  • Give your form a title, description, or anything you want to add about your brand.
  • Select the type of question you want to use, such as multiple-choice, checkbox, or short answer. In this case, select multiple choice.
  • Type your questions in the “Untitled Question” section. Write “Option 1” and choose “Add option” for more options.
  • Customize the look and feel of your survey.
  • Preview your survey and make any necessary edits.
  • Click the share button to distribute it to your target audience.
survey in microsoft forms 2 ce365
  • Once you collect enough responses, click the “Link to Sheets” button.
survey in microsoft forms 3 ce365
  • Download your responses as a .csv file from the dropdown menu.
survey in microsoft forms 4 ce365

Evaluate Customer Satisfaction Survey Questions Results

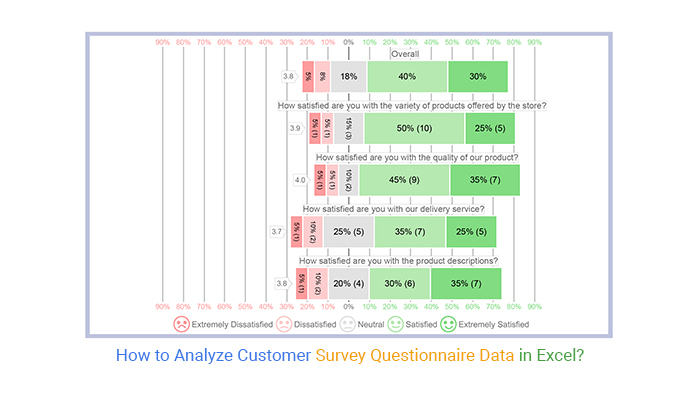
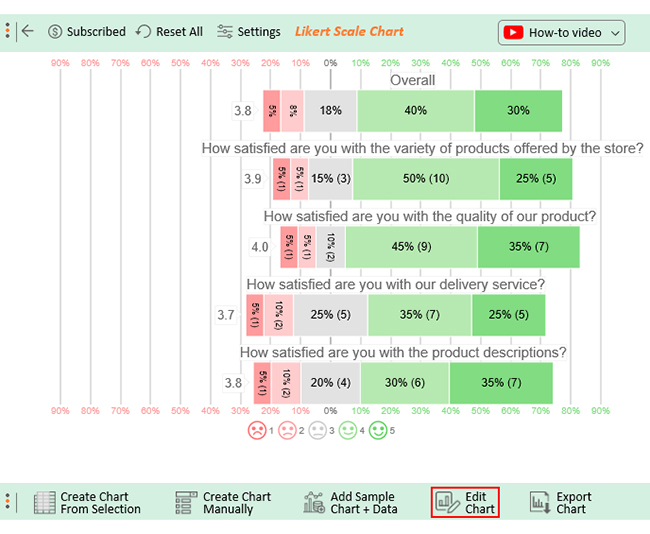
As the popular saying goes, “A picture is worth a thousand words,” which also holds in data analysis. Visualizations are an essential part of understanding and analyzing data. They can help identify patterns, trends, and anomalies that might go unnoticed.

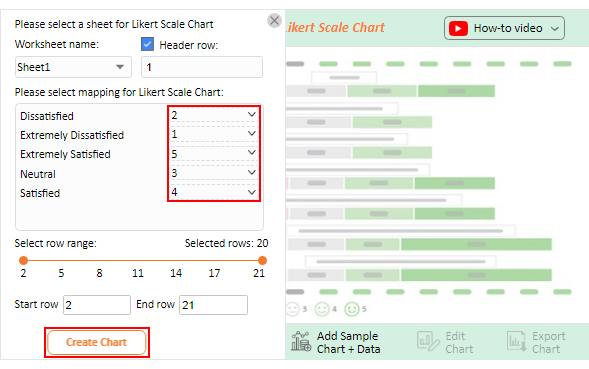
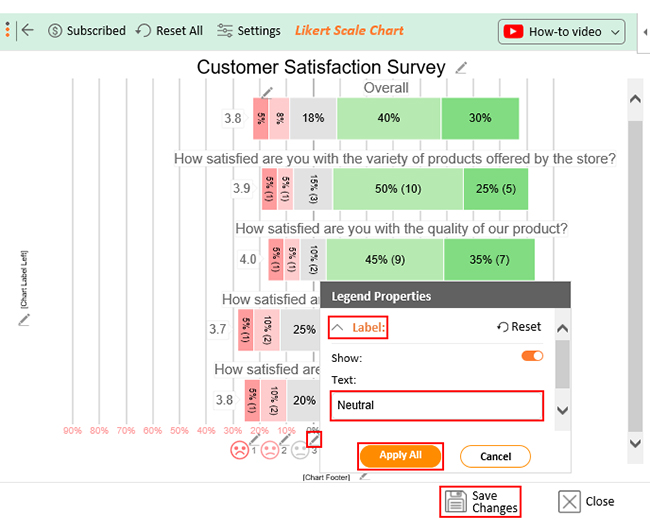
While Excel is an excellent tool for data organization, it is not ideal for creating visualizations. That’s where ChartExpo comes in. ChartExpo helps you create insightful visualizations to measure customer satisfaction survey question results in Excel and beyond.

Benefits of Using ChartExpo

  • ChartExpo lets you pick the perfect visualization for your data, making analysis and presentation a breeze.
  • With ChartExpo, you can create insightful, appealing visuals without writing a single line of code.
  • ChartExpo’s customization options allow you to create one-of-a-kind visuals that reflect your style and preferences.
  • ChartExpo is an affordable solution for all your data visualization needs. It has a free 7-day trial and a $10 monthly plan.

How to Install ChartExpo in Excel?

  1. Open your Excel application.
  2. Open the worksheet and click the “Insert” menu.
  3. You’ll see the “My Apps” option.
  4. In the office Add-ins window, click “Store” and search for ChartExpo on my Apps Store.
  5. Click the “Add” button to install ChartExpo in your Excel.

ChartExpo charts are available both in Google Sheets and Microsoft Excel. Please use the following CTA’s to install the tool of your choice and create beautiful visualizations in a few clicks in your favorite tool.
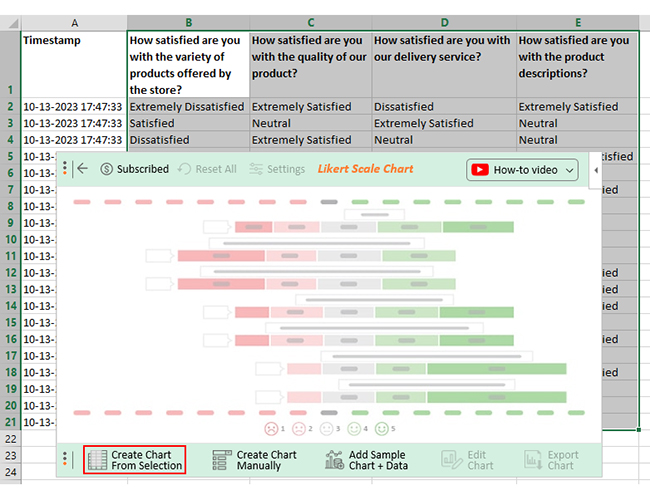
Assume the customer satisfaction survey questions yield the results table below.

Timestamp How satisfied are you with the variety of products offered by the store? How satisfied are you with the quality of our product? How satisfied are you with our delivery service? How satisfied are you with the product descriptions?
10-13-2023 17:47:33 Extremely Dissatisfied Extremely Satisfied Dissatisfied Extremely Satisfied
10-13-2023 17:47:33 Satisfied Neutral Extremely Satisfied Neutral
10-13-2023 17:47:33 Dissatisfied Extremely Satisfied Neutral Neutral
10-13-2023 17:47:33 Extremely Satisfied Extremely Satisfied Extremely Satisfied Extremely Dissatisfied
10-13-2023 17:47:33 Neutral Extremely Dissatisfied Neutral Neutral
10-13-2023 17:47:33 Extremely Satisfied Extremely Satisfied Satisfied Extremely Satisfied
10-13-2023 17:47:33 Extremely Satisfied Satisfied Satisfied Satisfied
10-13-2023 17:47:33 Satisfied Satisfied Neutral Satisfied
10-13-2023 17:47:33 Satisfied Satisfied Satisfied Satisfied
10-13-2023 17:47:33 Neutral Neutral Extremely Satisfied Dissatisfied
10-13-2023 17:47:33 Satisfied Extremely Satisfied Extremely Satisfied Extremely Satisfied
10-13-2023 17:47:34 Satisfied Satisfied Satisfied Extremely Satisfied
10-13-2023 17:47:35 Satisfied Satisfied Satisfied Extremely Satisfied
10-13-2023 17:47:36 Extremely Satisfied Satisfied Neutral Dissatisfied
10-13-2023 17:47:37 Satisfied Extremely Satisfied Extremely Dissatisfied Extremely Satisfied
10-13-2023 17:47:38 Neutral Satisfied Satisfied Satisfied
10-13-2023 17:47:39 Satisfied Extremely Satisfied Satisfied Extremely Satisfied
10-13-2023 17:47:40 Extremely Satisfied Satisfied Extremely Satisfied Satisfied
10-13-2023 17:47:41 Satisfied Satisfied Neutral Satisfied
10-13-2023 17:47:42 Satisfied Dissatisfied Dissatisfied Neutral

This table contains example data. Expect many responses and questions in real life.

  • To get started with ChartExpo, install ChartExpo in Excel.
  • Now Click on My Apps from the INSERT menu.
insert chartexpo in excel
  • Choose ChartExpo from My Apps, then click Insert.
open chartexpo in excel
  • Once it loads, choose the “Likert Scale Chart” from the charts list.
search likert scale chart in excel
  • Click the “Create Chart From Selection” button after selecting the data from the sheet, as shown.
Create Chart From Selection ce365
  • When you click the “Create Chart From Selection” button, you have to map responses with numbers manually. The Likert scale has this arrangement:
    • Extremely Dissatisfied = 1
    • Dissatisfied = 2
    • Neutral = 3
    • Satisfied = 4
    • Extremely Satisfied = 5
  • Once all is set, click the “Create Chart” button.
Map Likert Responses to Numbers ce365
  • ChartExpo will generate the visualization below for you.
customer survey questionnaire design template
  • If you want to have the chart’s title, click Edit Chart, as shown in the above image.
  • Click the pencil icon next to the Chart Header to change the title.
  • It will open the properties dialog. Under the Text section, you can add a heading in Line 1 and enable Show.
  • Give the appropriate title of your chart and click the Apply button.
apply title on chart ce365
  • Let’s say you want to add text responses instead of numbers against every emoji.
  • Click the pencil icon next to the respective emoji. Expand the “Label” properties and write the required text. Then click the “Apply All” button.
  • Click the “Save Changes” button to persist the changes.
apply label on chart ce365
  • Your final chart will appear below.
final customer survey questionnaire

Insights

  • Most customers (75%) are satisfied with the store’s variety of products. 10% are dissatisfied, and 15% remain neutral.
  • 80% are satisfied with the product quality, but 10% are dissatisfied.
  • Regarding delivery service, 60% of customers are satisfied, while 15% are dissatisfied.
  • 65% are satisfied with the product descriptions, but 15% are dissatisfied.
  • Overall;
    • 70% of respondents are satisfied with the product and service, with 30% having an amazing experience.
    • 13% are dissatisfied, with 5% having an extremely bad experience.
    • 18% remain neutral.

FAQs

What is a Customer Satisfaction Survey Questions?

A customer satisfaction survey aims to collect customer feedback and opinions regarding their experience with a product or service. For instance, a customer survey may inquire about satisfaction levels, recommendations, and suggestions for improving the offering.

How do you create a Customer Satisfaction Survey Questions?

To create a customer satisfaction survey questions, follow these steps:

  • Define the objective of the questionnaire.
  • Determine the format.
  • Design clear and concise questions.
  • Use a mix of question types.
  • Test the questionnaire for clarity and flow.
  • Administer the questionnaire through suitable channels.

What is the Purpose of a Customer Satisfaction Survey Questions?

The purpose of customer satisfaction survey questions is to gather valuable feedback and insights from customers. This helps to improve products or services and enhance the overall customer experience.

Wrap Up

Analyzing customer satisfaction service questionnaire results is essential to gain valuable insights and improve the customer experience.

A customer satisfaction survey questionnaire is a powerful tool for gathering valuable customer insights. However, collecting the responses is just the first step. The real challenge lies in data analysis to uncover meaningful trends and insights to inform decision-making.

Excel, with its robust data analysis tools, comes to the rescue in this process. You can efficiently organize and analyze the customer satisfaction survey questions data by leveraging Excel’s capabilities. You can perform various statistical analyses, create charts and graphs, and identify patterns or correlations within the data.

Analyzing customer satisfaction survey questionnaire data in Excel enables you to understand customer sentiments, preferences, and pain points. It helps identify improvement areas, make data-driven decisions, and drive growth and success.

To effectively analyze customer satisfaction survey question data in Excel, use ChartExpo. With ChartExpo, you can make your data come alive with engaging and insightful visualizations.

The best part?

It’s affordable and doesn’t require any coding expertise.

How much did you enjoy this article?

ExcelAd2
Start Free Trial!
127819

Related articles

next previous
Microsoft Excel12 min read

Key Performance Indicators in Healthcare for Better Insights

Key Performance Indicators in healthcare track patient care and efficiency. Learn about these KPIs, top examples, and how to use them to improve outcomes.

Microsoft Excel10 min read

BMI Calculation Formula in Excel for Better Fitness Insights

The BMI calculation formula in Excel helps track and analyze body mass index. Explore step-by-step instructions and tips to simplify BMI tracking in Excel.

Microsoft Excel29 min read

How to Create a Tornado Chart in Excel? A Complete Guide

Click to learn how to plot a Tornado Chart in Excel using easy-to-follow steps. Also, we’ll address the following question: what is a Tornado Diagram?

Microsoft Excel14 min read

How to Create a Scatter Plot in Excel with 3 Variables?

Click to discover how to create a Scatter Plot in Excel with 3 variables. We’ll also address the following question: why do we use Scatter Plot Graph?

Microsoft Excel12 min read

Construction Budget Spreadsheet for Better Planning

A construction budget spreadsheet helps track expenses and control costs. This blog explores benefits, top templates, and tips for better budgeting in Excel.

ChartExpo logo

Turn Data into Visual
Stories

CHARTEXPO

  • Home
  • Gallery
  • Videos
  • Services
  • Pricing
  • Contact us
  • FAQs
  • Privacy policy
  • Terms of Service
  • Sitemap

TOOLS

  • ChartExpo for Google Sheets
  • ChartExpo for Microsoft Excel
  • Power BI Custom Visuals by ChartExpo
  • Word Cloud

CATEGORIES

  • Bar Charts
  • Circle Graphs
  • Column Charts
  • Combo Charts
  • Comparison Charts
  • Line Graphs
  • PPC Charts
  • Sentiment Analysis Charts
  • Survey Charts

TOP CHARTS

  • Sankey Diagram
  • Likert Scale Chart
  • Comparison Bar Chart
  • Pareto Chart
  • Funnel Chart
  • Gauge Chart
  • Radar Chart
  • Radial Bar Chart
  • Sunburst Chart
  • see more
  • Scatter Plot Chart
  • CSAT Survey Bar Chart
  • CSAT Survey Chart
  • Dot Plot Chart
  • Double Bar Graph
  • Matrix Chart
  • Multi Axis Line Chart
  • Overlapping Bar Chart
  • Control Chart
  • Slope Chart
  • Clustered Bar Chart
  • Clustered Column Chart
  • Box and Whisker Plot
  • Tornado Chart
  • Waterfall Chart
  • Word Cloud
  • see less

RESOURCES

  • Blog
  • Resources
  • YouTube
SIGN UP FOR UPDATES

We wouldn't dream of spamming you or selling your info.

© 2025 ChartExpo, all rights reserved.