Categories
The Internet is full of useful tools to make information more accessible. After all, they say information is power. This is true, but only if you have the means to make sense of it accurately.


The world creates data at hyper-speed in the Digital Age.
As a result, data tools are not a luxury. They are a necessity to survive and thrive in the Digital Age.
Google Forms is one tool for finding clarity in data and information. It helps users create quizzes, questionnaires and other helpful feedback forms. There are many Google Forms survey examples worth learning from.
Google Forms offers a means to gather valuable intel. Whether you’re a business, school teacher, health organization, employer or another entity, there are practical Google Forms survey examples.
Examples are the best way to learn about any new tool or strategy. So, this discussion will explore several Google Forms survey examples.
Each example will provide insight into how to use this potent survey data tool. You’ll be able to adapt the different Google Forms survey examples to your own organization.
We’ll also cover how to use Google Forms, including getting responses and analyzing the resulting data.
Let’s begin by looking at Google Forms survey examples and see what insights we can learn.
Many people refer to Google Forms as the Google survey maker. After all, this is why most people utilize the tool.
However, it is an online form creator, meaning it is for far more than just surveys. You can make order forms, party invitations, wedding RSVPs, and more. You can even make quizzes in Google Forms!
Many of these form options are available as premade templates. For instance, here is part of a survey form example designed for customer feedback.

It begins by asking what type of feedback the participant wants to submit. Then, qualifying questions ask the individual to elaborate on the comment, concern, etc.
As mentioned, there are many different applications of Google Forms, from simple questionnaires to more complex longitudinal surveys. This leads to many unique Google Forms survey examples. Let’s explore three popular uses of survey form examples.
There are several unique types of Google Forms examples for business use. For a survey form example, Google Forms is excellent for building customer satisfaction surveys.
You can choose from rating scales, multiple-choice and grid-choice questions, and more. You can also ask an Open-Ended Questionnaire requiring a long-form answer from the participant.
Here is an example of a customer survey for a restaurant:

Google Forms includes a customer feedback form template. This can help you get straight to acquiring audience insights. Another helpful survey-related template is for event feedback.
Here’s a quick look at this Google Forms survey example:

Using a survey form for business can be more than just for customer feedback. You can also create employee satisfaction surveys or training programs using Google Forms.
Employee feedback is vital to maintaining an effective, happy workforce. Happy employees work better and keep your turnover costs low.
You can also use these feedback form examples for business suggestions and survey data collection. Your employees know the company as intimately as you do. Plus, they may be customer-facing and have insights from their interactions.
Aside from creating a survey form for businesses, Google Forms is also a great tool for instructors. Not only can you make registration forms and signup sheets, but you can also create quizzes in Google Forms.
This requires you to click on the “Settings” tab. You’ll see an option to make your form a quiz.

Turning this option on will open a collection of other settings to check.

After reviewing these options, you can create a quiz for students in Google Forms. It’s a convenient method for developing online assessments.
You can even use Google Forms as an instructional tool. If you’re teaching about surveys and data, you may want to create a survey form sample for student work. They can see how to ask survey questions, simple survey charts from the responses, and more.
Remember, Google Forms is a free tool capable of making as many forms as you want. There is no cost to use it in the classroom. You can have students make their quizzes in Google Forms or survey form examples.
Beyond a survey form sample for student use or businesses, healthcare organizations also benefit substantially from Google Forms.
These organizations benefit from every type of form, even beyond survey forms. For example, a clinic can use Google Forms to make their patient appointment scheduling forms.
Healthcare organizations need a lot of info from their patients. Thus, Google Forms’ surveys are helpful tools. You can use Google Forms to collect patient information, like asking the reason for their doctor’s visit.
Making a survey form for business typically involves acquiring feedback from customers. Hospitals and other healthcare entities have to do the same with their patients.
You want to know how they felt about their recent visit. Did they get the help they needed? What was the experience like? How was the staff?
This type of Google Forms survey example can help healthcare providers improve patient experiences.
Here are some survey form example questions.

Here are some of the benefits you get to enjoy from using the Google survey format.
Like many of Google’s tools, Forms is remarkably user-friendly. You can create professional, engaging questionnaires in minutes.
This section will outline how to create a Google survey format. Then, we’ll cover how to export the results for further analysis.
All you need to start is a Google account. If you already use Gmail or another Google tool, you already have this account.
You can access Google Forms from the Apps icon at the top of any Google page.

The first time you open Google Forms, the tool will ask if you’re making a survey form for business or personal use. It does not matter what option you choose. It only influences which templates the tool suggests for your first form.
You don’t have to use a template at all. Instead, you can choose a blank form and make your survey form example from scratch.

Google Forms has multiple features to assist in creating and editing your feedback form examples. You can add new questions with just one click. When making a new survey item, you can choose from several question types:
If you want to rearrange the question order, you can click and drag to move items up or down. You can also insert images and videos to add to your Google Forms survey examples.
There are so many features to explore and utilize!
When you’re done building your Google Forms for business or other uses, you can send them via email or direct link. All you have to do is click the purple “Send” button at the top of the page.

The “Send” button opens the following menu. You can choose how you’d like to share your Google Forms survey example here.

Shortly after sending your questionnaire to respondents, your responses will start appearing. Google Forms responses appear as soon as someone completes your survey questionnaire.
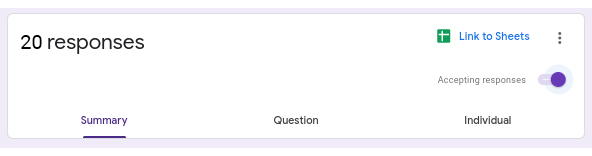
You can move your responses from Google Forms to Google Sheets in two clicks. The first click is the “Link to Sheets” option.

Next, you’ll choose between adding the data to an existing spreadsheet or a new one.

No matter which option you choose, Google Forms will open a new tab. This tab will have your Google Forms responses in a spreadsheet format.
With your data, including metrics like net promoter score, you can analyze your results more deeply. Spreadsheet tools, such as Sheets or Microsoft Excel, offer convenient ways to organize and collect data.
However, when the time comes to analyze said data and draw accurate conclusions, spreadsheets could be better.
As your datasets grow, spreadsheets become an overwhelming wall of numbers. There’s too much on the page. It’s an overload of information that obscures any significant discoveries.
Data overload also has a paralyzing effect. It becomes tiring to look at your data and analyze it. You may become so fatigued you leave your spreadsheet before discovering any actionable intelligence.
So, how do you utilize the benefits of spreadsheets without succumbing to their analysis-related drawbacks? Charts are the answer.
Charts convert that overwhelming wall of numbers into an intuitive, easy-to-understand visual. This has a profound impact on the speed and effectiveness of your analysis.
By visually depicting your data, you can physically see trends, patterns, and other notable insights. They practically jump off the page!
Tools like Google Sheets and Excel include some standard charts. Yet, these options aren’t attuned to survey data. Some of the best visualizations for your Google Forms survey examples are the Likert Scale Chart or CSAT Score Chart.
The Likert Scale Chart is particularly useful for Google Forms survey examples that include rating scales. It depicts the results in one of the most intuitive ways possible, leading to faster and more actionable insights.
To access Likert Scale Charts and other survey visualizations, you need an add-on like ChartExpo. This tool gives you an extensive library of different chart types. It also enables you to create powerful visualizations in just three clicks.
How to Install ChartExpo in Google Sheets?
ChartExpo charts and graphs are available both in Google Sheets and Microsoft Excel. Please use the following CTA’s to install the tool of your choice and create beautiful visualizations in a few clicks in your favorite tool.
The best way to exhibit the effectiveness of Likert Scale Charts is through examples.
Let’s look at creating a Likert Scale Chart in Google Sheets on the responses collected from your Google Forms surveys.
Suppose you get the following data from Google Forms:

You have to change this data in the following format:
| Questions | Scale | Responses |
| How satisfied were you with the work-life balance in this company? | 1 | 1 |
| How satisfied were you with the work-life balance in this company? | 2 | 5 |
| How satisfied were you with the work-life balance in this company? | 3 | 3 |
| How satisfied were you with the work-life balance in this company? | 4 | 3 |
| How satisfied were you with the work-life balance in this company? | 5 | 8 |
| How satisfied were you with the opportunities for career growth and development? | 1 | 1 |
| How satisfied were you with the opportunities for career growth and development? | 2 | 2 |
| How satisfied were you with the opportunities for career growth and development? | 3 | 4 |
| How satisfied were you with the opportunities for career growth and development? | 4 | 7 |
| How satisfied were you with the opportunities for career growth and development? | 5 | 6 |
| How satisfied were you with the work culture? | 1 | 0 |
| How satisfied were you with the work culture? | 2 | 1 |
| How satisfied were you with the work culture? | 3 | 5 |
| How satisfied were you with the work culture? | 4 | 8 |
| How satisfied were you with the work culture? | 5 | 6 |
| How satisfied were you with the recognition and feedback? | 1 | 1 |
| How satisfied were you with the recognition and feedback? | 2 | 3 |
| How satisfied were you with the recognition and feedback? | 3 | 3 |
| How satisfied were you with the recognition and feedback? | 4 | 5 |
| How satisfied were you with the recognition and feedback? | 5 | 8 |
To get started with ChartExpo, install ChartExpo in Google Sheets.
Go to Extensions > Charts, Graphs & Visualizations by ChartExpo > Open.


Overall view, 64% of employees were satisfied with company. But 18% of employees were dissatisfied with company. 19% employees were neither satisfied nor dissatisfied with company.
Google Forms provides several example templates you can use. These offer preliminary ideas to get you started creating your survey forms for business or personal use. You can even use these templates with your email lists to acquire immediate feedback data.
The best survey form examples in Google Forms are the Customer Feedback, Event Feedback, and Order Form templates.
Google Forms offers various question formats to cater to different survey needs:
Exploring these different Google Forms survey examples showcases what a robust tool the online form maker is.
Anyone, from business owners to teachers and hospital managers, can find useful survey form examples. You can even leverage Google Forms to make other essential questionnaires and documents.
Making Google Forms survey examples is only the first step. You also need to analyze the results you receive from participants.
Google Forms shines in this respect once again. The tool automatically tabulates results and shows you breakdowns of every question. In two clicks, you can export the data for further analysis.
To make your survey analysis nearly effortless, we recommend ChartExpo. This charting library adds powerful survey visualizations.
These charts will transform your Google Forms responses into engaging and simple visuals. You’ll be acquiring actionable audience insights in just minutes. Plus, these survey charts make excellent visual assets in reports and presentations.
No matter what type of organization you run, receiving feedback is unmistakably valuable. You can’t improve without it!
Google Forms, ChartExpo, and Sheets help make survey responses easy to acquire, analyze, and act on. You’ll be building better strategies and experiences in no time!
How much did you enjoy this article?


Google Forms to Google Sheets keeps your data organized and current with every submission. Learn the steps, methods, and tips now!

Product survey questions reveal what customers truly think. Learn how to ask the right ones and act on the survey results. Read on!

Learn how the 5-Point Performance Rating Scale improves employee evaluations with clear, consistent, and fair performance reviews across teams.


