

Once your 5-point Likert scale data is ready in Excel, it may look like the table below.
Categories
Google Forms is a popular survey research tool that many businesses utilize. It enables you to make and send unlimited questionnaires to your target audiences.


As an online survey tool, the Google Forms responses you receive appear and are tabulated immediately. This is a significant advantage for several reasons:
While these are helpful features, they don’t provide the best analysis environment. You want to dig deep into the data and extract actionable insights. For this, you’ll want to export the results to a spreadsheet.
As you’ll see in this guide, it’s easy to learn how to share Google Forms responses with others through Excel, Google Sheets or another tool. You can collaborate on analyzing the results and deciding what to do next.
The end goal is to chart your Google Forms responses. Understanding how to get Google Forms responses into a visual format will help your analysis significantly.
This discussion will look at how to get Google Forms responses to Excel. You’ll also learn strategies for charting your survey results in Excel.
Definition: Google Forms responses are the answers or data submitted by users who fill out a Google Form. These responses are automatically collected and stored in the form’s dashboard, where they can be viewed in summary charts, downloaded, or linked directly to Google Sheets or Excel for detailed analysis and record-keeping.
Whenever someone completes your questionnaires, the number of Google Forms responses increments. So, at the start of your survey, you’ll have 0 responses.

For each person who completes the questionnaire, the number will increment. In other words, your Google Forms responses are the number of people to complete your survey.
Moreover, they are the specific answers to your questionnaires that participants submit. Depending on the types of survey questions you ask, your Google Forms responses may be open-ended or closed.
Here’s an example of a question that creates an open-ended Google Forms response:

Closed-ended question types give the audience a set of answers to choose from. Here’s an example:

You can add more options using a Google Forms multiple-choice grid question. Additional options pack more data into your possible feedback results.
Essentially, your Google Forms responses form the basis of your survey data collection.
Responses in Google Forms are valuable because they turn raw feedback into structured data you can analyze and act on. Instead of manually collecting and sorting answers, the tool organizes everything automatically in one place.
To learn how to get Google Forms responses, you first need to know how to make a questionnaire with this tool.
It’s a straightforward process. First, choose a template or start with a blank form. The best survey templates are the Customer/Student Feedback and Post Event Feedback options.

Whether you choose a blank or templated form, you can edit any component. This includes:
Afterward, you’ll send your questionnaire via email or a direct link. Once people answer the questions, you need to know how to see Google Forms responses in the tool. Simply hit the “Responses” tab at the top of the page.

Your Google Forms responses and data will appear under this tab.


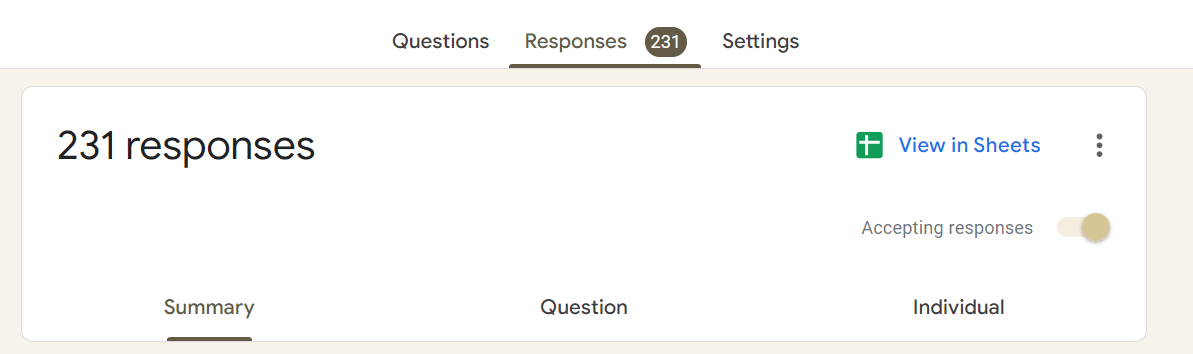
When you receive completed questionnaires, there are a few different types of Google Forms responses or ways to view the data.
The initial view is a summary. This page includes all of your questions.
You can look closer at the Google Forms responses for individual questions by clicking the appropriate “Question” tab.

This will give you a page summary for every question. You’ll see how many people selected each option. It also allows you to see which participants selected each choice.

Alternatively, you can view your Google Forms responses for each individual. This will show you the complete questionnaire answers for each person who completes it.

You can use the arrows at the top to change which respondent’s answers you’re viewing. Then, you can scroll down the page to see their complete answers.
This view is excellent when you mix open and closed questions. You can use the two types to qualify the individual’s answers.
Google Forms gives a detailed view of your responses and survey data, but for complete insights, you may want to use the Google Form response spreadsheet.
A Google Form response spreadsheet is an excellent way to organize results and prepare them for deeper analysis, especially with data visualization
You can export responses from Google Forms to Google Sheets in just two clicks. From the “Responses” tab, click the “Link to Sheets” option.

You can then add your Google Forms responses to an existing spreadsheet or create a new one.
Google Forms free tool, offers a basic overview of your response data. However, you may want to export the responses from Google Forms to Excel for deeper analysis.
For Excel users, the process is a little longer, but still very easy. Instead of clicking “Link to Sheets,” you’ll choose the three vertical dots next to it.

This creates a dropdown menu with the option to download your responses as a .csv file.

Choose the location on your device for the file download to go. Then, open up Excel, import the .csv file, and presto! Your Google Forms data is now in Excel!
Spreadsheets in Excel and Google Sheets have their apparent advantages in viewing the results of Google Form responses. They also have some drawbacks, particularly in Google Forms response analysis.
Again, spreadsheets are great for collecting, organizing, and even sharing data. They are a necessary tool for viewing the results of Google Form responses. However, they fall short when carrying out more complex analyses, such as Multivariate Analysis.
The problem has to do with how your brain “reads” and processes information. Raw text and numbers are one of the least efficient delivery methods. This is why it takes us many hours to read a book, but only one or two to watch a movie.
It’s the classic expression ” A picture is worth a thousand words”. The same adage is true in Google Forms response analysis. A chart is worth a thousand numbers (sometimes tens of thousands)!
Once your survey data is in Excel, it’s very easy to turn it into a visualization. For the best survey charts, we recommend downloading ChartExpo, an add-in for Excel from the Microsoft App Source.
ChartExpo enhances charting in Excel in two major ways. First, it adds several new chart types not previously found in Excel. This includes options such as the 5-point or 7-point Likert scale.
How to Install ChartExpo in Microsoft Excel?
ChartExpo charts and graphs are available both in Google Sheets and Microsoft Excel. Please use the following CTA’s to install the tool of your choice and create beautiful visualizations in a few clicks in your favorite tool.
Let’s say you want to do a student satisfaction survey. Let’s have a look at the questions that you want to ask:
Below are the responses (feedback) that are associated with each question:
| Timestamp | How satisfied are you with the quality of teaching? |
How satisfied are you with the academic resources? |
How satisfied are you with the administrative services? |
How satisfied are you with the availability of extracurricular activities? |
| 10-13-2023 17:47:33 | Neutral | Dissatisfied | Dissatisfied | Delighted |
| 10-13-2023 17:47:33 | Delighted | Delighted | Frustrated | Neutral |
| 10-13-2023 17:47:33 | Satisfied | Dissatisfied | Delighted | Dissatisfied |
| 10-13-2023 17:47:33 | Delighted | Delighted | Delighted | Satisfied |
| 10-13-2023 17:47:33 | Neutral | Satisfied | Neutral | Satisfied |
| 10-13-2023 17:47:33 | Satisfied | Neutral | Delighted | Delighted |
| 10-13-2023 17:47:33 | Delighted | Frustrated | Delighted | Frustrated |
| 10-13-2023 17:47:33 | Dissatisfied | Delighted | Delighted | Satisfied |
| 10-13-2023 17:47:33 | Frustrated | Neutral | Satisfied | Delighted |
| 10-13-2023 17:47:33 | Satisfied | Satisfied | Satisfied | Delighted |
| 10-13-2023 17:47:33 | Delighted | Satisfied | Frustrated | Satisfied |


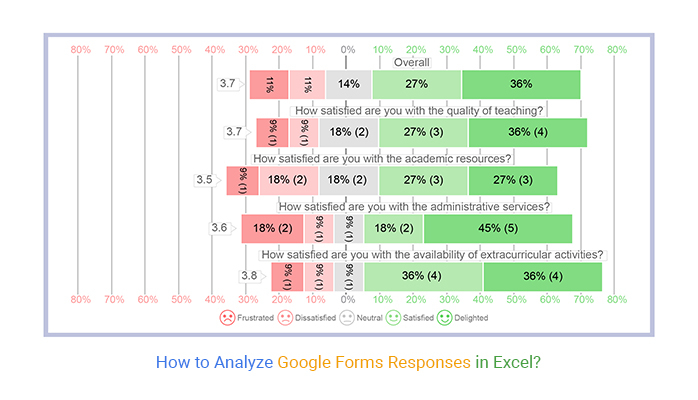
Overall, 36% of students responded that they are delighted with school, and 27% of students said that they were satisfied with school, which makes a total of 63% who are content with the school.
11% of students said that they are frustrated with school, and 11% of students said that they are dissatisfied with the school, which makes a total of 22% who are unhappy with school. 14% of students remained neutral while giving the response.
As you continue to view your Google Forms responses, you may find the need to manage the data. For instance, you may want to use Google Forms to delete responses.
This is a slippery slope. Deleting data can create inaccurate or biased results. However, you may want to know how to delete Google Forms responses because you’ve received inappropriate feedback. You don’t want this feedback in your reports.
Thus, you should strongly consider the impact whenever you’re looking at how to delete Google Forms responses. You can not recover Google Forms deleted responses.
To find the Google Forms delete responses function, use the “Individual” results view. You can then choose to delete any person’s responses.

You can view responses directly in the Google Form by clicking the “Responses” tab. You can also link the form to a Google Sheet to see all entries in a spreadsheet.
No, only the form creator and collaborators with permission can see responses. Respondents cannot view other people’s submissions unless the creator enables response summaries to be shared.
This usually happens if the form is not accepting responses, the internet connection was interrupted during submission, or the responses are stored in a linked Google Sheet but not updated. Double-check that the form is still active and connected to the correct sheet.
Google Forms makes it remarkably easy to create and share questionnaires. These feedback forms are vital for gathering audience insights. You can then use these insights to improve products, experiences, campaigns, etc.
Knowing how to see Google Forms responses from your questionnaires is the first step to analyzing results.
One of the benefits of this tool is that you can view Google Forms responses in real-time. As soon as someone completes your questionnaire, the results page updates. The agility of how to get Google Forms response data enables you to act swiftly on the latest audience insights.
For even faster survey data analysis, you can view Google Forms responses in Excel. This makes it easier to analyze your results and discover actionable insights. You’ll be improving key business strategies in no time!
That said, survey data can quickly build and become overwhelming. A single Google Forms multiple-choice grid question can create tons of data by itself. If your questionnaire includes many items, the data grows exponentially.
To avoid analyzing overloaded spreadsheets, we recommend charting your Google Forms responses with ChartExpo. This Excel add-in will turn your results into beautiful survey charts, shortening the path to insight substantially.
Together, these tools help you get to know your audience in new and impactful ways.
How much did you enjoy this article?


Google Forms to Google Sheets keeps your data organized and current with every submission. Learn the steps, methods, and tips now!

Product survey questions reveal what customers truly think. Learn how to ask the right ones and act on the survey results. Read on!

Learn how the 5-Point Performance Rating Scale improves employee evaluations with clear, consistent, and fair performance reviews across teams.


