Categories
What is the capital adequacy ratio? What impact does it have on the stability of financial institutions?
Imagine a world where global, system-wide crises disrupt the economy. That keeps banks at risk of going under, risking depositors’ money. That is where the capital adequacy ratio comes in.


But before we go about understanding how it functions, let’s understand what is capital adequacy ratio. Capital adequacy measures how well a bank holds enough capital to absorb losses and protect its depositors.
The capital adequacy ratio is obtained by dividing a bank’s capital by its risk-weighted assets. It ensures banks have large enough financial padding to suffer losses without the risk of collapsing.
Basel II sets the minimum capital adequacy ratio at 8% and Basel III at 10.5%. These figures help to prevent banks from going insolvent and bolster banks’ ability to withstand potential shocks.
The core capital, tier-1 capital, and the supplementary capital, tier-2 capital, are essential in measuring the capital adequacy ratio. They give a view into a bank’s potential losses and how it can withstand financial adversities.
If you like, the capital adequacy ratio is the depositor’s last line of defense. It is also the basic system of financial security.
So, let us get to the heart of this critical financial metric.
First, let’s demystify the capital adequacy ratio meaning.
Definition: The Capital Adequacy Ratio (CAR) measures a bank’s capital. It is calculated as a percentage of a bank’s risk-weighted credit exposures. The CAR ensures the bank can absorb a reasonable amount of loss and is crucial for financial stability.
There are two types of capital: Tier 1 and Tier 2.
Regulators set minimum CAR requirements. This ensures banks maintain a buffer against unexpected losses. A higher CAR indicates a stronger bank. It reduces the risk of insolvency during financial stress.
CAR helps protect depositors and maintain confidence in the banking system. It is a key metric in the Basel Accords, which are global regulatory frameworks. These frameworks standardize banking regulations worldwide.
Central banks and bank regulators decide on the Capital Adequacy Ratio (CAR). Why? To prevent commercial banks from becoming insolvent by taking on too much leverage.
Having a sufficient CAR is crucial for banks. It allows them to absorb certain losses without going bankrupt and putting depositors’ money at risk.
Generally speaking, a bank with a high CRAR/CAR is considered secure and in good financial health. That is, it can meet its financial commitments.
In the event of a bank winding up, depositors’ funds are given more importance than the bank’s capital. This means depositors will only lose their savings if the bank incurs a loss greater than its capital. Therefore, the more elevated the CAR, the more extensive the safeguarding of depositors’ funds at the bank.
The Capital Adequacy Ratio (CAR) helps maintain the stability of a country’s financial system. How? By minimizing the likelihood of banks becoming bankrupt.
Below, you can learn how to calculate the capital adequacy ratio.
To calculate CAR, you use the capital adequacy formula below;
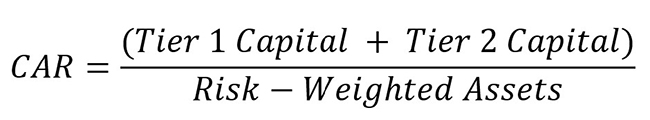
The Bank of International Settlements categorizes capital into Tier 1 and Tier 2, depending on its purpose and strength. Tier 1 capital is the primary method for assessing a bank’s financial well-being. Financial statements include shareholder’s equity and retained earnings, as disclosed.
Tier 1 capital, the principal capital kept in reserves, can withstand losses without affecting business activities. Conversely, Tier 2 capital consists of revalued reserves, undisclosed reserves, and hybrid securities. It is of inferior quality, less easily converted to cash, and more challenging to quantify. Therefore, it is referred to as supplementary capital.
Risk-weighted assets refer to a bank’s total assets adjusted based on its level of risk. Banks typically possess various types of assets, including cash, debentures, and bonds, each carrying a distinct risk level.
Risk weighting is determined by the probability of an asset’s value declining. Incorporating debt to total assets ratio analysis provides additional insight into how much of these assets are financed by debt, further influencing the risk profile and overall financial stability of the bank.
Safe asset classes like government debt have a risk weighting of approximately 0%. Assets like a debenture with minimal collateral are assigned a greater risk rating. This is due to the increased possibility that the bank may struggle to recover the loan.
The same asset class can also have varying levels of risk weighting. For instance, imagine a bank providing loans to three separate companies. The loans may vary in risk weighting depending on each company’s repayment capability.
Improving the capital adequacy ratio is like getting ready for a big challenge. It requires a mix of strategies to ensure the bank is strong and prepared to face any financial hurdles. Here are some effective ways to boost the CAR.
Data analysis can be as perplexing as a maze, demanding hours of spotting, identifying, and interpreting. Amidst this complexity, the Capital Adequacy Ratio hides like a needle in a haystack, waiting to be discovered.
But don’t worry. Data visualization acts as the guiding light, revealing insights and patterns within the numbers. However, Excel, though reliable, falters in advanced data visualization.
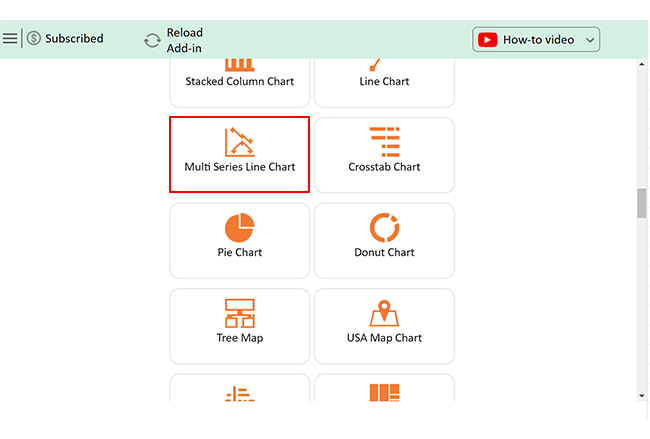
Enter ChartExpo, a beacon of hope. ChartExpo offers a solution to Excel’s limitations and illuminates the path to clearer insights and informed decisions.
Let’s learn how to install ChartExpo in Excel.
ChartExpo charts are available both in Google Sheets and Microsoft Excel. Please use the following CTAs to install the tool of your choice and create beautiful visualizations with a few clicks in your favorite tool.


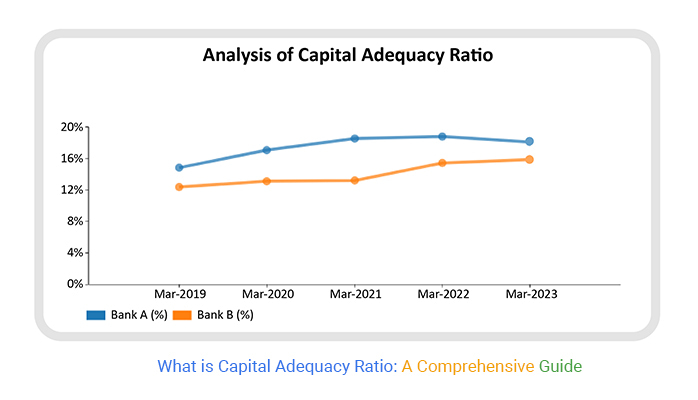
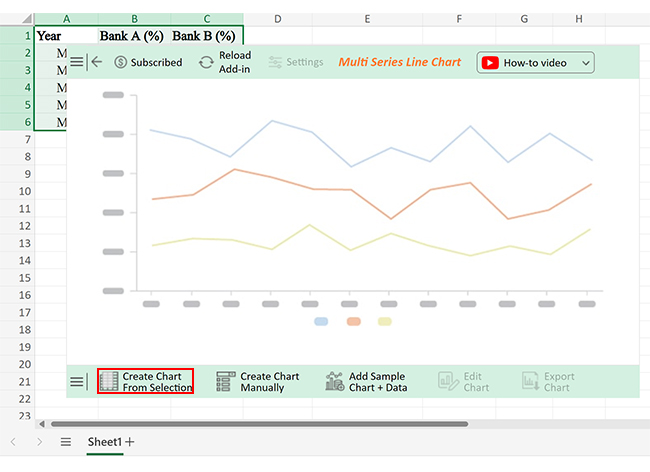
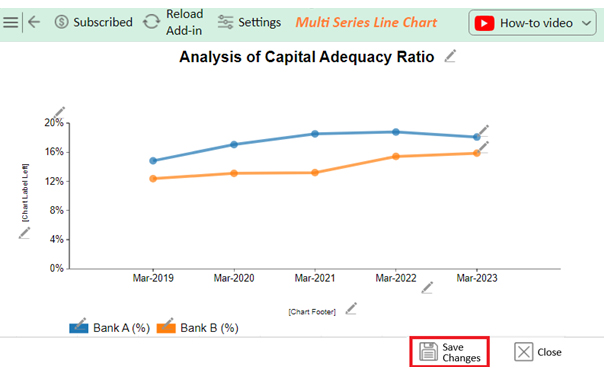
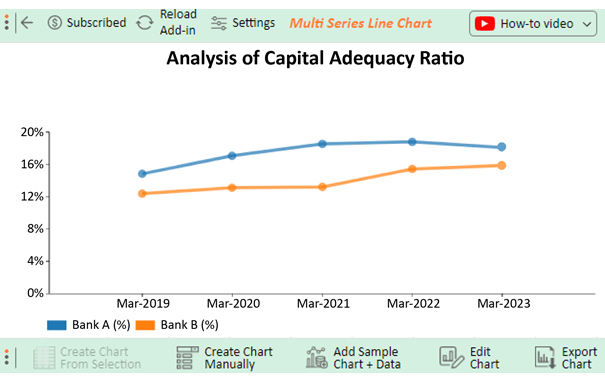
Let’s analyze the capital adequacy ratio example date below using ChartExpo.
| Year | Bank A (%) | Bank B (%) |
| Mar-2019 | 14.82 | 12.37 |
| Mar-2020 | 17.05 | 13.1 |
| Mar-2021 | 18.52 | 13.2 |
| Mar-2022 | 18.78 | 15.42 |
| Mar-2023 | 18.08 | 15.86 |


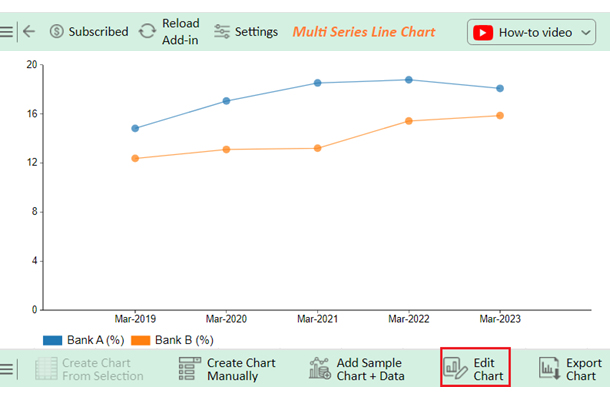


The capital adequacy ratio (CAR) measures a bank’s financial strength. It shows the ratio of a bank’s capital to its risk-weighted assets. A higher CAR means the bank can handle potential losses and financial stress better.
A high capital adequacy ratio is preferable. It indicates that a bank has a strong financial buffer. This helps the bank handle potential losses and reduces the risk of failure, ensuring greater stability and operational confidence.
A good capital adequacy ratio for banks is generally above 10-12%. Regulatory standards like Basel III recommend a minimum of 8%. However, higher ratios, around 15% or more, are considered strong and indicate better financial stability and resilience.
The capital adequacy ratio (CAR) is a crucial financial metric for banks. It measures a bank’s capital relative to its risk-weighted assets. A high CAR indicates strong financial health, ensuring the bank can withstand losses and financial stress.
CAR promotes stability in the banking system. By maintaining a robust CAR, banks can protect depositors and creditors. It encourages prudent risk management. Banks are incentivized to balance their risk profiles, which reduces the likelihood of failures.
Regulatory compliance is a key aspect of CAR. Banks must meet minimum CAR requirements set by regulatory bodies. This ensures they operate within safe and sound practices. Compliance helps maintain confidence in the banking system.
Improving CAR involves various strategies. Banks can raise more capital and reduce risk-weighted assets. Enhancing asset quality and profitability also helps. Effective balance sheet management and proactive capital planning are essential. Continuous monitoring ensures quick responses to changes.
A good CAR is generally above 10-12%. Basel III recommends a minimum of 8%, but higher is better. Strong CARs, around 15% or more, indicate resilience. They show the bank is well-prepared for financial challenges.
In conclusion, CAR is vital for a bank’s stability and investor confidence. Start monitoring it today using ChartExpo to ensure your bank’s financial soundness.
How much did you enjoy this article?


Calculate accounts receivable turnover ratio to measure credit collection speed, improve cash flow, and strengthen your financial strategy. Read on!

Change Management KPIs are the key to tracking adoption, performance, and ROI during transitions. Find out which metrics matter. Read on!

Data collection methods and techniques determine the quality of every insight you act on. Explore key approaches for gathering reliable data. Read on!


