• Home
  • Tools dropdown img
    • Spreadsheet Charts

      • ChartExpo for Google Sheets
      • ChartExpo for Microsoft Excel
    • Power BI Charts

      • Power BI Custom Visuals by ChartExpo
    • Word Cloud

  • Charts dropdown img
    • Chart Category

      • Bar Charts
      • Circle Graphs
      • Column Charts
      • Combo Charts
      • Comparison Charts
      • Line Graphs
      • PPC Charts
      • Sentiment Analysis Charts
      • Survey Charts
    • Chart Type

      • Box and Whisker Plot
      • Clustered Bar Chart
      • Clustered Column Chart
      • Comparison Bar Chart
      • Control Chart
      • CSAT Survey Bar Chart
      • CSAT Survey Chart
      • Dot Plot Chart
      • Double Bar Graph
      • Funnel Chart
      • Gauge Chart
      • Likert Scale Chart
      • Matrix Chart
      • Multi Axis Line Chart
      • Overlapping Bar Chart
      • Pareto Chart
      • Radar Chart
      • Radial Bar Chart
      • Sankey Diagram
      • Scatter Plot Chart
      • Slope Chart
      • Sunburst Chart
      • Tornado Chart
      • Waterfall Chart
      • Word Cloud
    • Google Sheets
      Microsoft Excel
  • Services
  • Pricing
  • Contact us
  • Blog
  • Support dropdown img
      • Gallery
      • Videos
      • Contact us
      • FAQs
      • Resources
    • Please feel free to contact us

      atsupport@chartexpo.com

Categories
All Data Visualizations Data Analytics Surveys
Add-ons/
  • Google Sheets
  • Microsoft Excel
  • Power BI
All Data Visualizations Data Analytics Surveys
Add-ons
  • Google Sheets
  • Microsoft Excel
  • Power BI

We use cookies

This website uses cookies to provide better user experience and user's session management.
By continuing visiting this website you consent the use of these cookies.

Ok

ChartExpo Survey


Home > Blog > Power BI

Power BI Alerts for Real-Time Insights

Have you ever wondered how organizations keep a vigilant eye on critical data without constant manual checking? That’s what Power BI alerts do. They keep a watchful eye on your company’s data in real-time and notify you when something noteworthy happens.

Power BI Alerts

Why are these alerts so crucial? The business arena is fast-moving, and data never stays in one place for long. With Power BI alerts, you’re not only keeping up with the change, you’re getting ahead of it. Power BI alerts is a personal notification service that lets you know when your conditions are met.

The days of manual data checks are long gone. In 2023, businesses saw a 20% increase in productivity when integrating real-time monitoring systems. Power BI alerts, being the customizable and flexible notification delivery system it is, was a key productivity growth driver.

And how flexible are these alerts? They are not one-size-fits-all. You can tailor them to your needs, setting them on tiles pinned from report visuals. They can also be synchronized across all platforms for a seamless experience. Whether on mobile apps or the Power BI service, your alerts follow you.

So, are Power BI alerts the silent heroes of data monitoring? Absolutely. They provide a layer of intelligence and automation that transforms the way you interact with your data. They ensure you’re alerted to the most critical changes as they happen.

Join us – let’s explore the concept of proactive data management with Power BI alerts.

Table of Contents:

  1. What are Power BI Alerts?
  2. Why is Power BI Data-Driven Alert Important?
  3. How to Manage Data Alerts in Power BI?
  4. How to Set Power BI Data Alert in a Dashboard?
  5. How to Visualize Your Data Using Power BI?
  6. What are the Advantages of Power BI Notifications Alerts?
  7. Wrap Up

First…

What are Power BI Alerts?

Definition: Power BI alerts are notifications triggered by predefined conditions or thresholds within Power BI dashboards and reports. These alerts keep you informed about significant changes or events in your data without actively monitoring the dashboard.

You can set up alerts based on various criteria, such as specific data values, trends, or anomalies. When the specified conditions are met, Power BI automatically sends out notifications via email or mobile app. This alerts you to take action or investigate further.

Power BI alerts empower you to proactively monitor data and respond promptly to critical events or deviations from expected outcomes. They provide a mechanism for real-time monitoring and decision-making. Thus, you can stay ahead of potential issues and capitalize on opportunities as they arise.

Why is Power BI Data-Driven Alert Important?

Power BI data-driven alerts are essential components of data analytics and business intelligence strategies. Why?

  • Real-time monitoring: Data-driven alerts enable you to monitor key metrics and performance indicators in real time. This allows for immediate awareness of significant changes or deviations from expected values, facilitating prompt decision-making and response.
  • Proactive problem-solving: Data-driven alerts enable you to set a perimeter via which you are notified once highly exceeded. Therefore, you are in a better position to solve the problem earlier since it is detected in advance.
  • Opportunity identification: Data-driven alerts not only highlight problems but also uncover opportunities. Monitoring trends and patterns in data helps to identify emerging opportunities. Then, capitalize on them promptly to gain a competitive edge.
  • Enhanced efficiency: Using Power BI alerts, teams can create a roadmap for monitoring activities. Then, dedicate more time to focus on immediate action items to increase operational efficiency. The efforts that otherwise went into manual monitoring can be driven toward other critical activities.
  • Continuous improvement: Analyzing the triggers and responses to alerts helps you gain valuable insights into your organization’s processes and performance. This feedback loop fosters a culture of continuous improvement. How? Lessons learned from alerts drive optimization and refinement of business strategies and operations.

How to Manage Data Alerts in Power BI?

Managing data alerts in Power BI is crucial for staying informed about important changes in your data. Then, take timely action. Here’s how to effectively manage data alerts in Power BI:

  1. Create alerts: Start by creating alerts for your key metrics or performance indicators. Specify the conditions that trigger the alert, such as thresholds or specific data values.
  2. Define alert conditions: Clearly define the conditions that warrant an alert, ensuring they align with your business objectives and priorities. Consider factors such as desired outcomes, acceptable tolerances, and potential risks.
  3. Configure alert settings: Customize the trigger settings in the way you feel necessary. Choose the preferred notification format, channels, how often you can be notified, and the right recipient for this information.
  4. Manage existing alerts: Regularly review and manage existing alerts to ensure they remain relevant and effective. Update alert conditions as needed based on changing business needs or data trends.
  5. Monitor alert activity: Monitor alert activity to stay informed about triggered alerts and their frequency. Track how often alerts are triggered, their impact on operations, and any patterns or trends that emerge.
  6. Review and act on alerts: Review alerts promptly upon receiving them and take appropriate actions based on their significance. Investigate the underlying causes of alerts, analyze trends, and implement necessary interventions or corrective measures.

How to Set Power BI Data Alert in a Dashboard?

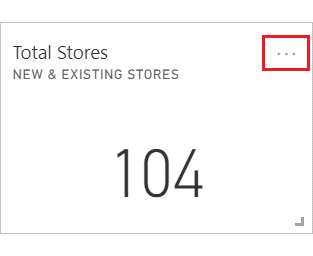
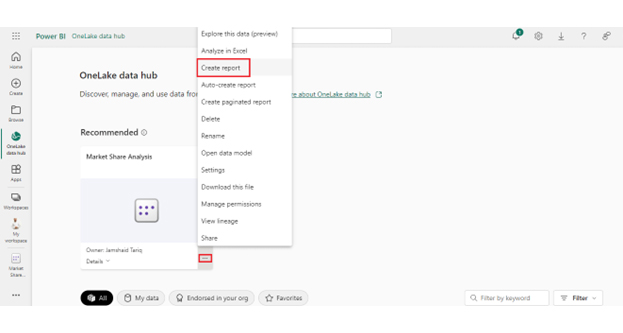
Start on a dashboard and locate the Total stores tile. Next, click on the ellipses icon associated with the tile.

Total Stores for Power BI Alerts

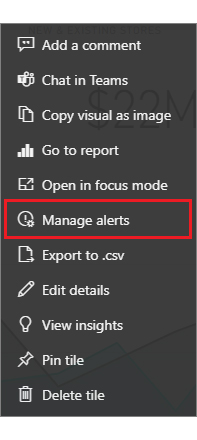
From the dropdown menu, choose “Manage alerts” to add one or more alerts for Total Stores.

Manage Alerts for Power BI Alerts

To start, click on the “+ Add alert rule” button. Ensure the Active slider is toggled to On and provide a descriptive title for your alert. Titles facilitate easy recognition of your alerts.

Add Alert Ruler for Power BI Alerts

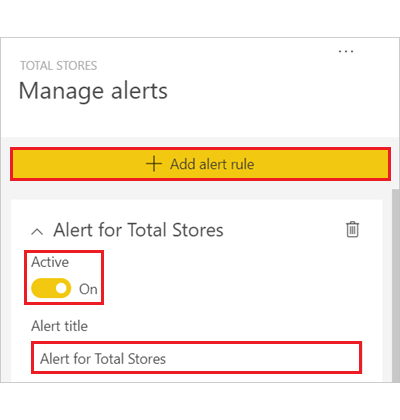
Proceed by scrolling down and inputting the alert details. For instance, you can set up an alert to notify you once daily if the number of total stores surpasses 100.

Alert Details for Power BI Alerts

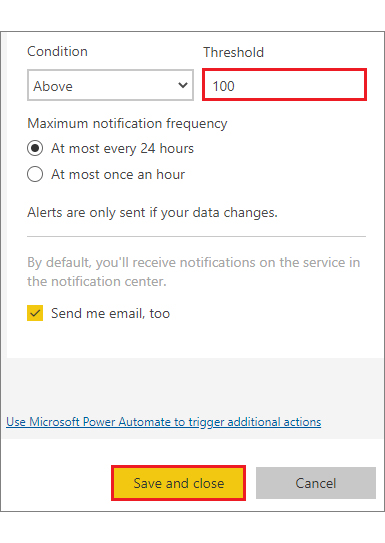
Your configured alerts will be displayed in the Notification Center. Additionally, if you select the checkbox, Power BI will email you a notification about the alert.

Select Save and Close.

How to Visualize Your Data Using Power BI?

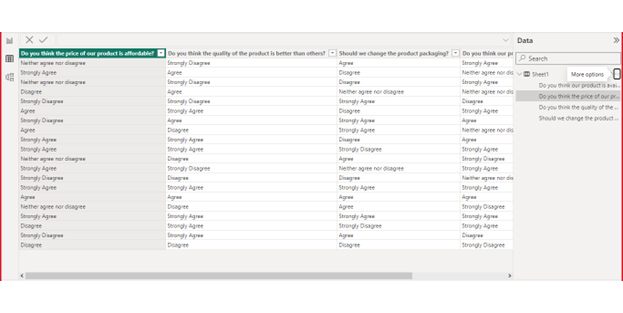
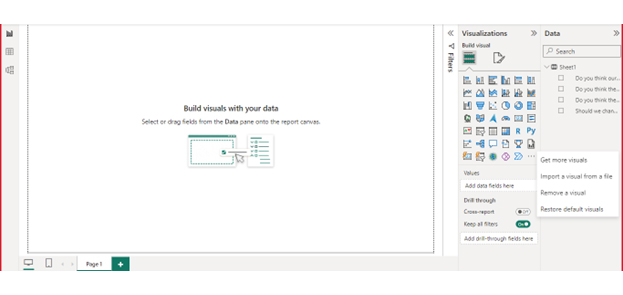
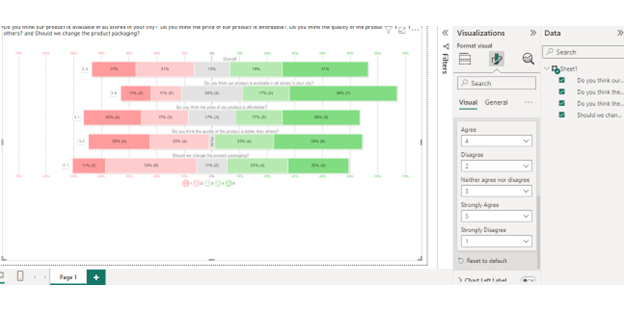
Follow these steps to harness the robust features of Power BI for effective data visualization.

Stage 1: Logging in to Power BI

  • Log in to Power BI.
  • Enter your email address and click the “Submit” button.
Enter email to login to Power BI
  • You are redirected to your Microsoft account.
  • Enter your password and click “Sign in“.
Enter Password to login to Power BI
  • You can choose whether to stay signed in.
Click on stay signed in
  • Once done, the Power BI home screen will open.

Stage 2: Creating a Data Set and Selecting the Data Set to Use in Your Chart

  • Go to the left-side menu and click the “Create” button.
  • Select “Paste or manually enter data“.
select Paste or manually enter data in Power BI ce487
  • We’ll use the sample data below for this example.
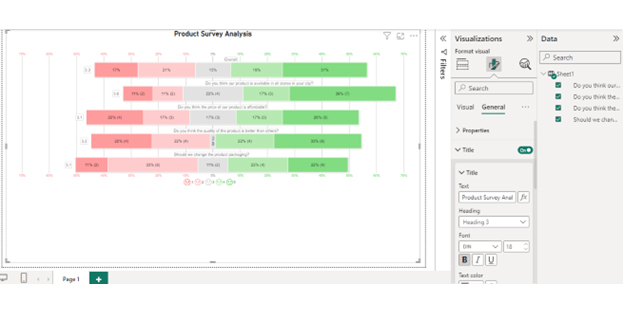
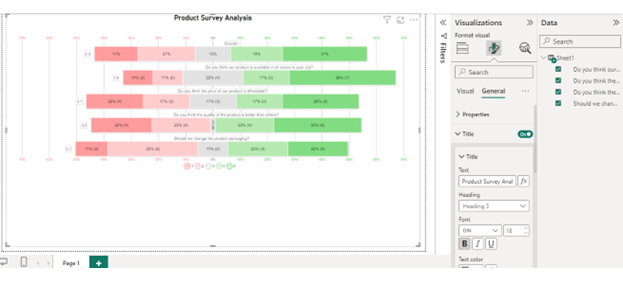
Is the price of our product affordable? Do you think the quality of the product is better than that of others? Should we change the product packaging? Is our product available in all stores in your city?
Neither agree nor disagree Strongly Disagree Agree Strongly Agree
Strongly Agree Agree Disagree Neither agree nor disagree
Neither agree nor disagree Strongly Disagree Disagree Strongly Agree
Disagree Agree Neither agree nor disagree Neither agree nor disagree
Strongly Disagree Strongly Disagree Strongly Agree Disagree
Agree Strongly Agree Disagree Strongly Agree
Strongly Disagree Agree Strongly Agree Agree
Agree Disagree Strongly Agree Neither agree nor disagree
Strongly Agree Strongly Agree Disagree Agree
Strongly Agree Strongly Agree Strongly Disagree Strongly Agree
Neither agree nor disagree Disagree Agree Strongly Disagree
Strongly Agree Strongly Disagree Neither agree nor disagree Strongly Agree
Strongly Disagree Disagree Disagree Neither agree nor disagree
Strongly Agree Strongly Agree Strongly Agree Strongly Agree
Agree Agree Agree Agree
Neither agree nor disagree Disagree Agree Strongly Disagree
Strongly Agree Strongly Agree Strongly Agree Strongly Agree
Disagree Strongly Agree Strongly Disagree Strongly Agree
Strongly Disagree Strongly Agree Agree Disagree
Disagree Disagree Disagree Strongly Disagree
  • Paste the above data table in the Power Query Window.
  • Select the “Create a dataset only” option.
Create Dataset After Getting Power BI Alerts
  • On the left-side menu, click “Data Hub“.
  • Power BI populates the data set list. (If you have not created a data set, refer to the Error! Reference source not found section)
  • Click on the “Create a report” dropdown.
Create Report After Getting Power BI Alerts
  • Click the “Expand All” button.
  • You can see your chart metrics:
  • Click on “Get more visuals“.
Get More Visuals After Getting Power BI Alerts
  • Search for ChartExpo and select the Likert Scale Chart:
Likert Scale Chart After Getting Power BI Alerts
  • Click the “Add” button.
Click Add Button After Getting Power BI Alerts
  • You can now see the Likert Scale Chart in the visualizations list.
Likert Scale Chart Icon After Getting Power BI Alerts
  • In Visual, click License Settings, add the key, and enable the license.
  • After adding the key, you can see the Likert Scale Chart.
Add Keys for Visuals After Getting Power BI Alerts
  • Set the scale of the chart as follows:
Set Scale of Chart After Getting Power BI Alerts
  • You can add the header text on top of the chart as follows:
Add Header to Chart After Getting Power BI Alerts
  • Your Likert Scale Chart final look in Power BI:
Final Power BI Alerts

Insights

  • Price Affordability: Strongly Agree: People think differently about how affordable the product is.
  • Product Quality: Strongly Agree: Customers overwhelmingly agree that the quality exceeds that of competitors.
  • Packaging Change: Disagree: There is no unanimous agreement on altering the packaging.
  • Availability in Stores: Mixed: It is unclear if the product is widely available in stores across the city.

What are the Advantages of Power BI Notifications Alerts?

Power BI notification alerts offer numerous advantages to staying informed and proactive in data-driven decision-making processes. Here are the key advantages of Power BI notifications alerts:

  • Real-time awareness: Power BI notification alerts provide real-time awareness of critical changes or events in your data. This enables immediate action and response to emerging trends or anomalies.
  • Proactive monitoring: With Power BI notifications alerts, you can proactively monitor your organization’s key metrics and performance indicators. Thus, you can identify and address issues before they escalate.
  • Customizable conditions: Power BI notification alerts allow you to define customizable conditions for triggering alerts. This ensures that alerts align with specific business requirements and objectives.
  • Flexible delivery options: Power BI notification alerts offer flexible delivery options, including email notifications and mobile app alerts. This allows you to receive alerts in your preferred format and channel.
  • Improved decision-making: By providing timely insights and alerts, Power BI notifications empower you to make informed decisions based on real-time data. It leads to improved business outcomes and performance.
  • Efficient workflow: Power BI notification alerts streamline workflow processes by notifying you of critical events or changes directly within Power BI. This reduces the need for manual monitoring and facilitates efficient decision-making and action.

FAQs

Can you set up alerts in Power BI?

Yes, you can set up alerts in Power BI. Navigate to the desired dashboard and locate the relevant data tile. Click on the ellipses icon and select “Manage alerts”. Configure your alert by defining the conditions and notification settings.

Are Power BI alerts only sent if your data changes?

No, Power BI alerts can be triggered based on predefined conditions, not solely data changes. You can set up alerts to monitor specific thresholds or patterns. Once the conditions are met, Power BI sends notifications promptly, regardless of whether the data changes.

How do I create an alert in Power Automate?

To create an alert in Power Automate:

  1. Open Power Automate and navigate to the “My Flows” tab.
  2. Click on “New” and select “Instant flow”.
  3. Choose the trigger that will initiate the alert.
  4. Configure the action to be taken when the trigger occurs.

Wrap Up

Power BI alerts are a critical addition to its capabilities. They ensure you stay on top of the critical changes happening to your data. Alerts are also a great tool for monitoring the metrics that matter most to you.

When you leverage Power BI alerts, you encourage a proactive and notification-based culture for your team. If your data goes above or below a certain threshold, you will be the first to know. It ensures timely, reliable, and accurate notifications about your data right when it matters the most.

With Power BI alerts, you can easily set up conditions tailored to your business insights. Whether you want to hone in on sales performance or inventory levels, set your alert criteria that map to your strategic objectives.

Moreover, Power BI alerts can help optimize workflows and save time from having to monitor your dashboards proactively. Instead of keeping a keen eye on the dashboards, you can set what matters and walk away. You’ll only get notified when you need to step in. It saves precious time for you to focus on more important responsibilities and challenges.

Conclusively, Power BI alerts are a must-have for your business to fully leverage data’s potential. They provide real-time alerts that can be set using your own rules and save time. They enable you to understand your data in real-time, take action, and drive business growth in a data-driven world.

How much did you enjoy this article?

PBIAd2
Start Free Trial!
135188

Related articles

next previous
Power BI12 min read

How to Create Sankey Diagram in Microsoft Power BI?

Learn How to Create Sankey Diagram in Microsoft Power BI using Desktop & Web Service. What they are and how to use them effectively.

Power BI8 min read

Power BI Artificial Intelligence: Insights Using Visuals

Discover all there is to know about the Power BI artificial intelligence. You'll also discover how AI is used in Power BI, and how to use it for analysis and more.

Power BI9 min read

Budgeting in Healthcare: Use Visuals to Spot Budget Gaps

This guide helps you discover what budgeting in healthcare is. You'll also discover the factors that affect hospital budgets and types of budgeting in healthcare.

Power BI9 min read

Predictive Analytics in Power BI for Making Insightful Visuals

This guide shows you everything you need to know about Predictive Analytics in Power BI. It also shows you how it works, and how to interpret the results.

Power BI8 min read

Quarterly Business Review Template for Optimum Reports

Discover what the quarterly business review template is. This guide also shows you the best practices to consider when using the QBR template.

ChartExpo logo

Turn Data into Visual
Stories

CHARTEXPO

  • Home
  • Gallery
  • Videos
  • Services
  • Pricing
  • Contact us
  • FAQs
  • Privacy policy
  • Terms of Service
  • Sitemap

TOOLS

  • ChartExpo for Google Sheets
  • ChartExpo for Microsoft Excel
  • Power BI Custom Visuals by ChartExpo
  • Word Cloud

CATEGORIES

  • Bar Charts
  • Circle Graphs
  • Column Charts
  • Combo Charts
  • Comparison Charts
  • Line Graphs
  • PPC Charts
  • Sentiment Analysis Charts
  • Survey Charts

TOP CHARTS

  • Sankey Diagram
  • Likert Scale Chart
  • Comparison Bar Chart
  • Pareto Chart
  • Funnel Chart
  • Gauge Chart
  • Radar Chart
  • Radial Bar Chart
  • Sunburst Chart
  • see more
  • Scatter Plot Chart
  • CSAT Survey Bar Chart
  • CSAT Survey Chart
  • Dot Plot Chart
  • Double Bar Graph
  • Matrix Chart
  • Multi Axis Line Chart
  • Overlapping Bar Chart
  • Control Chart
  • Slope Chart
  • Clustered Bar Chart
  • Clustered Column Chart
  • Box and Whisker Plot
  • Tornado Chart
  • Waterfall Chart
  • Word Cloud
  • see less

RESOURCES

  • Blog
  • Resources
  • YouTube
SIGN UP FOR UPDATES

We wouldn't dream of spamming you or selling your info.

© 2025 ChartExpo, all rights reserved.