Categories
Customer opinions shape every great product decision, yet most businesses struggle to collect them effectively. Product survey questions give teams a direct line to user experience, satisfaction levels, and unmet needs. Without the right questions, feedback becomes noise rather than direction.
This guide covers what a product survey is, why the questions you ask matter, which questions to include, and how to turn your results into better decisions.
Whether your team is launching something new or refining an existing offering, asking the right questions to ask customers about your product can make all the difference.
Definition: Product survey questions are the core of a structured process used to gather feedback from customers about a product, service, or specific feature. The primary goal is to measure satisfaction, surface unmet needs, and identify where improvements are most needed.
Product managers, marketers, and research teams rely on these surveys to ground their planning in real evidence rather than assumptions.
A well-designed product survey captures opinions, feature preferences, usage patterns, ratings, and open-ended ideas. This kind of data shapes product strategy by reflecting genuine user experience.
There are several formats to choose from, including satisfaction surveys, feature feedback surveys, and demographic survey questions, each suited to different stages of the product lifecycle.
Gathering feedback without a clear purpose wastes both time and goodwill. Knowing exactly why to include questions to ask customers about your product shapes a more focused, useful survey. Each question should serve a specific purpose: uncover problems, generate ideas, or validate direction.
Key reasons to use product survey questions include:
A survey’s value comes down to one thing: whether the questions surface information worth acting on. Well-constructed product survey questions are specific, neutral, and tied to a clear decision your team needs to make.
Here are the top survey questions to include:
New product launches carry higher stakes, which is why tailored product survey questions are especially important at this stage. Responses collected before or immediately after a launch reveal whether the product lands the way you intended.
Use these questions to ask customers about your product before or after launch:
A poorly designed questionnaire produces unreliable data regardless of how many people respond. Good survey design starts with structure and ends with testing. Follow these steps:
Frame each question around a single topic so respondents never have to interpret what is being asked or guess at the correct response unit.
Strip out jargon and industry terms that non-expert customers may not recognize, so every participant can respond with confidence.
Wording that steers respondents toward a preferred answer corrupts your survey results and makes findings unreliable for any real decision-making.
Structured formats, such as survey scale questions and fixed-choice options, make responses faster to complete and far easier to analyze across a large sample.
Trim anything that does not directly inform a product decision, since every extra question you add lowers the completion rate and dilutes the quality of responses.
Pilot your Google survey with a small group first to catch confusing phrasing, broken logic, or missing options before the full rollout.
Raw feedback only becomes useful when it is organized, cleaned, and interpreted. A structured analysis process turns survey responses into patterns your team can act on.
Transfer all collected responses into a survey in Google Sheets so everything sits in one place and is ready for analysis.
Delete blank submissions and duplicate entries so that skewed or incomplete records do not distort the findings.
Apply spreadsheet formulas to compute totals and average survey response rates, giving you a clear statistical baseline to interpret.
Group responses by category or demographic using pivot tables to reveal patterns that would otherwise be buried in raw rows of data.
Visual representations make it faster to spot trends, compare rating distributions, and communicate findings to stakeholders.
Charts built around scale-based responses make satisfaction scores easy to read and compare across different question areas.
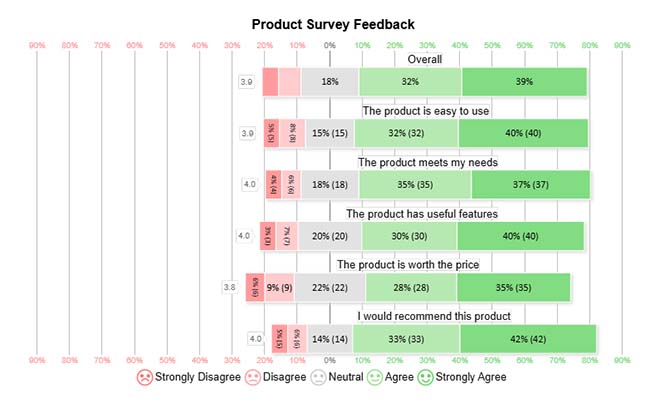
Third-party add-ons connect directly with Sheets and convert your data into professional charts, including a Likert Scale chart, for fast and compelling analysis.
The chart shows product survey feedback with most respondents selecting Agree or Strongly Agree across usability, features, value, and recommendation, indicating overall positive sentiment.
Using ChartExpo, the visualization clearly highlights that ease of use and recommendation score highest, while pricing has relatively more neutral and negative responses.
Teams that invest in well-designed product survey questions consistently build better products because their decisions draw from real evidence, not internal opinions.
Core advantages include:
Even well-intentioned surveys fail when the product survey questions are vague, excessive, or structured in ways that distort the data they collect.
Watch out for these frequent errors:
Begin by defining a specific goal, then build a set of focused questions, distribute the survey to the right audience, and review the responses for actionable patterns.
Write in plain, neutral language, mix rating scales with open-ended options, and cut any question that does not connect to a decision your team actually needs to make.
Cover first impressions, expected features, purchase intent, and overall value using product survey questions designed for the pre- or post-launch stage.
Run surveys on a recurring cadence tied to updates, major releases, and significant changes so your team tracks customer satisfaction as the product evolves.
Designing product survey questions that actually move the needle requires more than collecting responses. It requires knowing what you are trying to learn, asking with precision, and committing to analyzing what comes back.
Teams that treat feedback as a continuous process rather than a one-time exercise build more resilient products and stronger customer relationships.
Start with a clear goal, choose questions that match it, and revisit the process after every major update. The gap between what you assume customers want and what they actually need narrows every time you listen well.
How much did you enjoy this article?


Google Forms to Google Sheets keeps your data organized and current with every submission. Learn the steps, methods, and tips now!

Learn how the 5-Point Performance Rating Scale improves employee evaluations with clear, consistent, and fair performance reviews across teams.

Fun Survey Questions can raise response rates, reveal patterns, and guide survey planning across teams, classrooms, and customer research. Read on!