• Home
  • Tools dropdown img
    • Spreadsheet Charts

      • ChartExpo for Google Sheets
      • ChartExpo for Microsoft Excel
    • Power BI Charts

      • Power BI Custom Visuals by ChartExpo
    • Word Cloud

  • Charts dropdown img
    • Chart Category

      • Bar Charts
      • Circle Graphs
      • Column Charts
      • Combo Charts
      • Comparison Charts
      • Line Graphs
      • PPC Charts
      • Sentiment Analysis Charts
      • Survey Charts
    • Chart Type

      • Box and Whisker Plot
      • Clustered Bar Chart
      • Clustered Column Chart
      • Comparison Bar Chart
      • Control Chart
      • CSAT Survey Bar Chart
      • CSAT Survey Chart
      • Dot Plot Chart
      • Double Bar Graph
      • Funnel Chart
      • Gauge Chart
      • Likert Scale Chart
      • Matrix Chart
      • Multi Axis Line Chart
      • Overlapping Bar Chart
      • Pareto Chart
      • Radar Chart
      • Radial Bar Chart
      • Sankey Diagram
      • Scatter Plot Chart
      • Slope Chart
      • Sunburst Chart
      • Tornado Chart
      • Waterfall Chart
      • Word Cloud
    • Google Sheets
      Microsoft Excel
  • Services
  • Pricing
  • Contact us
  • Blog
  • Support dropdown img
      • Gallery
      • Videos
      • Contact us
      • FAQs
      • Resources
    • Please feel free to contact us

      atsupport@chartexpo.com

Categories
All Data Visualizations Data Analytics Surveys
Add-ons/
  • Google Sheets
  • Microsoft Excel
  • Power BI
All Data Visualizations Data Analytics Surveys
Add-ons
  • Google Sheets
  • Microsoft Excel
  • Power BI

We use cookies

This website uses cookies to provide better user experience and user's session management.
By continuing visiting this website you consent the use of these cookies.

Ok

ChartExpo Survey


Home > Blog > Microsoft Excel

MS 365 Admin Center: Configuring Apps for Productivity

What is the MS 365 admin center, and why does it matter? This powerful hub is the backbone of Microsoft 365. It gives IT admins the tools to manage users, services, and devices efficiently. Imagine overseeing an organization’s entire digital environment from one centralized dashboard. That’s the core of the MS 365 admin center.

Microsoft 365 has over 345 million paid seats as of 2024. Organizations rely on it daily for productivity and collaboration. The admin center plays a pivotal role in ensuring these services run smoothly. Whether resetting passwords, configuring security policies, or monitoring service health, this tool is the gateway to seamless operations.

MS 365 Admin Center

Businesses face increasing cybersecurity threats. In 2022, cyberattacks surged by 38% globally. The MS 365 admin center empowers you to act swiftly. With features like conditional access and advanced reporting, it safeguards sensitive data while keeping teams connected.

Ease of use is key. The interface simplifies complex processes. Quick links, search capabilities, and actionable insights save time and reduce errors. It’s designed for everyone, from seasoned IT professionals to those new to system management.

The MS 365 admin center is more than a tool—it’s a lifeline for modern businesses. Its features help organizations stay productive, secure, and adaptable in an era when efficiency matters most.

Are you ready to explore what makes MS 365 admin center indispensable? Follow my lead.

Table of Content:

  1. What is the Microsoft 365 Admin Center?
  2. Why Use Admin Center for Office 365?
  3. How Do I Open the Microsoft 365 Admin Center?
  4. What are the Interface Components in the Office 365 Administration Center?
  5. Is There an Alternative to the Native Admin Center?
  6. What are the Microsoft 365 Admin Center Features and Settings?
  7. How to Use Microsoft 365 Admin Center?
  8. Overview of Two Dashboard Views in Office 365 Admin Center
  9. How to Create Reports in Microsoft 365 Admin Center?
  10. Wrap Up

What is the Microsoft 365 Admin Center?

Definition: The Microsoft 365 admin center is a centralized hub for managing Microsoft 365 services. It allows administrators to oversee users, devices, subscriptions, and security settings.

This tool simplifies tasks like adding users, resetting passwords, and monitoring system health. It also provides insights into usage and potential issues, helping businesses stay productive and secure. With its user-friendly interface, the admin center makes managing IT environments efficient and straightforward. It’s essential for keeping organizations running smoothly in today’s digital landscape.

Why Use Admin Center for Office 365?

The admin center isn’t just a tool it’s the key to smoother operations and better outcomes. It’s your go-to tool for managing and optimizing your organization’s digital workspace. Here are the key reasons why you should use it:

  • Centralized control: Manage users, devices, and services from one simple dashboard. It’s all in one place, saving time and effort.
  • Efficient licensing: Assign and track licenses with ease. No more guesswork, only smart resource allocation.
  • Security first: Protect data with advanced tools for compliance and threat management. Keep your business safe from evolving risks.
  • Real-time monitoring: Check service health and resolve issues quickly. Stay ahead of downtime with proactive alerts.
  • Custom insights and settings: Access reports, analyze usage, and adjust settings to fit your team’s needs. These simple data analytics help make informed decision-making effortless.

How Do I Open the Microsoft 365 Admin Center?

It’s easier than you think. Whether you’re on a computer or a mobile device, there’s a way to get there quickly. Here’s how:

  1. Sign in to Microsoft 365: Log in with your admin credentials at office.com. Once inside, you’ll see the admin app listed—click it, and you’re in!
  2. Access via Office portal: Already in your Office apps? Look for the “Admin” tile on the dashboard. One-click takes you straight to the admin center.
  3. Using a mobile device: Are you on the go? The Microsoft 365 Admin app, available for iOS and Android, lets you manage tasks anytime, anywhere.
  4. Direct access from subscription links: If you have subscription confirmation emails, they often include a direct link to the admin center. Bookmark it for quick access.

What are the Interface Components in the Office 365 Administration Center?

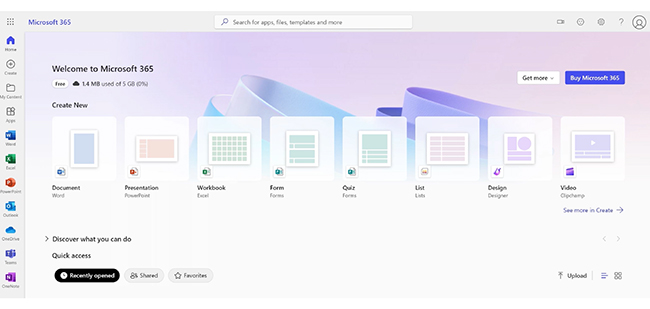
Welcome to the Office 365 Admin Center! It’s your command hub for managing everything Microsoft 365. Let’s break down the key parts:

  1. Dashboard: This is the first thing you see. It’s packed with alerts, shortcuts, and updates and gives a quick overview of your organization’s activities.
  2. Navigation Pane: This menu, on the left, lets you easily jump between sections, from user management to reports.
  3. Users Section: Manage people here. Add users, reset passwords, or assign licenses. It’s where all account-related tasks happen.
  4. Billing and Subscriptions: Manage your subscriptions. View plans, check renewal dates, and download invoices. Everything related to costs is here.
  5. Reports and Insights: Get detailed app usage, storage, and user activity analytics.
  6. Service Health is the place to go when something’s wrong. It provides real-time updates on outages and maintenance.
  7. Settings and Policies: Customize how Office 365 works for your team. Adjust sharing, security, and compliance settings. Build policies that fit your organization.

Is There an Alternative to the Native Admin Center?

The Office 365 Admin Center is powerful, but sometimes you need extra flexibility. Whether you want more control, automation, or advanced features, there are great alternatives to explore.

  • Third-Party Management Tools: Tools like ManageEngine or AvePoint offer advanced features. They simplify complex tasks, provide detailed reporting, and integrate with other systems seamlessly.
  • PowerShell: For tech-savvy admins, PowerShell is a game-changer. It allows you to automate tasks, execute bulk actions, and dive deeper into customization with precise commands.
  • Microsoft Graph API: Do you need more control? The Microsoft Graph API lets developers interact with Microsoft 365 data directly, perfect for creating custom solutions tailored to unique requirements.

What are the Microsoft 365 Admin Center Features and Settings?

The Microsoft 365 Admin Center is your central hub for managing everything in your organization. It simplifies tasks and boosts productivity with these key features:

  • User and group management: Add, manage, and assign user roles. Create groups for easy collaboration and permissions; it’s all about keeping your team organized.
  • Billing and licensing: Easily manage subscriptions and licenses. Track costs, renew plans, and download invoices all in one place.
  • Security and compliance: This section sets security policies and ensures compliance. From data protection to access controls, it keeps your organization safe.
  • Reports and analytics: Gain insights into usage, activity, and system performance. Reports help you make informed decisions for a more efficient organization.
  • Device and service management: Control how devices connect to your services. Manage maintenance schedules, service health, and keep everything running smoothly.

How to Use Microsoft 365 Admin Center?

Are you ready to take control of your Microsoft 365 environment? The Admin Center makes it simple. Here’s a quick guide to get you started:

  1. Access the admin center: Head to admin.microsoft.com and log in with your admin account. That’s your gateway.
  2. Navigate the dashboard: The dashboard is your command center. Here, you can check for alerts, updates, and quick stats—everything at a glance.
  3. Manage users and groups: To keep your team organized and secure, create users, assign roles, and set up groups.
  4. Monitor service health: Check service status to see if there are any outages or maintenance. This will help you stay informed.
  5. Manage licenses and billing: Keep close tabs on costs – view your subscriptions and assign licenses.
  6. Configure Security and Policies: Set security rules, enable multi-factor authentication, and manage data protection.
  7. Analyze reports: Access usage stats and review activity reports. Data analysis will help you make smart decisions.

Overview of Two Dashboard Views in Office 365 Admin Center

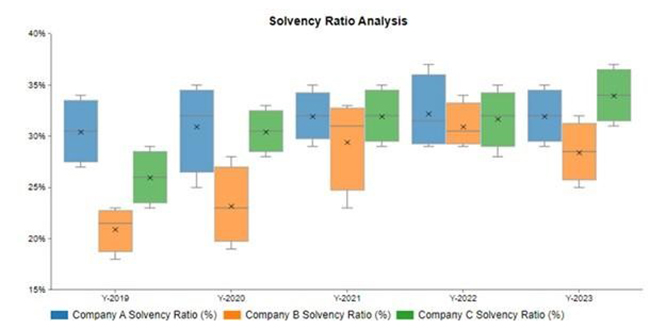
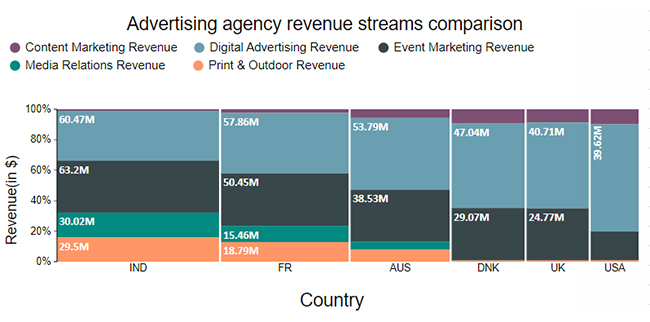
The dashboards below were created in Excel using ChartExpo.

What is ChartExpo?

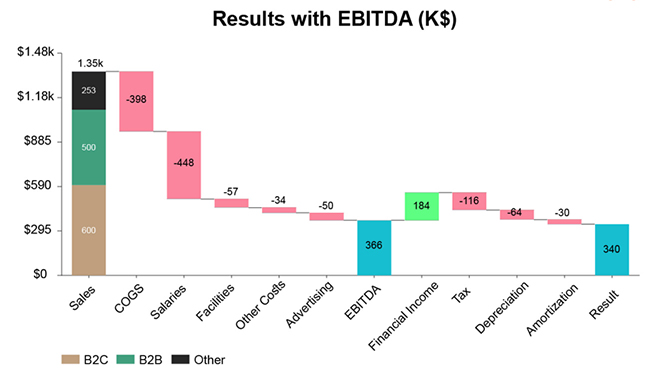
ChartExpo is a user-friendly chart maker for Excel. It transforms complex data into clear, actionable insights for improved decision-making. ChartExpo enhances business analytics with advanced visualizations like Box and Whisker charts, Sankey diagrams, and Waterfall charts.

Dashboard Featuring Box and Whisker Chart

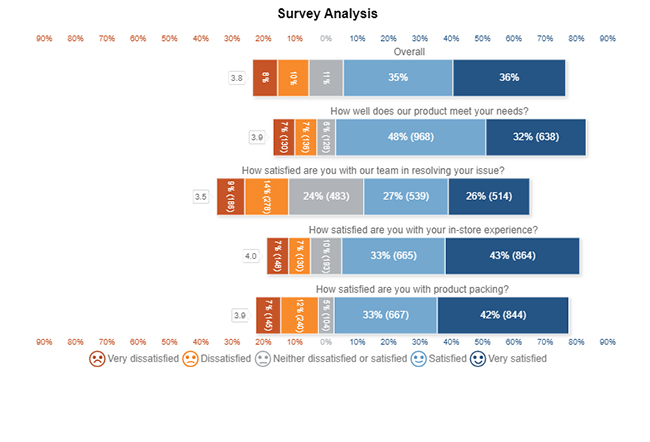
The dashboard below allows you to examine the “Solvency Ratio Analysis” in detail using a Box and Whisker Column Chart:

Box and Whisker Chart CE745

Dashboard Featuring Sankey Diagram

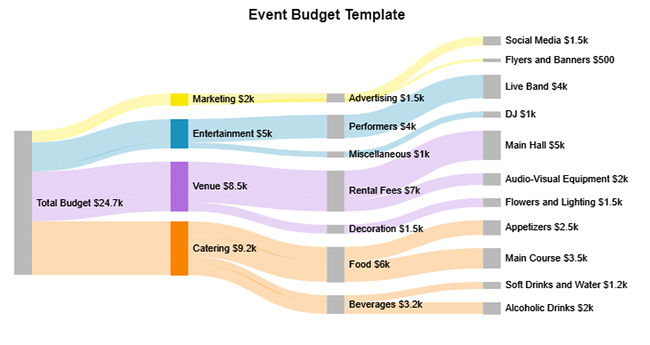
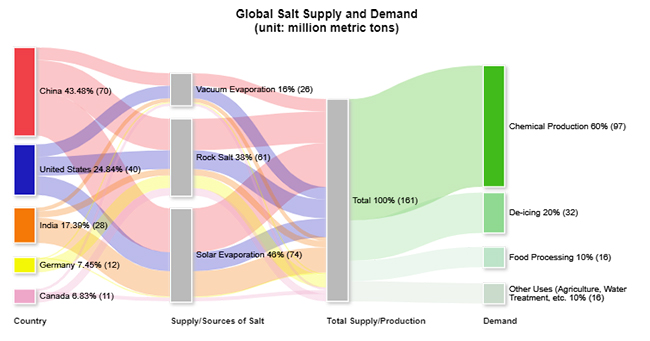
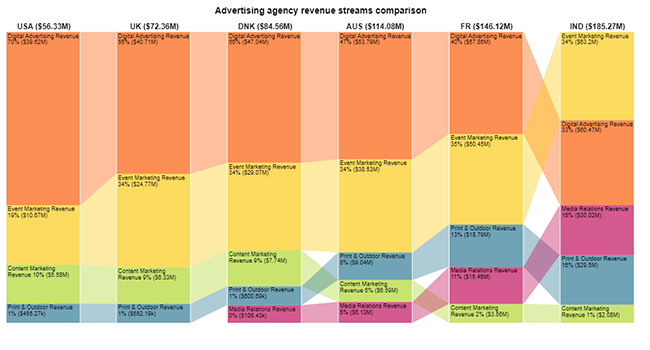
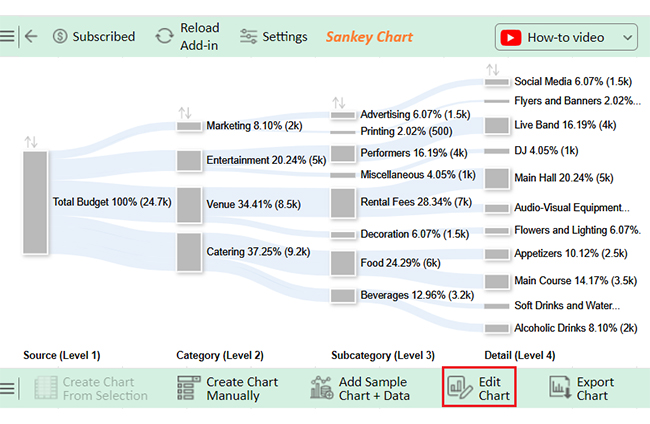
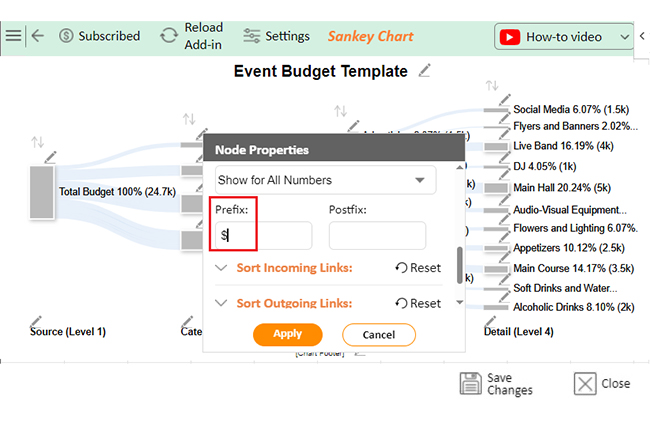
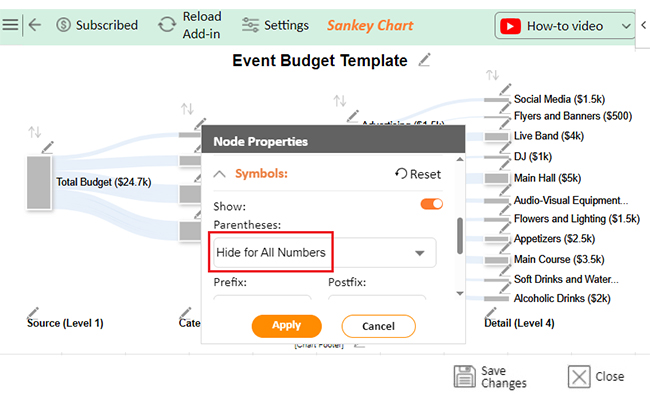
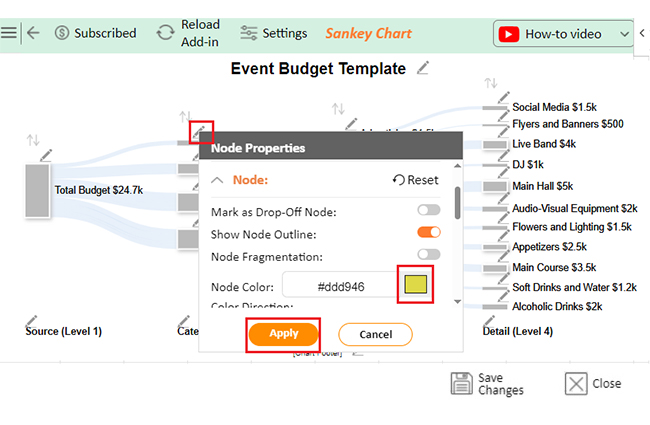
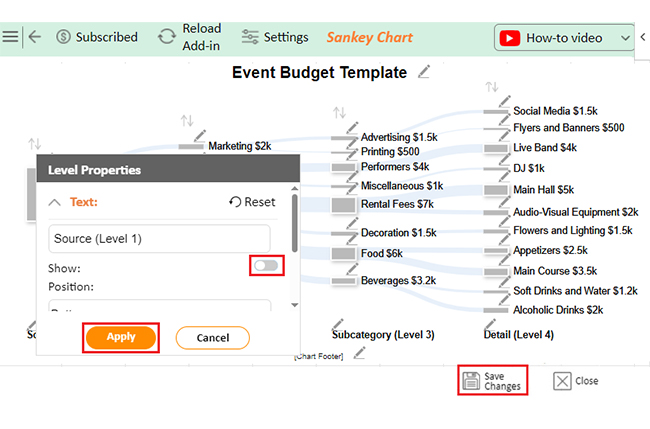
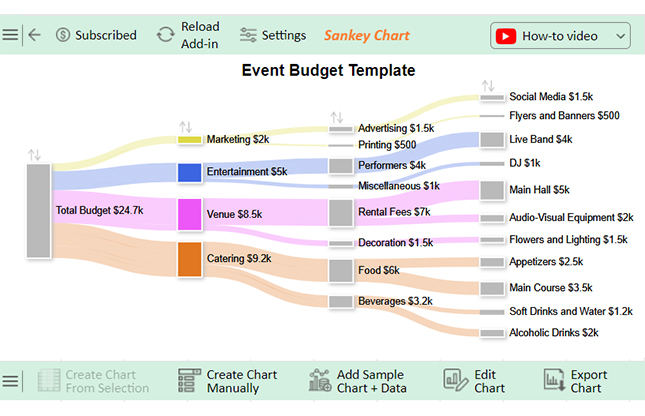
This dashboard provides insights into the “Event Budget Flow,” using a visually intuitive Sankey Diagram:

Sankey Diagram CE745

ChartExpo Admin Installation Guide:

ChartExpo Admin Installation Videos

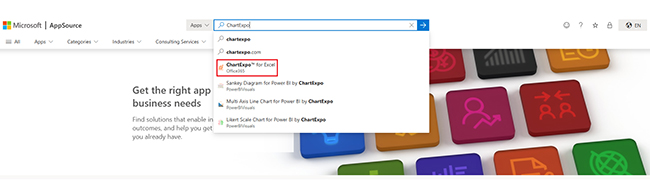
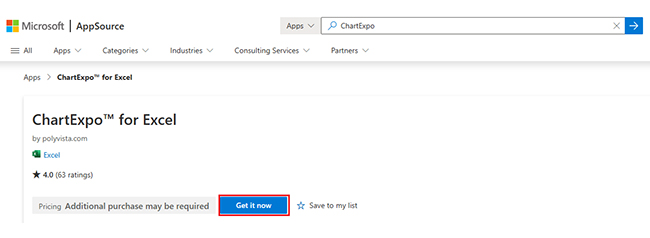
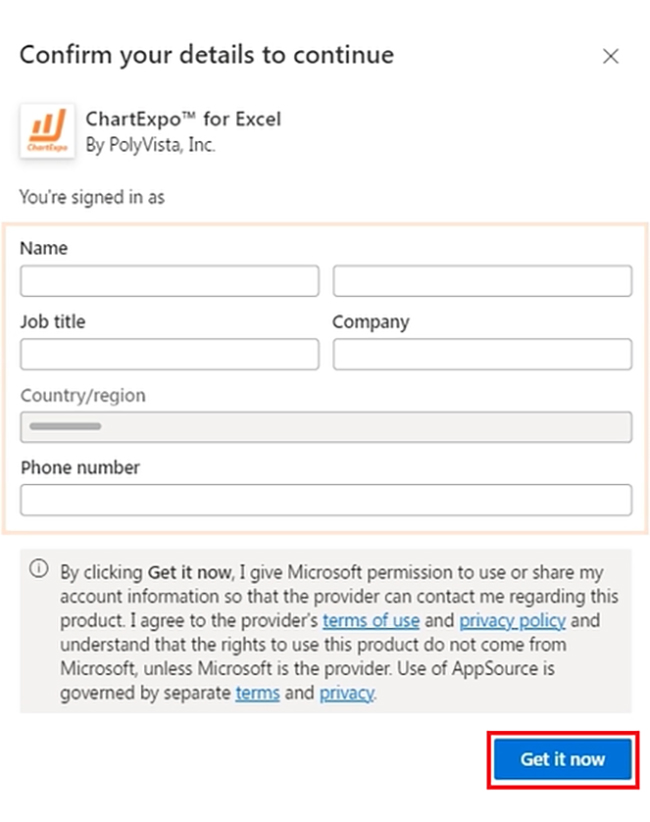
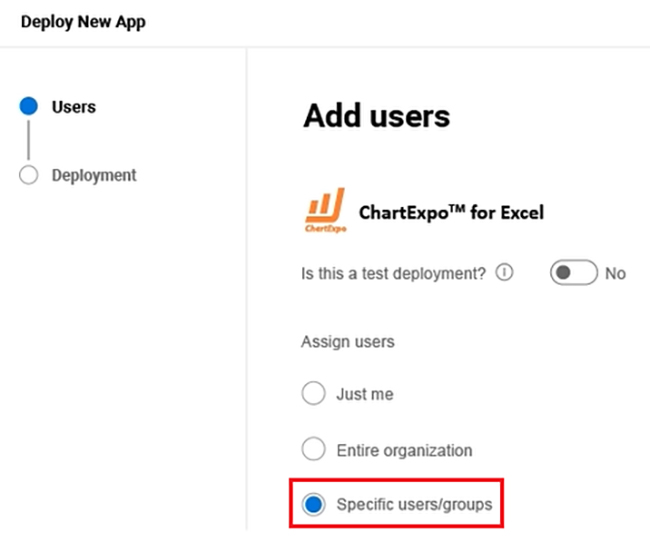
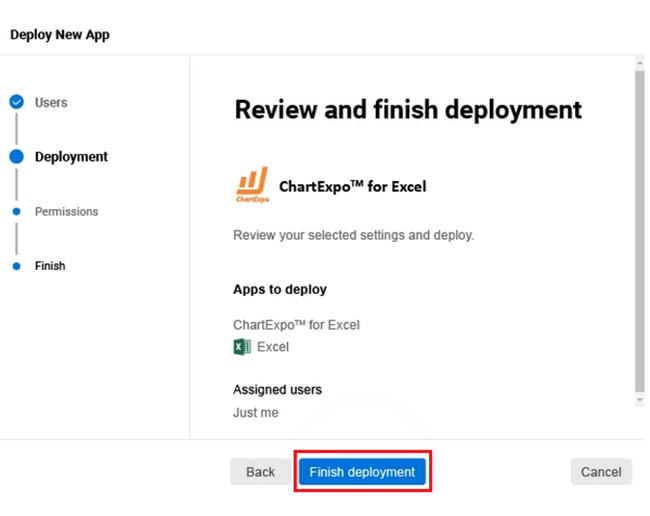
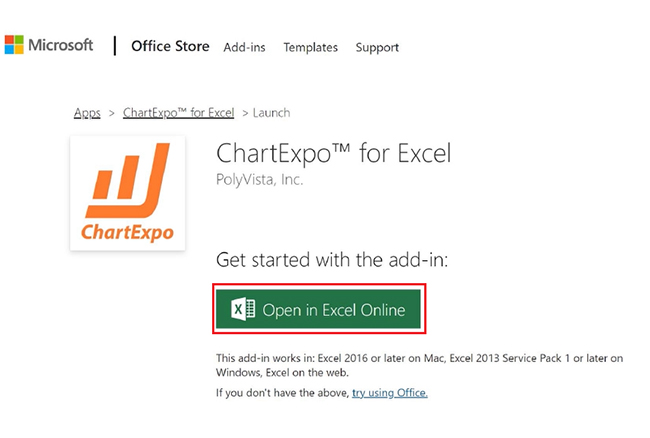
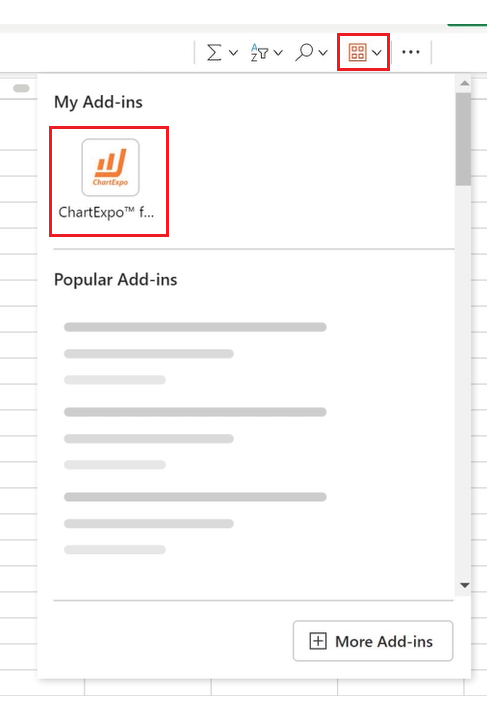
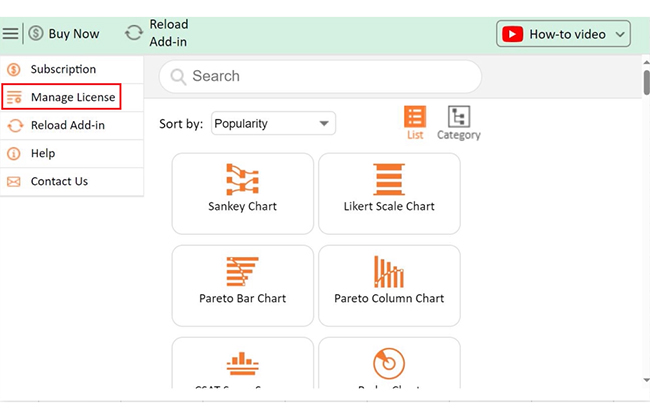
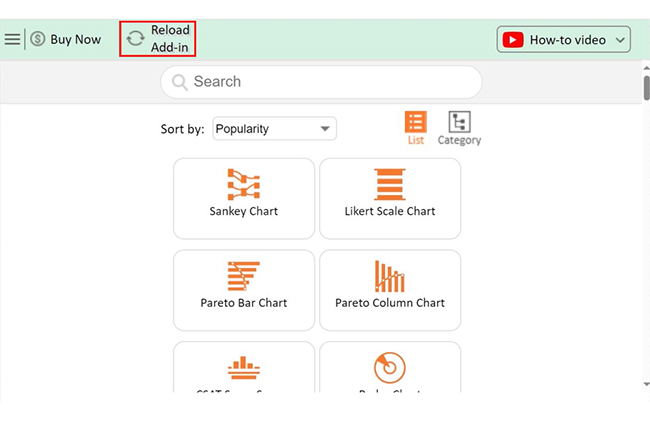
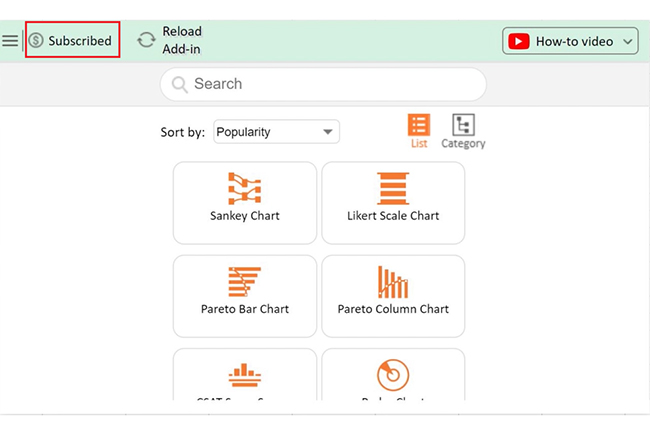
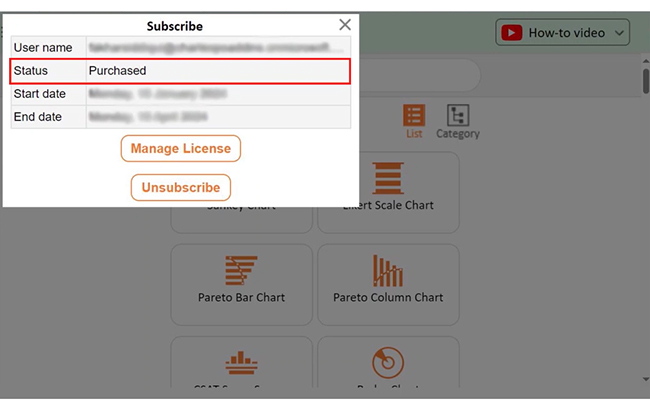
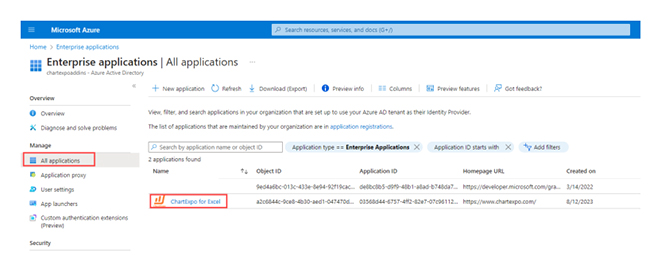
This video link explains how to install the ChartExpo add-in for Excel directly from the MS 365 Admin Center:

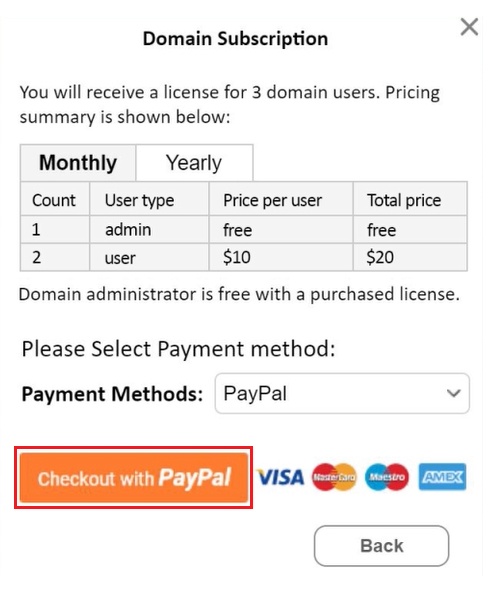
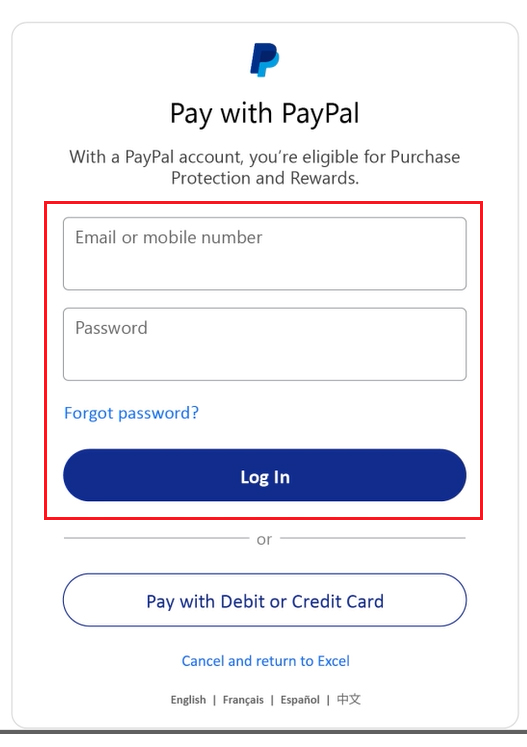
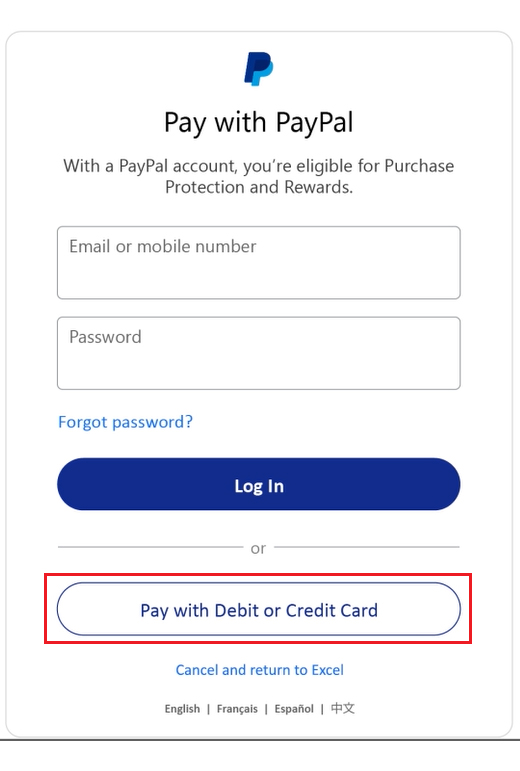
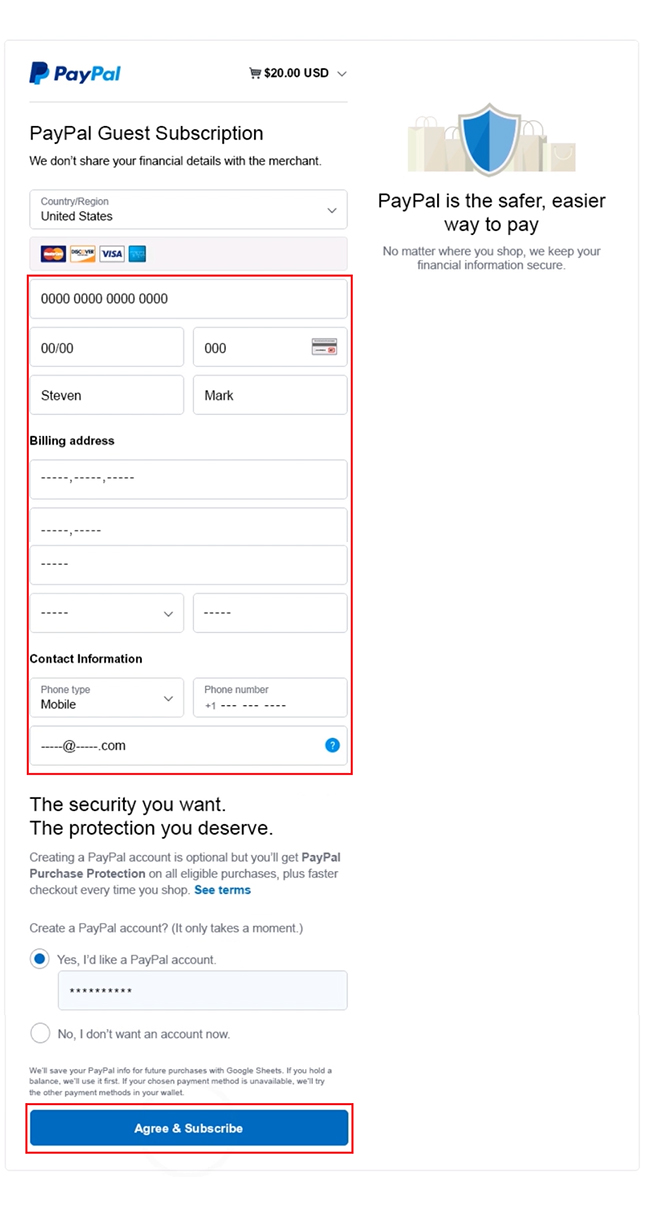
PDF with Visual Instructions: For a step-by-step guide, we have a PDF complete with images.

How to Deploy ChartExpo for Excel in the Office 365 Admin Center?

  • Log into the Office 365 Admin Center.
ChartExpo For Office 365 Admin
  • Visit Microsoft AppSource to install ChartExpo for Excel.
  • Type “ChartExpo” in the search bar to find the add-in.
ChartExpo For Office 365 Admin 1
  • Click the “Get it now” button to begin installation.
ChartExpo For Office 365 Admin 2
  • A dialog will prompt you to provide your information. Click “Get it now” again to proceed.
ChartExpo For Office 365 Admin 3
  • Assign users or groups: Select which users or groups in your organization can access ChartExpo for Excel.
ChartExpo For Office 365 Admin 4
  • Click “Finish deployment” to finalize the installation.
ChartExpo For Office 365 Admin 5
  • After deployment, ChartExpo will appear in the apps list. Click “Open in Excel Online” to access it.
ChartExpo For Office 365 Admin 6

How to Set Up Domain Users for ChartExpo for Excel?

  • Once installed, go to “My Add-ins” and select the ChartExpo add-in.
ChartExpo For Domain User
  • Click on the ChartExpo add-in to load it into your worksheet. Then, click the “Menu” icon.
ChartExpo For Domain User 1
  • Choose “Manage License” to set up domain users. Enter your domain name; the domain admin will be added automatically.
ChartExpo For Domain User 2
  • Add more Microsoft-enabled users by entering their valid email addresses.
  • Click “Add” to confirm.
ChartExpo For Domain User 3
  • Click “Buy Now” to select your subscription plan: Monthly or Yearly. Here, you can review the pricing summary (Note: Admin user is free).
ChartExpo For Domain User 4
  • Select payment method: Choose PayPal, Google Pay, or Credit Card.
ChartExpo For Domain User 5
  • In this example, we’ll proceed with payment by clicking “Checkout with PayPal”.
ChartExpo For Domain User 6
  • Log in to your PayPal account and proceed to the checkout page.
ChartExpo For Domain User 7
  • You can proceed with guest checkout if you don’t have a PayPal account.
  • Select the “Pay with Debit or Credit Card” option.
ChartExpo For Domain User 8
  • Fill in the necessary details and click the “Agree & Subscribe” button.
ChartExpo For Domain User 9
  • After completing the payment, reload or refresh the ChartExpo add-in. This step is essential, so don’t skip it.
ChartExpo For Domain User 10
  • Once the subscription is successful, you’re all set to use the ChartExpo for Excel add-in.
ChartExpo For Domain User 11
  • Click the “Subscribed” button, and a dialog showing the “Purchased” status will appear.
ChartExpo For Domain User 12

Steps to Use ChartExpo Seamlessly:

  • Log in to your Azure portal with your global admin credentials.
  • Assign Permissions for ChartExpo in Microsoft Azure:
    • Log into your organization’s Azure Active Directory portal to verify successful authentication.
    • Go to the “Enterprise Applications” section.
    • ChartExpo should now appear as an available application.
Use ChartExpo
  • Grant ChartExpo access to specific users:
    • Select the ChartExpo app.
    • Go to “Users and Groups” to assign permissions.
    • Add users or groups who will be using ChartExpo. These users will be able to access the app without issues. You can add users individually or in groups from the directory.
Use ChartExpo 1
Use ChartExpo 2

How to Create Reports in Microsoft 365 Admin Center?

Analyzing reports in Excel can feel like solving a puzzle with missing pieces. Sure, Excel is great for crunching numbers, but its default charts often leave much to be desired.

Visual analytics is key to understanding data, yet Excel’s limitations can make storytelling with data a challenge. That’s where ChartExpo steps in. With its custom Excel charts, you can turn bland spreadsheets into dynamic visuals, unlocking insights like never before.

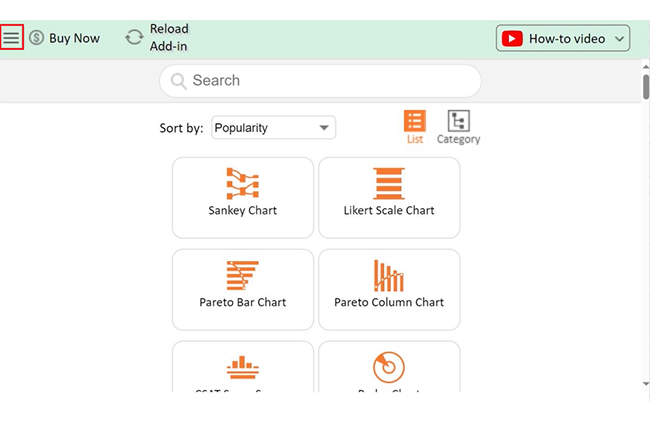
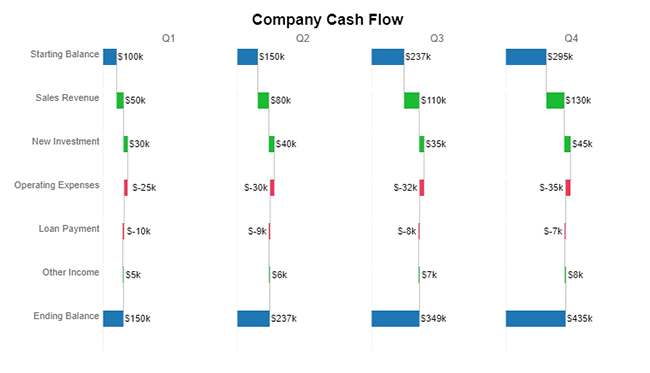
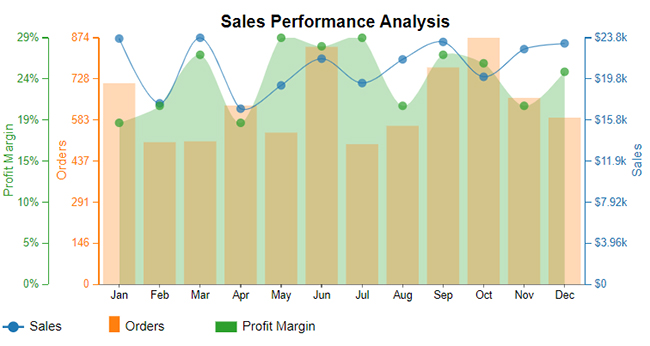
Below are some of the types of charts and graphs you can create in Excel using ChartExpo.

Sankey Chart:

Sankey Chart CE745

Likert Scale Chart:

Likert Scale Chart CE745

Comparison Bar Chart:

Comparison Bar Chart CE745

Stacked Waterfall Chart:

Stacked Waterfall Chart CE745

Horizontal Waterfall Chart:

Horizontal Waterfall Chart CE745

Multi-Axis Line Chart:

Multi-Axis Line Chart CE745

Mosaic Plot:

Mosaic Plot CE745

Clustered Stacked Bar Chart:

Clustered Stacked Bar Chart CE745

Gauge Chart:

Gauge Chart CE745

Progress Circle Chart:

Progress Circle Chart CE745

How to Install ChartExpo in Excel?

  1. Open your Excel application.
  2. Open the worksheet and click the “Insert” menu.
  3. You’ll see the “My Apps” option.
  4. In the Office Add-ins window, click “Store” and search for ChartExpo on my Apps Store.
  5. Click the “Add” button to install ChartExpo in your Excel.

ChartExpo charts are available both in Google Sheets and Microsoft Excel. Please use the following CTAs to install the tool of your choice and create beautiful visualizations with a few clicks in your favorite tool.

Example

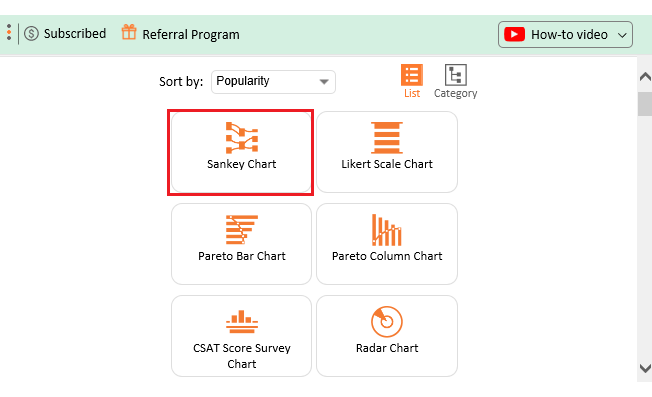
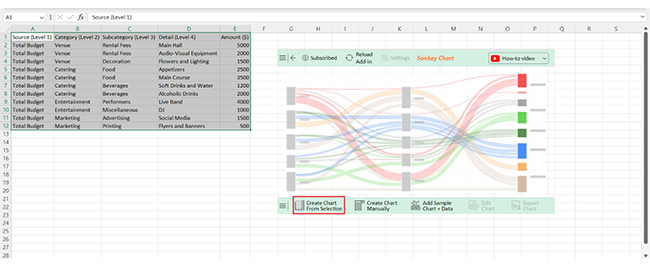
Let’s use ChartExpo to create a chart in Excel from the sample data below and glean valuable insights.

Source (Level 1) Category (Level 2) Subcategory (Level 3) Detail (Level 4) Amount ($)
Total Budget Venue Rental Fees Main Hall 5000
Total Budget Venue Rental Fees Audio-Visual Equipment 2000
Total Budget Venue Decoration Flowers and Lighting 1500
Total Budget Catering Food Appetizers 2500
Total Budget Catering Food Main Course 3500
Total Budget Catering Beverages Soft Drinks and Water 1200
Total Budget Catering Beverages Alcoholic Drinks 2000
Total Budget Entertainment Performers Live Band 4000
Total Budget Entertainment Miscellaneous DJ 1000
Total Budget Marketing Advertising Social Media 1500
Total Budget Marketing Printing Flyers and Banners 500
  • To get started with ChartExpo, install ChartExpo in Excel.
  • Now Click on My Apps from the INSERT menu.
insert chartexpo in excel
  • Choose ChartExpo from My Apps, then click Insert.
open chartexpo in excel
  • Once it loads, choose the “Sankey Chart” from the charts list.
search sankey chart in excel
  • Click the “Create Chart From Selection” button after selecting the data from the sheet, as shown.
Create Chart From Selection ce745
  • ChartExpo will generate the visualization below for you.
Generate the Visualization ce745
  • If you want to have the chart’s title, click Edit Chart, as shown in the above image.
  • Click the pencil icon next to the Chart Header to change the title.
  • It will open the properties dialog. Under the Text section, you can add a heading in Line 1 and enable Show.
  • Give the appropriate title of your chart and click the Apply button.
Apply Tittle on Chart ce745
  • You can disable the percentage sign on the values as follows:
Disable the Percentage Sign ce745
  • You can add the dollar sign with all values as follows:
Add the Dollar Sign ce745
  • You can hide the Parentheses as follows:
Hide the Parentheses ce745
  • You can add the colors of all Nodes and change the direction as follows:
Add the Colors of Nodes ce745
  • You can disable the Footer label as follows:
Disable the Footer Label ce745
  • Click the “Save Changes” button to persist the changes.
Save Changes ce745
  • Your final chart will appear below.
Final MS 365 Admin Center

Insights

  • Venue and Entertainment: $7,000 allocated for rental fees and performers.
  • Catering: $9,200 dedicated to food and beverages.
  • Marketing: $2,000 set aside, reflecting less focus on promotional efforts than other event aspects.

FAQs

How do I get to the Office 365 admin center?

To access the Office 365 Admin Center:

  • Go to admin.microsoft.com.
  • Log in using your admin credentials.
  • Once logged in, you’ll be directed to the Admin Center dashboard. You can manage users, settings, and other Office 365 features from there.

How do I find the admin account on Microsoft 365?

To find the admin account on Microsoft 365:

  • Go to admin.microsoft.com and log in with your account.
  • You’ll be directed to the Admin Center if you have admin privileges. If not, contact your organization’s administrator to gain access.

How do I give access to the Microsoft 365 admin center?

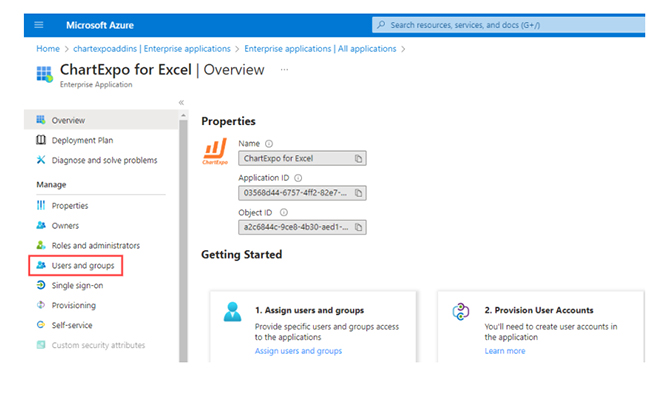
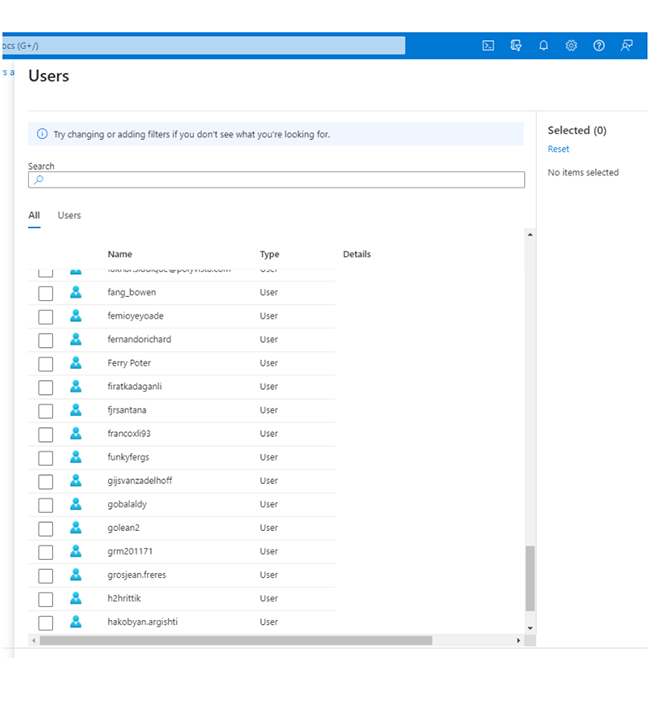
To give access to the Microsoft 365 Admin Center:

  • Log in to admin.microsoft.com.
  • Go to Users and select the user.
  • Under Roles, assign the Global Admin
  • Save changes.
  • The user will now have access to the Admin Center.

Wrap Up

The Microsoft 365 Admin Center is a centralized platform that simplifies managing your Microsoft 365 environment. It helps you easily oversee user accounts, security, and service performance.

One of the key features is its ability to monitor and manage service health. You can track service performance and receive updates about potential issues. This is especially important in industries like healthcare analytics, where downtime can significantly affect operations.

With robust reporting tools, the Admin Center turns raw data into clear, actionable insights. Data visualization plays a key role here. It helps you quickly analyze usage, performance, and security data through intuitive, insightful charts and graphs.

Managing licenses and subscriptions is also simplified. You can easily view and assign licenses to users, ensuring everyone has access. This efficiency helps you control costs and stay organized.

Collaboration is also streamlined, with tools to manage devices and applications across your organization. The Admin Center ensures smooth operations, making it a critical tool for any business.

For even better data analysis and visualization, install ChartExpo for Excel. This will empower you to take your data analytics to new heights with powerful charts.

How much did you enjoy this article?

ExcelAd1
Start Free Trial!
147177

Related articles

next previous
Microsoft Excel10 min read

Compound Interest in Excel for Smarter Reporting

Discover compound interest in Excel and how it works. Learn its formulas, calculation tips, and common errors to avoid for more accurate financial analysis.

Microsoft Excel9 min read

KPI Dashboard in Excel: A Complete Guide

A KPI dashboard in Excel helps track key metrics and streamline data visualization. Discover how to create, analyze, and use it with clear guides and examples.

Microsoft Excel11 min read

How to Plot a Speedometer Chart in Excel?

Create a Speedometer Chart in Excel to track KPIs, goals, and performance metrics visually. Explore templates, examples, and step-by-step instructions for better dashboards.

Microsoft Excel13 min read

Excel for Teachers for Insightful Preparation

Excel for teachers simplifies grading, tracks attendance, and organizes data. Find its key features, expert tips, and how ChartExpo enhances data visualization.

Microsoft Excel14 min read

How to Make a Cash Flow Diagram in Excel?

Learn how to make a Cash Flow Diagram in Excel. It will help you learn to visualize and analyze inflows and outflows of your business cash flow.

ChartExpo logo

Turn Data into Visual
Stories

CHARTEXPO

  • Home
  • Gallery
  • Videos
  • Services
  • Pricing
  • Contact us
  • FAQs
  • Privacy policy
  • Terms of Service
  • Sitemap

TOOLS

  • ChartExpo for Google Sheets
  • ChartExpo for Microsoft Excel
  • Power BI Custom Visuals by ChartExpo
  • Word Cloud

CATEGORIES

  • Bar Charts
  • Circle Graphs
  • Column Charts
  • Combo Charts
  • Comparison Charts
  • Line Graphs
  • PPC Charts
  • Sentiment Analysis Charts
  • Survey Charts

TOP CHARTS

  • Sankey Diagram
  • Likert Scale Chart
  • Comparison Bar Chart
  • Pareto Chart
  • Funnel Chart
  • Gauge Chart
  • Radar Chart
  • Radial Bar Chart
  • Sunburst Chart
  • see more
  • Scatter Plot Chart
  • CSAT Survey Bar Chart
  • CSAT Survey Chart
  • Dot Plot Chart
  • Double Bar Graph
  • Matrix Chart
  • Multi Axis Line Chart
  • Overlapping Bar Chart
  • Control Chart
  • Slope Chart
  • Clustered Bar Chart
  • Clustered Column Chart
  • Box and Whisker Plot
  • Tornado Chart
  • Waterfall Chart
  • Word Cloud
  • see less

RESOURCES

  • Blog
  • Resources
  • YouTube
SIGN UP FOR UPDATES

We wouldn't dream of spamming you or selling your info.

© 2025 ChartExpo, all rights reserved.