Categories
Recently, tennis superstar Naomi Osaka forfeited the prestigious French Open, citing mental health issues.


This news underscores the significance of improving mental health in your business.
According to One Mind Institute, 25% of employees experience one mental health condition in their lifetime.
Obviously, your staff’s mental health is a critical component of productivity.
Burnout due to changing working conditions can easily take a massive toll on your employees. And this calls for data collection to design programs for combating this workplace problem.
So, how do you gather data to design or optimize your mental health program?
This is where survey-oriented charts, such as Likert Scale Chart, come in.
Likert Chart can help you to measure sentiments, attitudes, and opinions. The survey-oriented chart goes beyond the simple “yes & no” survey questions.
Microsoft Excel lacks Likert Scale Charts for visualizing mental health survey data.
We’re not advising you to do away with the Excel spreadsheet.
Install a particular add-in in your Excel to access ready-made Likert Scale Charts.
Before jumping into the how-to guide, we’ll address the following question: what is a mental health survey?
Definition: You can use a mental health survey to collect data related to the mental health of your team.

Mental health survey was never a big issue a decade ago.
Yes, until some employees started indulging in addictive and fatal behaviors, such as heavy drinking, to cope with life.
Most businesses acknowledge the need for a healthy employee in all spectrums, including the mental state.
Mental health support went from a nice-to-have to a must-have initiative at the height of the pandemic in 2020.
Fast forward to this year.
The stakes have been raised even higher. We’re seeing massive changes in mental health initiatives, particularly as businesses begin to adopt psychographic segmentation to better understand employee needs.
Thanks to an elevated awareness of the workplace factors that can contribute to poor mental health, companies are recognizing that tailored approaches can lead to more effective support.
Although some businesses have responded with initiatives like enhanced counseling, four-day workweeks, or setting up mental health days or weeks, these measures alone are not enough.
Yes, the American Psychologists Association (APA) believes that these initiatives are not enough.
“You can simply offer the latest apps or employ euphemisms like well-being” or mental fitness, and expect immediate results, says APA.
The psychologist-led organization recommends employers connect what they say to what they do in mental health matters.
Besides, the American Psychologists Association (APA) recommends data-driven strategies, such as organizing surveys.
Since initiatives, like employee satisfaction surveys, are already happening in most businesses, we recommend replicating the same model.
Why?
The collected responses can be analyzed using charts and graphs to visualize employee satisfaction data.
Depending on your objective goal, mental health survey questions can be long or short. These questions provide a standardized framework for measuring and tracking mental health data points.
One of the charts we recommend you use to visualize mental health survey questions is the Likert Scale Chart.
Keep reading to discover why we recommend the Likert Scale Chart.
In the coming section, we’ll address the following question: why do you need a mental health survey?
Mental health surveys can help your business rejuvenate its workplace culture to attract and retain highly skilled employees.
Also, you can easily gain insights into factors that contribute to productivity, such as positive mental health. Essentially, you can easily learn the deep issues inhibiting your team from unlocking their full potential, often supported through tools like healthcare dashboard examples that help visualize employee wellbeing trends clearly.
Remember, our brains are the engine of everything we do.
To perform at very high levels, we need a positive mind.
Yes, a state of mind that’s calm and positive. A negative mind is a disaster for any business.
The likelihood of quarrels, miscommunications, and intense workplace politics is high in such a tense environment.
Thirdly, mental health survey questions can help you reduce employee turnover, which is costly in the long term.
When you retain your team, you retain investment, skills, and a shared purpose.
Let’s assume you intend to put together mental health survey questions. How will you frame your questions?
Your staff is the backbone of your business.
So, it’s in your business interest to investigate their needs (mental and psychological needs).
Remember, the right questions can provide you insight into your employees’ well-being and promote mental health initiatives.
These mental health surveys are a type of surveys that also help you:
To get a crystal clear sense of the questions, check out some examples below.
Let’s dive in.
How do you steer the conversation once you’ve opened with the following question: “How are you feeling?”
Some of these questions can help you to screen your employees for distress.
We recommend you tweak some of these mental health survey questions to make them more relevant to your situation.
These questions primarily probe potential signs of anxiety and depression.
So, you’re likely to get insights into the indicators of well-being, such as life satisfaction and happiness.
We recommend you incorporate open-ended questions to encourage conversations about mental health.
Some of the indicators of poor mental health well-being to check out for include:
Let’s dive in.
Create questions to probe the following indicators, such as restlessness, sleep, pain, agitation, etc.
Some of the questions you can use include:
Here, create questions for probing feelings of anxiety, distress, motivation, and energy.
The absence of negative feelings correlates with a higher perceived quality of life.
Check out the examples below.
Create questions that investigate the elements that contribute to a higher quality of life, such as pride, dignity, and privacy.
Check out the examples below.
Create questions that probe your employees’ confidence and self-esteem.
For instance:
Create questions that investigate the elements associated with dreams, goals, and fears.
Check out the examples below.
Create questions that probe how employees perceive they ‘fit in’ with your team and the larger society.
Some examples include:
In the coming section, we’ll address the following question: how do you create a mental health survey visualization?
Microsoft Excel is one of the spreadsheet applications you can use to store, organize, and analyze survey results in Excel.
However, it lacks visualizations designed purposely to visualize mental health survey question data, such as the Likert Scale Chart.
We’re not advising you to do away with Excel. In fact, with self-service analytics capabilities, you can easily enhance Excel to meet your needs.
You can easily install an add-on in your Microsoft Excel to access survey-based visualizations, such as the Likert Scale Chart.
The application is called ChartExpo.
What is ChartExpo?
ChartExpo is an add-in you can easily install in your Excel to access charts for visualizing mental health survey questions.


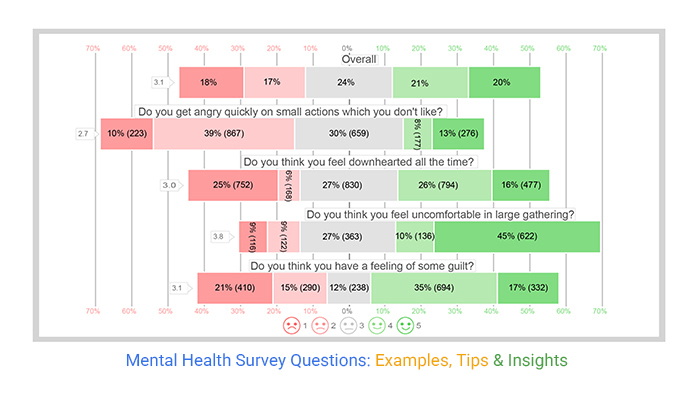
This section will use a Likert Chart to visualize the mental health survey responses below.
| Questions | Scale | Responses |
| Do you get angry quickly on small actions which you don’t like? | 1 | 223 |
| Do you get angry quickly on small actions which you don’t like? | 2 | 867 |
| Do you get angry quickly on small actions which you don’t like? | 3 | 659 |
| Do you get angry quickly on small actions which you don’t like? | 4 | 177 |
| Do you get angry quickly on small actions which you don’t like? | 5 | 276 |
| Do you think you feel downhearted all the time? | 1 | 752 |
| Do you think you feel downhearted all the time? | 2 | 168 |
| Do you think you feel downhearted all the time? | 3 | 830 |
| Do you think you feel downhearted all the time? | 4 | 794 |
| Do you think you feel downhearted all the time? | 5 | 477 |
| Do you think you feel uncomfortable in large gathering? | 1 | 116 |
| Do you think you feel uncomfortable in large gathering? | 2 | 122 |
| Do you think you feel uncomfortable in large gathering? | 3 | 363 |
| Do you think you feel uncomfortable in large gathering? | 4 | 136 |
| Do you think you feel uncomfortable in large gathering? | 5 | 622 |
| Do you think you have a feeling of some guilt? | 1 | 410 |
| Do you think you have a feeling of some guilt? | 2 | 290 |
| Do you think you have a feeling of some guilt? | 3 | 238 |
| Do you think you have a feeling of some guilt? | 4 | 694 |
| Do you think you have a feeling of some guilt? | 5 | 332 |
To get started with ChartExpo in Excel, follow the steps below:


In these mental health survey questions, you may notice that if someone disagrees it means their mental health is good but according to the chart it will be highlighted with red color and if they agree it means their mental health is not good but according to the chart it will be highlighted with green color.


Mental health surveys can help your business rejuvenate its workplace culture to attract and retain highly skilled employees.
Also, you can easily gain insights into factors that contribute to productivity, such as positive mental health. In others, you can easily learn the deep issues inhibiting your team from unlocking their full potential.
American Psychologists Association (APA) recommends you adopt data-driven strategies, such as organizing mental health surveys.
The responses collected can be analyzed using charts and graphs, such as Likert Scale Chart.
Depending on your objective goal, mental health survey questions can be long or short.
These questions provide a standardized framework for measuring and tracking mental health data points.
According to One Mind Institute, 25% of employees experience one mental health condition in their lifetime.
Mental health is a critical component of productivity.
Burnout due to changing working conditions takes a massive toll on your employees. And this calls for data collection to design a program for combating mental health problems.
So, how do you gather data to optimize your mental health program?
This is where survey-oriented charts, such as the Likert Scale Chart, come in.
Likert Chart can help you to measure sentiments, attitudes, and opinions. And this is because the visualization goes beyond the simple “yes & no” survey questions.
Microsoft Excel lacks Likert Scale Charts for visualizing mental health survey data.
We’re not advising you to do away with the Excel spreadsheet.
We recommend you install third-party apps, such as ChartExpo, to access mental health survey graphs, such as the Likert Scale Chart.
How much did you enjoy this article?


Google Forms to Google Sheets keeps your data organized and current with every submission. Learn the steps, methods, and tips now!

Product survey questions reveal what customers truly think. Learn how to ask the right ones and act on the survey results. Read on!

Learn how the 5-Point Performance Rating Scale improves employee evaluations with clear, consistent, and fair performance reviews across teams.


