Categories
KPIs for call centers are essential for the growth of your call center operations. If you are looking to increase customer satisfaction. Or improve your call center service delivery, you will need to understand these KPIs.


What do call center KPIs entail, and what is their significance? This guide will help you comprehend call center key performance indicators. We will help you leverage data-based strategies to improve call center performance.
First, we will define call center KPIs and give examples to provide more context. Each metric, from average handling time to service level, offers different insights to monitor call center performance.
This blog post will also describe how these call center KPIs influence operational excellence. Understanding the direct correlation between call center KPIs and operational success will help you better understand their role.
Imagine what having a well-defined set of KPIs can do for your call center. It’s much more than simply measuring success.
The next question is: how exactly do you harness these KPIs for continual improvement? We will also demonstrate how to utilize KPI data to enhance process effectiveness.
Let’s begin right away without any more delay!
Definition: KPIs for call centers are measurable metrics used to assess the efficiency and performance of call center operations. They help to understand various components of call center operations. This includes agent performance, customer satisfaction, and overall operational efficiency. This, in turn, helps identify what you are doing right and what needs improvement.
FCR measures the percentage of customer issues resolved during the first contact, without the need for follow-up. A high FCR indicates efficiency and enhances customer satisfaction by minimizing repeat calls.
Divide the number of calls resolved on the first attempt by the total number of calls and multiply by 100.
AHT tracks the average time agents spend handling a call, including talking to customers, putting them on hold, and completing after-call tasks. A lower AHT can indicate efficiency, but too short might suggest rushed service.
AHT = (Total Talk Time + Hold Time + After-Call Work) ÷ Total Number of Calls.
CSAT is a direct measure of customer happiness with the service they receive. It’s often collected through surveys immediately after an interaction and is critical for evaluating overall service quality.
Calculate the percentage of customers who rate their satisfaction as “satisfied” or “very satisfied” based on survey responses.
NPS measures customer loyalty by asking how likely customers are to recommend the company to others on a scale from 0-10. It’s a key indicator of long-term customer satisfaction and business growth.
NPS = % Promoters (9-10 ratings) – % Detractors (0-6 ratings)
Service level reflects how quickly your agents can respond to customer calls, typically within a set target (e.g., 80% of calls answered within 20 seconds).
Service Level = (Calls Answered Within the Target Time ÷ Total Calls) × 100
The abandonment rate measures the percentage of callers who hang up before speaking to an agent. High abandonment rates suggest long wait times or other issues with call handling.
How to find it:
Abandonment Rate = (Number of Abandoned Calls ÷ Total Incoming Calls) × 100
Occupancy rate indicates how much of an agent’s working time is spent on handling calls and completing after-call work. A high occupancy rate shows agents are being fully utilized but might also indicate potential overwork.
Occupancy Rate = (Total Time on Calls + After-Call Work) / Total Available Time
Call volume represents the total number of inbound calls handled by your contact center within a specific period. Monitoring call volume helps in resource planning and staffing decisions.
Track the total number of incoming calls daily, weekly, or monthly using call center software.
ASA measures how quickly agents can answer incoming calls. Long answer times can frustrate customers and result in high abandonment rates, while shorter times enhance customer satisfaction.
ASA = Total Waiting Time for Answered Calls ÷ Total Number of Answered Calls.
Agent turnover rate tracks the percentage of agents leaving the contact center over a set period. High turnover rates may indicate issues like poor work culture, burnout, or dissatisfaction.
Agent Turnover Rate (%) = (Number of Agents Who Left / Average Number of Agents) × 100
This KPI measures the percentage of scheduled working hours that agents are absent. High absenteeism rates can affect staffing, service quality, and customer experience.
Absenteeism Rate = (Total Days Absent ÷ Total Working Days Scheduled) × 100
The call transfer rate indicates the percentage of calls that are transferred from one agent to another. High transfer rates might reflect a lack of proper training or routing inefficiencies.
Call Transfer Rate = (Number of Transferred Calls ÷ Total Incoming Calls) × 100
Definition: KPIs for call centers are measurable metrics and KPIs used to assess the efficiency and performance of call center operations. They help to understand various components of call center operations. This includes agent performance, customer satisfaction, and overall operational efficiency. This, in turn, helps identify what you are doing right and what needs improvement.
Common call center KPIs examples include:
Setting Key Performance Indicators (KPIs) for call centers requires careful consideration and strategic alignment with business objectives. Here are some tips to help you set call center KPI metrics effectively:
Always align your call center KPIs with the business objectives and top priorities. This will not only help prove the contact center’s value to the business. It will also give you a clear understanding of what you monitor and what is important. Therefore, ensure that resources are allocated strategically.
Be sure to align your KPIs with the unique needs and challenges of the contact center. When selecting KPIs, consider your customers’ expectations, your contact center’s requirements, and industry standards. This will ensure they provide meaningful insights into performance.
From a customer service perspective, you need to set up and monitor KPIs that influence customer satisfaction or experience. Typically, these can be metrics like First Call Resolution (FCR) and Customer Satisfaction (CSAT). Monitoring these metrics can help your contact center improve its customer service.
Use both leading and lagging indicators. While leading indicators can help you predict future improvements, lagging indicators allow you to measure your past performance. Combining these metrics will give you a comprehensive report on your contact center. For instance, you can combine metrics such as Service Level (leading) and Customer Satisfaction (lagging).
Benchmark KPIs against industry standards, best practices, peers, and competition. This will let you see where you stand in the context of performance measurement. It will enable you to see areas where you can improve or make strategic changes. Benchmarking your KPIs will also lay the foundation for you on what goals to set. And drive your ongoing improvement efforts.
Key Performance Indicators (KPIs) and metrics play distinct but complementary roles in assessing performance and driving improvement initiatives. Let’s explore the key differences between call center KPIs and call center metrics:
| Criteria | Call Center KPIs | Call Center Metrics |
| Definition | Key performance indicators that reflect critical aspects of call center performance. | Quantifiable data points are used to measure specific aspects of call center operations. |
| Focus | Focus on strategic objectives and outcomes. | Focus on operational activities and results. |
| Purpose | They are used to assess performance against organizational goals and drive improvement initiatives. | They track and analyze various aspects of call center operations, such as call volume, handling time, and customer satisfaction. |
| Examples |
|
|
| Measurement Period | Typically measured over longer periods and used to monitor trends and overall performance. | It can be measured in real time or over shorter time intervals for immediate feedback and adjustment. |
| Usefulness for Decision-Making | Provide insights into how well call center operations align with strategic objectives and drive desired outcomes. | Provide real-time feedback on day-to-day operations and enable quick adjustments to improve efficiency and effectiveness. |
Call center KPIs are benchmarks that help you monitor the service and performance of your team. This is why you need to know your KPIs and how to track them effectively. Key steps for tracking KPIs for a call center are:
Data analysis, especially when dealing with call center KPIs, resembles solving a challenging puzzle. But don’t worry. Data visualization helps to transform the raw numbers into a compelling story.
However, relying solely on Excel often leads to lackluster visuals and limited creativity. This is where ChartExpo, the remedy to Excel’s visualization shortcomings, comes into play. With ChartExpo’s data visualization capabilities, data analysis becomes an engaging adventure.
Bid farewell to mundane charts and welcome dynamic, insightful visualizations that inject life into Call Center KPI analysis.
Let’s learn how to Install ChartExpo in Excel.
ChartExpo charts are available both in Google Sheets and Microsoft Excel. Please use the following CTAs to install the tool of your choice and create beautiful visualizations with a few clicks in your favorite tool.


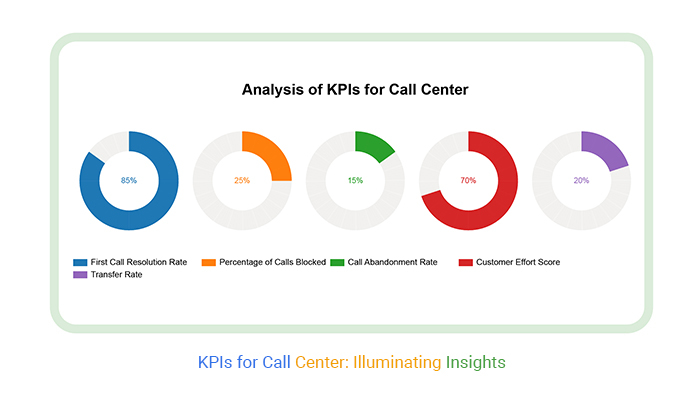
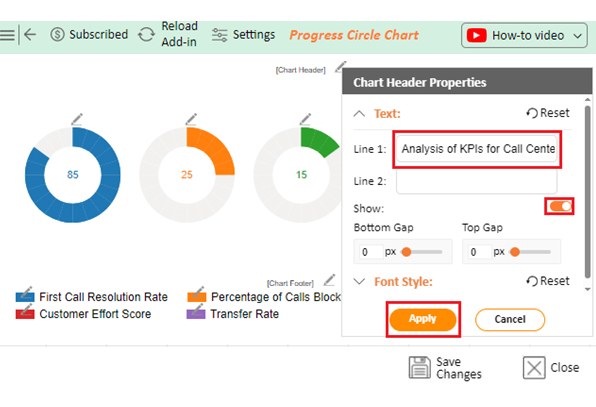
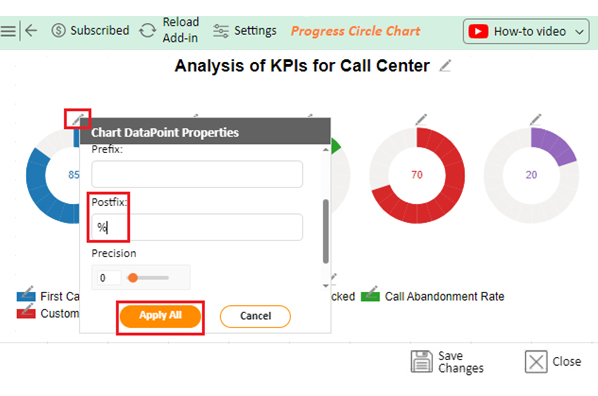
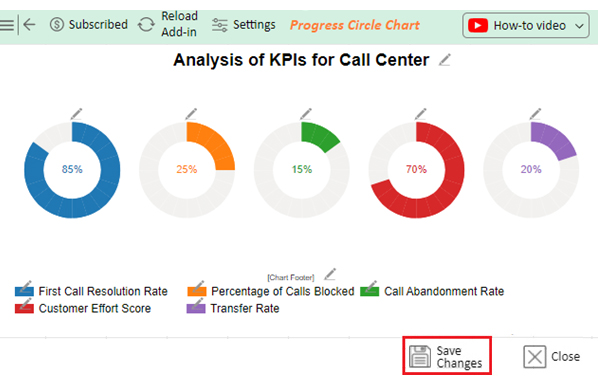
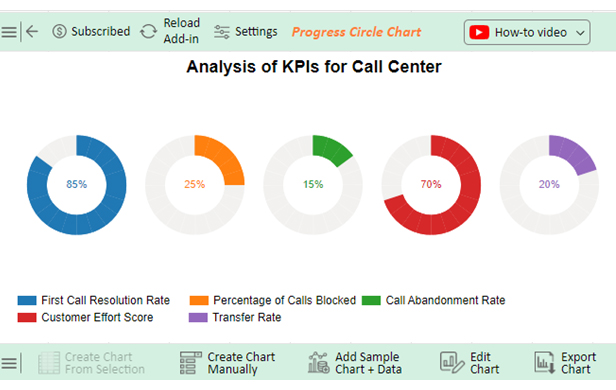
Let’s say you want to analyze the KPIs for call center data below.
| KPIs | Performance (%) |
| First Call Resolution Rate | 85 |
| Percentage of Calls Blocked | 25 |
| Call Abandonment Rate | 15 |
| Customer Effort Score | 70 |
| Transfer Rate | 20 |
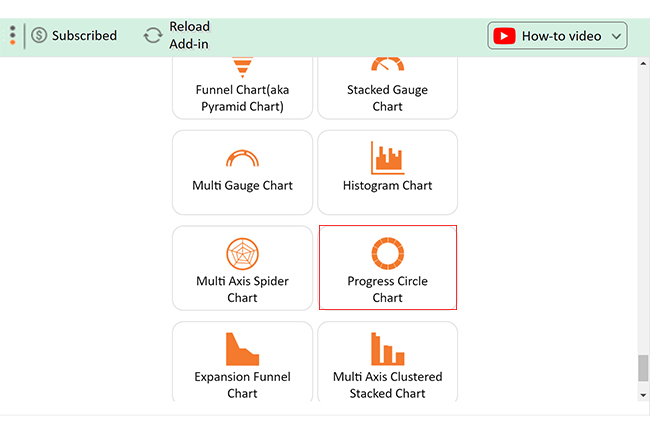
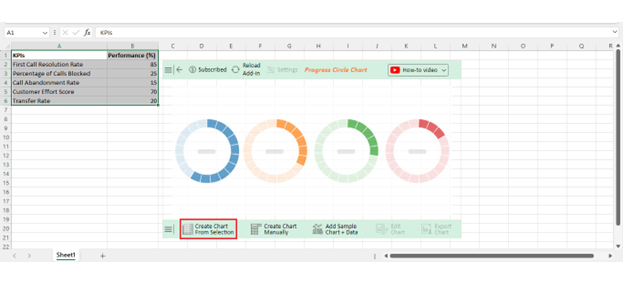
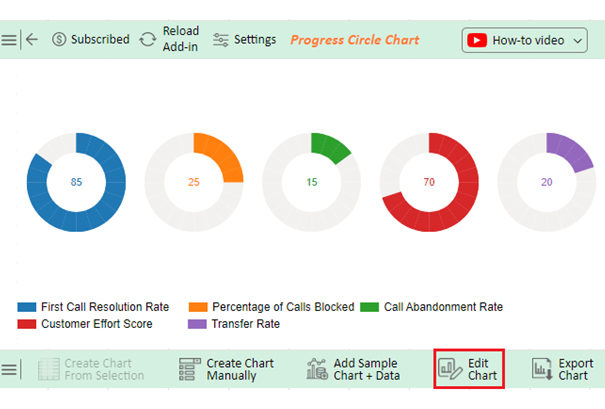
Follow these steps to visualize this data in Excel using ChartExpo and glean valuable insight.


To choose crucial KPIs for your call center, start by defining your business objectives and aligning KPIs with those goals. Understand customer expectations by analyzing feedback and selecting metrics like CSAT and FCR.
Assess operational efficiency with metrics such as Average Handle Time (AHT) and Occupancy Rate, and evaluate employee performance through KPIs like Agent Turnover Rate. Use historical data to set benchmarks and ensure that your chosen KPIs are actionable and provide clear insights for improvement.
Four commonly used KPIs in a call center are:
These metrics help assess efficiency, effectiveness, responsiveness, and customer satisfaction levels within the call center operations.
To create a KPI for a call center:
To monitor call center performance, utilize call center software and analytics tools to track call center KPIs. Such KPIs include Average Handling Time (AHT), First Call Resolution (FCR), Service Level, and Customer Satisfaction (CSAT). Regularly review performance data, identify trends, and adjust strategies as needed.
KPIs for call centers are essential metrics used to evaluate the efficiency, effectiveness, and quality of call center operations. These KPIs are benchmarks for measuring performance against organizational goals and objectives, guiding continuous improvement efforts.
Firstly, call center KPIs such as Average Handling Time (AHT) provide insights into operational efficiency and responsiveness. By monitoring these metrics, call centers can identify areas for process optimization and streamline customer interactions.
Secondly, metrics like Service Level and Customer Satisfaction (CSAT) directly impact the customer experience. Maintaining high service levels and satisfaction rates is crucial for building customer loyalty and fostering positive brand perception.
Thirdly, call center KPIs enable you to optimize resource allocation and utilization. Metrics such as Agent Utilization and Occupancy Rate help ensure staffing levels align with demand. This minimizes costs and maximizes productivity.
Furthermore, call center KPIs are a quality assurance and performance management tool. Metrics such as Quality Assurance (QA) Scores enable you to uphold service quality standards and drive continuous improvement initiatives.
Overall, by setting and monitoring appropriate KPIs, call centers can enhance operational efficiency and drive business success. Leveraging the right KPIs and monitoring performance proactively helps to deliver exceptional service experiences and achieve long-term success.
Net Promoter, NPS, NPS Prism, and many other terms related to NPS are registered trademarks of Bain & Company Inc., Satmetrix Systems Inc., and Fred Reichheld.
How much did you enjoy this article?


Calculate accounts receivable turnover ratio to measure credit collection speed, improve cash flow, and strengthen your financial strategy. Read on!

Change Management KPIs are the key to tracking adoption, performance, and ROI during transitions. Find out which metrics matter. Read on!

Data collection methods and techniques determine the quality of every insight you act on. Explore key approaches for gathering reliable data. Read on!


