• Home
  • Tools dropdown img
    • Spreadsheet Charts

      • ChartExpo for Google Sheets
      • ChartExpo for Microsoft Excel
    • Power BI Charts

      • Power BI Custom Visuals by ChartExpo
    • Word Cloud

  • Charts dropdown img
    • Chart Category

      • Bar Charts
      • Circle Graphs
      • Column Charts
      • Combo Charts
      • Comparison Charts
      • Line Graphs
      • PPC Charts
      • Sentiment Analysis Charts
      • Survey Charts
    • Chart Type

      • Box and Whisker Plot
      • Clustered Bar Chart
      • Clustered Column Chart
      • Comparison Bar Chart
      • Control Chart
      • CSAT Survey Bar Chart
      • CSAT Survey Chart
      • Dot Plot Chart
      • Double Bar Graph
      • Funnel Chart
      • Gauge Chart
      • Likert Scale Chart
      • Matrix Chart
      • Multi Axis Line Chart
      • Overlapping Bar Chart
      • Pareto Chart
      • Radar Chart
      • Radial Bar Chart
      • Sankey Diagram
      • Scatter Plot Chart
      • Slope Chart
      • Sunburst Chart
      • Tornado Chart
      • Waterfall Chart
      • Word Cloud
    • Google Sheets
      Microsoft Excel
  • Services
  • Pricing
  • Contact us
  • Blog
  • Support dropdown img
      • Gallery
      • Videos
      • Contact us
      • FAQs
      • Resources
    • Please feel free to contact us

      atsupport@chartexpo.com

Categories
All Data Visualizations Data Analytics Surveys
Add-ons/
  • Google Sheets
  • Microsoft Excel
  • Power BI
All Data Visualizations Data Analytics Surveys
Add-ons
  • Google Sheets
  • Microsoft Excel
  • Power BI

We use cookies

This website uses cookies to provide better user experience and user's session management.
By continuing visiting this website you consent the use of these cookies.

Ok

ChartExpo Survey


Home > Blog > Microsoft Excel

Mastering Art of Feedback: Free Survey Platforms Demystified

Picture yourself sitting in a room surrounded by stacks of paper. Your hand cramps as you scribble down question after question. Sweat beads on your forehead as you struggle to keep track of the responses. The clock ticks mercilessly, reminding you of the time slipping away.

Free Survey Platforms

You wish there were a way to tap into the minds of your audience without breaking the bank.

Let me surprise you. In the age of technology, there’s a better way to gather insights and opinions – free survey platforms.

With free survey platforms, you can bid farewell to the days of manual data entry and endless paperwork. These platforms offer a plethora of benefits that make your life easier, and your survey results more accurate.

First, let’s talk about the big “F” word – free. Using free survey platforms saves you the hassle and expense of investing in expensive software. It’s like getting a free lunch without having to share your dessert.

However, this is just the tip of the iceberg. Numerous benefits come with using free survey platforms.

Let’s delve into the depths of possibility and unlock the secrets that lie within. Your business’s triumph awaits.

Table of Content:

  1. What are Free Survey Platforms?
  2. Benefits of Free Survey Platforms
  3. Examination of Data Collected
  4. Wrap Up

What are Free Survey Platforms?

Free survey platforms allow individuals and organizations to create, distribute, and analyze surveys at no cost. These platforms offer user-friendly interfaces and templates, making survey creation simple. They provide online distribution options, allowing you to reach a wide audience. Basic data analysis and reporting tools are often included, making it easier to interpret responses.

The best free survey platforms include the following:

  • Google Forms

Google Forms is known for its user-friendliness and integration with Google Workspace. It offers a variety of question types, including multiple-choice, Open-Ended Questionnaires, and more. One of its significant advantages is real-time collaboration, allowing multiple users to work on a survey simultaneously. However, its free version has limitations in terms of advanced features compared to its paid counterparts.

  • SurveyMonkey

SurveyMonkey is a popular choice due to its user-friendly interface and a wide range of question types. It’s suitable for both beginners and more experienced survey creators. The free version offers basic reporting tools. However, it comes with limitations in terms of survey distribution and in-depth analytics.

  • Typeform

Typeform stands out with its visually appealing and interactive surveys. It offers various question formats and allows you to create engaging forms with conditional logic for branching questions. However, the free plan has restrictions on the number of responses and advanced features.

  • Qualtrics XM Free

Qualtrics XM Free is a robust platform with advanced features. This makes it an excellent choice for academic and research purposes. Conversely, the free version imposes restrictions on the number of surveys and responses.

  • Zoho Survey

Zoho Survey offers an easy-to-use platform with various question types and basic analytics and reporting tools. It’s a solid choice for basic surveys. However, the free version has limitations on the number of questions and responses.

  • Microsoft Forms

Integrated with Microsoft Office, Microsoft Forms is easy to use and offers basic analytics. It’s a good option for users already invested in the Microsoft ecosystem. On the flip side, it lacks some of the advanced features found in other survey platforms.

  • LimeSurvey

LimeSurvey is an open-source survey software that offers extensive customization options and advanced features. It is highly customizable, but setting it up and using it effectively may require technical knowledge.

  • SoGoSurvey

SoGoSurvey provides a range of question types, reporting options, and customization features. However, its free version has limitations on survey distribution and reporting capabilities.

  • Crowdsignal (formerly Polldaddy)

Owned by Automattic, the company behind WordPress, Crowdsignal integrates seamlessly with WordPress sites. It offers various survey types, but the free version may have limited design options and customization.

  • Formstack

Formstack is a user-friendly platform with a drag-and-drop form builder and integrations with other tools. The free plan, however, is quite limited and mainly serves as a trial for their paid offerings.

Each free online survey platform has its pros and cons. Choose wisely based on your needs and priorities. Consider the level of customization you need, the number of responses, and the complexity of your questions.

What are the Benefits of Using Free Survey Platforms?

Free survey platforms offer numerous benefits, from cost-effectiveness and accessibility to ease of use and reporting.

  1. Cost-effective: Free survey platforms eliminate the need for substantial financial investments in survey software or services. This allows individuals and organizations with limited budgets to gather valuable data and insights without incurring significant expenses.
  2. Accessibility: Free survey platforms are readily available online. This makes them accessible to a broad audience of users, regardless of geographical location or financial resources. This accessibility democratizes the process of data collection and feedback gathering.
  3. Ease of use: Most free survey platforms offer user-friendly interfaces with intuitive survey creation tools. They often include templates and guides that simplify the process. This reduces the learning curve for users with varying levels of technical expertise.
  4. Quick setup: Free survey platforms typically allow for rapid survey creation, which is beneficial when time is a critical factor. You can design and deploy surveys quickly, ensuring timely survey data collection and feedback.
  5. Data collection: Free survey platforms enable efficient data collection by providing various question types, including multiple-choice, open-ended, and rating scales. Responses are automatically recorded and can be easily exported for analysis.
  6. Flexibility: These platforms offer flexibility in survey design, allowing you to tailor surveys to your needs. Customization options include branding, question logic, and skip patterns.
  7. Wider reach: Free survey platforms offer online distribution options, allowing you to reach a global audience. This broader reach ensures the collection of diverse perspectives and insights.
  8. Time efficiency: With the convenience of online surveys, free survey platforms save time compared to traditional paper surveys. Real-time data collection and analysis tools further enhance time efficiency.
  9. Insight generation: Free survey platforms provide basic data analysis tools, helping to generate insights and draw conclusions. Charts, graphs, and summary reports assist in visualizing and understanding the results.
  10. Engagement: Interactive and engaging survey designs offered by free platforms can enhance respondent engagement. Engaged participants are more likely to provide thoughtful and accurate responses.

How to Examine Data Collected from a Free Survey Platform?

Excel, the stalwart of spreadsheets, has long been the go-to tool for handling data. Yet, it’s not without its quirks. While it can do many things, crafting appealing, insightful data visualizations isn’t always its strong suit.

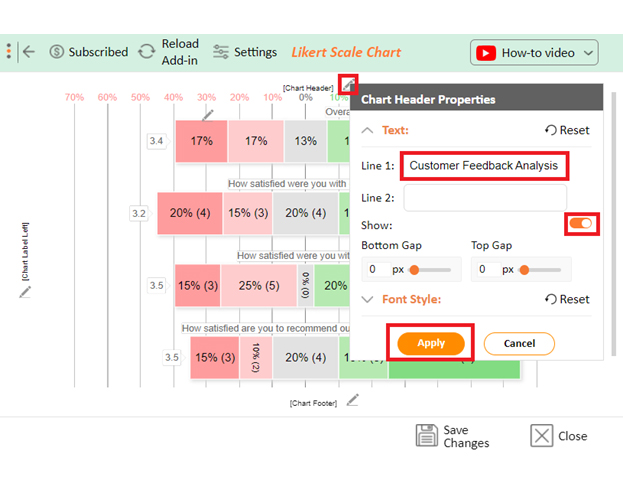
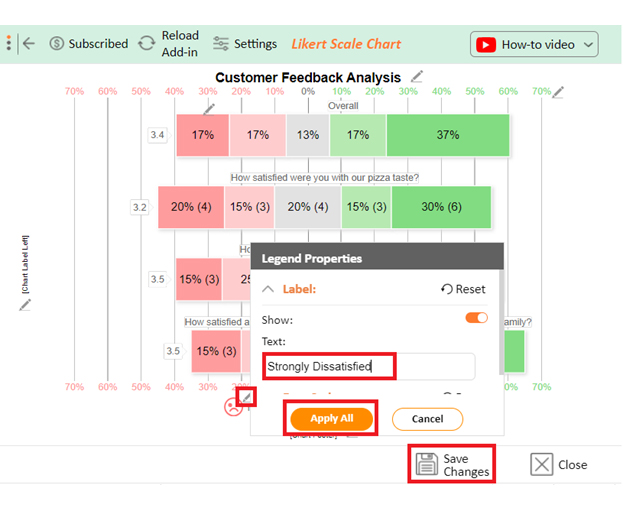
This is where ChartExpo comes into play. ChartExpo turns survey data into captivating visual narratives everyone can relate to.

Benefits of Using ChartExpo

  • ChartExpo’s array of visualizations offers you the luxury of cherry-picking the perfect one to suit your data. It turns the rather tedious task of data analysis into a breeze.
  • Navigating ChartExpo’s user-friendly interface is as effortless as a stroll in the park on a sunny day. You can whip up insightful visualizations with the finesse of a seasoned data pro. No coding is required.
  • Ever felt the need to give your charts a personal touch? ChartExpo is your artistic canvas. Customize your visuals like a painter choosing the perfect hues, fonts, and styles to match your unique taste. Your data has never looked this stylish.
  • And here’s the kicker: ChartExpo is a budget-friendly wizard. You get a taste of its magic with a free 7-day trial. And if you decide to stick around, it’s just $10 a month.

How to Install ChartExpo in Excel?

  1. Open your Excel application.
  2. Open the worksheet and click the “Insert” menu.
  3. You’ll see the “My Apps” option.
  4. In the office Add-ins window, click “Store” and search for ChartExpo on my Apps Store.
  5. Click the “Add” button to install ChartExpo in your Excel.

ChartExpo charts are available both in Google Sheets and Microsoft Excel. Please use the following CTA’s to install the tool of your choice and create beautiful visualizations in a few clicks in your favorite tool.

Example

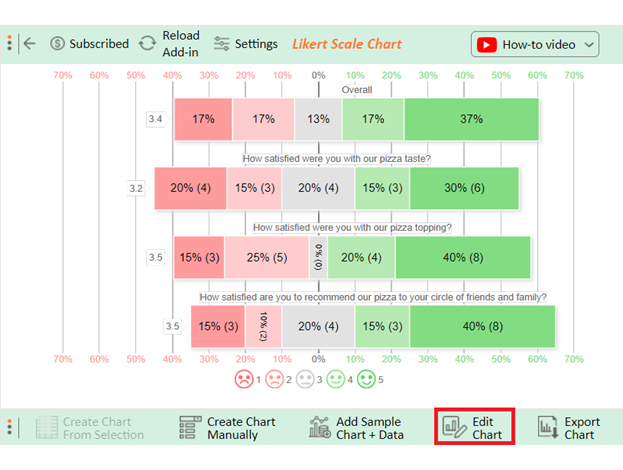
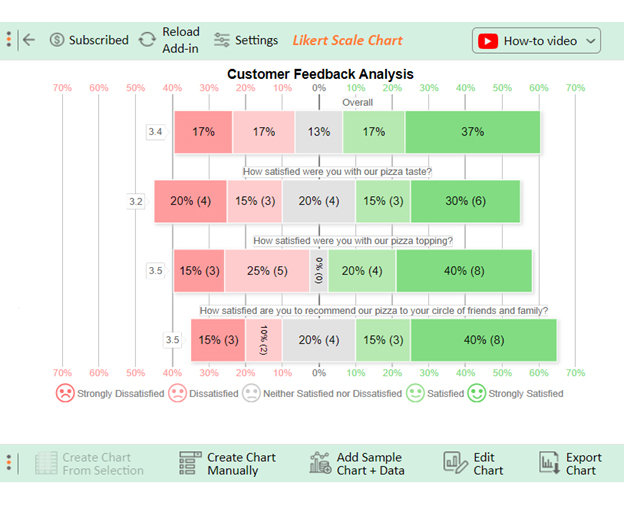
Let’s say you own a Pizza shop. You have used a free customer survey to create a customer satisfaction survey with the following questions.

  • How satisfied are you with our pizza taste?
  • How satisfied are you with the choice of pizza toppings?
  • How satisfied are you to recommend our pizza to your circle of friends and family?

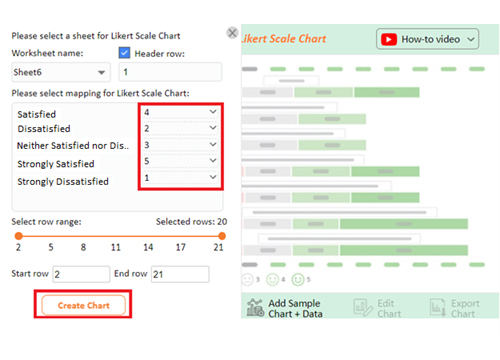
For each question, you get a response from the five responses below:

  1. Strongly Dissatisfied
  2. Dissatisfied
  3. Neither Satisfied nor Dissatisfied
  4. Satisfied
  5. Strongly Satisfied

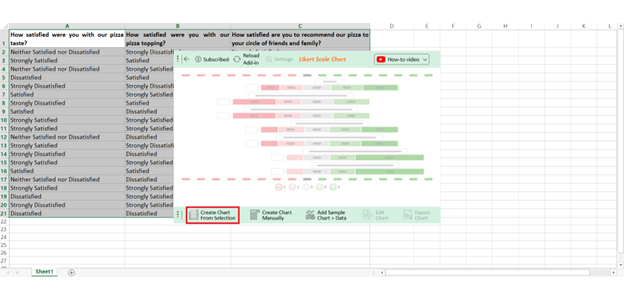
Let’s say your survey yields the data table below.

How satisfied were you with our pizza taste? How satisfied were you with the choice of pizza toppings? How satisfied are you to recommend our pizza to your circle of friends and family?
Neither Satisfied nor Dissatisfied Strongly Dissatisfied Strongly Satisfied
Strongly Satisfied Satisfied Neither Satisfied nor Dissatisfied
Neither Satisfied nor Dissatisfied Strongly Satisfied Strongly Satisfied
Dissatisfied Satisfied Neither Satisfied nor Dissatisfied
Strongly Dissatisfied Strongly Dissatisfied Dissatisfied
Satisfied Strongly Satisfied Strongly Satisfied
Strongly Dissatisfied Satisfied Satisfied
Satisfied Dissatisfied Neither Satisfied nor Dissatisfied
Strongly Satisfied Strongly Satisfied Satisfied
Strongly Satisfied Strongly Satisfied Strongly Satisfied
Neither Satisfied nor Dissatisfied Dissatisfied Strongly Dissatisfied
Strongly Satisfied Strongly Dissatisfied Strongly Satisfied
Strongly Dissatisfied Dissatisfied Neither Satisfied nor Dissatisfied
Strongly Satisfied Strongly Satisfied Strongly Satisfied
Satisfied Satisfied Satisfied
Neither Satisfied nor Dissatisfied Dissatisfied Strongly Dissatisfied
Strongly Satisfied Strongly Satisfied Strongly Satisfied
Dissatisfied Strongly Satisfied Strongly Satisfied
Strongly Dissatisfied Strongly Satisfied Dissatisfied
Dissatisfied Dissatisfied Strongly Dissatisfied

This table contains example data. Expect many responses and questions in real life.

  • To get started with ChartExpo, install ChartExpo in Excel.
  • Now Click on My Apps from the INSERT menu.
insert chartexpo in excel
  • Choose ChartExpo from My Apps, then click Insert.
open chartexpo in excel
  • Once it loads, choose the “Likert Scale Chart” from the charts list.
search likert scale chart in excel
  • Click the “Create Chart From Selection” button after selecting the data from the sheet, as shown.
Create Chart From Selection ce450
  • When you click the “Create Chart From Selection” button, you have to map responses with numbers manually. The Likert scale has this arrangement:
    • Strongly Dissatisfied = 1
    • Dissatisfied = 2
    • Neither Satisfied nor Dissatisfied = 3
    • Satisfied = 4
    • Strongly Satisfied = 5
  • Once all is set, click the “Create Chart” button.
Free Survey Platforms Design Template
  • ChartExpo will generate the visualization below for you.
Apply Tittle on Chart ce450
  • If you want to have the chart’s title, click Edit Chart, as shown in the above image.
  • Click the pencil icon next to the Chart Header to change the title.
  • It will open the properties dialog. Under the Text section, you can add a heading in Line 1 and enable Show.
  • Give the appropriate title of your chart and click the Apply button.
Apply Tittle on Chart ce450
  • Let’s say you want to add text responses instead of numbers against every emoji.
  • Click the pencil icon next to the respective emoji. Expand the “Label” properties and write the required text. Then click the “Apply All” button.
  • Click the “Save Changes” button to persist the changes.
Apply Label on Chat ce450
  • Your final chart will appear below.
Final Free Survey Platforms

Insights

  • 55% of customers are willing to recommend others, whereas 25% disagree and 20% remain neutral.
  • 60% are satisfied with the pizza topping, while 40% are dissatisfied.
  • Regarding the taste of the pizza, 45% are satisfied, 35% dissatisfied, and 20% neutral.
  • Overall, 54% of customers provided a positive response to the survey questions. 34% gave negative responses, and 13% remained neutral.

FAQs

How do you keep survey data secure?

  1. Use encryption for data transmission.
  2. Store data on secure servers.
  3. Limit access with passwords and permissions.
  4. Regularly update security measures.
  5. Educate staff on data protection.
  6. Comply with data privacy regulations.

What are the limitations of online surveys?

  1. Limited demographic reach; not all populations are online.
  2. Possible response bias.
  3. Technical issues can deter participation.
  4. May lack depth in responses compared to interviews.
  5. Limited control over respondent honesty.
  6. Data privacy concerns.

Is there a free way to create a survey?

Yes, several free survey platforms are available. Such include Google Forms, SurveyMonkey’s free plan, Typeform’s basic version, and Microsoft Forms. These tools offer basic survey creation and distribution capabilities without requiring payment.

Wrap Up

Free survey platforms offer a multitude of benefits. They are cost-effective, making them accessible to those on tight budgets. With user-friendly interfaces and quick setup, even beginners can create surveys with ease. Moreover, the accessibility of these platforms ensures a wider reach, fostering diverse responses from around the globe.

Free survey platforms save time as they expedite data collection and analysis. They empower you to generate insights, enabling informed decision-making. Furthermore, enhanced engagement keeps respondents interested and provides more accurate data.

Despite their limitations, these platforms serve as invaluable tools for gathering feedback, conducting research, and making data-driven decisions. The convenience they offer, coupled with their affordability, makes them a practical choice for various applications.

Together, free survey platforms and ChartExpo create a formidable duo. Free survey platforms gather the troops, and ChartExpo leads them into battle, translating raw data into insightful visualizations. This collaboration saves time, enhances understanding, and empowers you to make informed decisions.

How much did you enjoy this article?

ExcelAd2
Start Free Trial!
130079

Related articles

next previous
Microsoft Excel8 min read

Excel Task Tracker Template for Smarter Task Insights

Task tracker template in Excel organizes tasks, tracks deadlines, and boosts efficiency. Learn its benefits, and explore expert tips to simplify task management.

Microsoft Excel10 min read

Invoice Tracker Template in Excel for Better Insights

An invoice tracker Excel template helps track invoices, due dates, and payments. Learn how to use this template for better financial management.

Microsoft Excel12 min read

Key Performance Indicators in Healthcare for Better Insights

Key Performance Indicators in healthcare track patient care and efficiency. Learn about these KPIs, top examples, and how to use them to improve outcomes.

Microsoft Excel10 min read

BMI Calculation Formula in Excel for Better Fitness Insights

The BMI calculation formula in Excel helps track and analyze body mass index. Explore step-by-step instructions and tips to simplify BMI tracking in Excel.

Microsoft Excel29 min read

How to Create a Tornado Chart in Excel? A Complete Guide

Click to learn how to plot a Tornado Chart in Excel using easy-to-follow steps. Also, we’ll address the following question: what is a Tornado Diagram?

ChartExpo logo

Turn Data into Visual
Stories

CHARTEXPO

  • Home
  • Gallery
  • Videos
  • Services
  • Pricing
  • Contact us
  • FAQs
  • Privacy policy
  • Terms of Service
  • Sitemap

TOOLS

  • ChartExpo for Google Sheets
  • ChartExpo for Microsoft Excel
  • Power BI Custom Visuals by ChartExpo
  • Word Cloud

CATEGORIES

  • Bar Charts
  • Circle Graphs
  • Column Charts
  • Combo Charts
  • Comparison Charts
  • Line Graphs
  • PPC Charts
  • Sentiment Analysis Charts
  • Survey Charts

TOP CHARTS

  • Sankey Diagram
  • Likert Scale Chart
  • Comparison Bar Chart
  • Pareto Chart
  • Funnel Chart
  • Gauge Chart
  • Radar Chart
  • Radial Bar Chart
  • Sunburst Chart
  • see more
  • Scatter Plot Chart
  • CSAT Survey Bar Chart
  • CSAT Survey Chart
  • Dot Plot Chart
  • Double Bar Graph
  • Matrix Chart
  • Multi Axis Line Chart
  • Overlapping Bar Chart
  • Control Chart
  • Slope Chart
  • Clustered Bar Chart
  • Clustered Column Chart
  • Box and Whisker Plot
  • Tornado Chart
  • Waterfall Chart
  • Word Cloud
  • see less

RESOURCES

  • Blog
  • Resources
  • YouTube
SIGN UP FOR UPDATES

We wouldn't dream of spamming you or selling your info.

© 2025 ChartExpo, all rights reserved.