• Home
  • Tools dropdown img
    • Spreadsheet Charts

      • ChartExpo for Google Sheets
      • ChartExpo for Microsoft Excel
    • Power BI Charts

      • Power BI Custom Visuals by ChartExpo
    • Word Cloud

  • Charts dropdown img
    • Chart Category

      • Bar Charts
      • Circle Graphs
      • Column Charts
      • Combo Charts
      • Comparison Charts
      • Line Graphs
      • PPC Charts
      • Sentiment Analysis Charts
      • Survey Charts
    • Chart Type

      • Box and Whisker Plot
      • Clustered Bar Chart
      • Clustered Column Chart
      • Comparison Bar Chart
      • Control Chart
      • CSAT Survey Bar Chart
      • CSAT Survey Chart
      • Dot Plot Chart
      • Double Bar Graph
      • Funnel Chart
      • Gauge Chart
      • Likert Scale Chart
      • Matrix Chart
      • Multi Axis Line Chart
      • Overlapping Bar Chart
      • Pareto Chart
      • Radar Chart
      • Radial Bar Chart
      • Sankey Diagram
      • Scatter Plot Chart
      • Slope Chart
      • Sunburst Chart
      • Tornado Chart
      • Waterfall Chart
      • Word Cloud
    • Google Sheets
      Microsoft Excel
  • Services
  • Pricing
  • Contact us
  • Blog
  • Support dropdown img
      • Gallery
      • Videos
      • Contact us
      • FAQs
      • Resources
    • Please feel free to contact us

      atsupport@chartexpo.com

Categories
All Data Visualizations Data Analytics Surveys
Add-ons/
  • Google Sheets
  • Microsoft Excel
  • Power BI
All Data Visualizations Data Analytics Surveys
Add-ons
  • Google Sheets
  • Microsoft Excel
  • Power BI

We use cookies

This website uses cookies to provide better user experience and user's session management.
By continuing visiting this website you consent the use of these cookies.

Ok

ChartExpo Survey


Home > Blog > Microsoft Excel

How to Analyze Food Survey Questions in Excel?

A food survey is crucial to any restaurant or home cook’s customer service strategy. It gathers consumer feedback to assist you in improving and increasing customer satisfaction.

food survey questions

As a restaurant owner, you can determine your customers’ go-to orders by conducting a food survey. This way, you can choose which menu items to keep and which to eliminate.

Furthermore, it can help you learn more about the food preferences of your target audience.

Therefore, designing effective food survey questions is key.

Let’s assume you run a restaurant. You can send out a food survey to your current customers to find out;

  • What they think of the food you serve.
  • What they would like to see added to the menu.

You can adjust and add more variety to the dishes you serve from the survey results.

But how do you create effective food survey questions? This article will equip you with the necessary knowledge for conducting successful food surveys.

Table of Content:

  1. What is a Food Survey?
  2. How to Create a Food Survey Questionnaire?
  3. What is the Importance of Food Surveys?
  4. Basic Food Survey Question Examples
  5. How to Analyze Food Survey Questions in Excel?
  6. Wrap Up

What is a Food Survey?

A food survey gathers information about the food habits of an individual or a group. The questions in a food survey generally focus on the following;

  • Frequency of consumption of different types of food.
  • Preference for certain types of foods.
  • Nutritional knowledge and attitudes towards healthy eating.

You can conduct a food survey digitally or with paper forms.

The answers can provide valuable information helpful in designing and implementing nutrition and health promotion programs. Additionally, it helps companies in the food industry, restaurants, and home cooks understand their clientele better.

It can also help measure existing programs’ effectiveness or identify areas where interventions are necessary. Also, you can use the data collected through a food survey to;

  • Develop research projects.
  • Monitor trends in food consumption.
  • Inform public health policies.
  • Improve services and consumer satisfaction.

How to Create a Food Survey Questionnaire?

1. Identify Your Objectives

Knowing what you want to discover or learn is the key to crafting an effective questionnaire.

Your objectives ought to be precise and quantifiable.

Assume your objective is to understand consumer satisfaction. Your questions should ask about customers’ satisfaction levels with the quality, the service, and the price.

Additionally, you should include questions that measure customer loyalty. Such as whether customers would recommend the restaurant to others.

2. Choose the Format

You ought to choose a food survey format with care, taking into account its intended use.

  • A closed-ended survey is a good option if you need to collect quantitative data from respondents.
  • It’s ideal to use an open-ended survey to learn the motivations behind people’s responses.
  • A survey employing both methods is preferable when getting a comprehensive read on public sentiment.

3. Design the Questionnaire

Choose the right questions to ensure that your survey results are accurate and useful. Here are some tips for creating a successful food survey questionnaire;

  • Ensure the questions are clear and relevant.
  • Formulate quantifiable and precise questions.
  • Avoid using ambiguous language or leading questions.
  • Questions should be easy to answer and informative.

4. Test the Survey

It’s critical to test the questionnaire before distributing it to the respondents. Ask a few individuals to complete it and send it back. From this, you can spot any mistakes or problems with the questions. Therefore, you can make the required adjustments.

What is the Importance of Food Surveys?

For Restaurants and Food Outlets

  • Measuring Customer Satisfaction

Any business’ success depends on its ability to satisfy its customers. You can gauge your customers’ satisfaction by conducting food questionnaires. You can determine where you need to improve based on survey responses. Then implement the necessary adjustments to guarantee your clients’ satisfaction.

  • Quality Control

You can ensure the finest quality of food by conducting food surveys. You can solicit client feedback on the taste, service, and overall quality. Then, make the necessary changes to guarantee your cuisine is up to standard.

  • Market Research

Food surveys can provide restaurants with valuable market data. Through the survey, you can get feedback from your customers about the following;

    • Likes and dislikes.
    • Preferences for certain food items.
    • Opinions about the restaurant in general.

This information helps with decision-making about the menu and other aspects of the business.

  • Identifying Trends

Food surveys assist you in identifying food trends. You can see what your clients want and alter the menu accordingly. This will help you stay ahead of the competition and offer the greatest meals possible to your customers.

  • Improving Customer Service

You can enhance your customer service by conducting food surveys. You can see how your employees interact with customers. Then make the essential adjustments to guarantee your consumers receive quality service.

For Researchers and Government Agencies

  • Assessing Nutritional Status

Food surveys give vital information regarding the nutritional state of the population. They aid in identifying dietary deficits and recommending foods that provide the necessary nutrients.

  • Monitoring Dietary Intake

Food surveys assist in tracking the population’s diet intake.

The survey can provide information on the following;

    • Types of food consumed by the people.
    • Dietary habits.
    • Amount of food consumed.

This aids in identifying the dietary requirements of the populace and formulating dietary policies.

  • Identifying Risk Factors

Food surveys give information on the risk factors associated with the foods people eat. This aids in identifying any possible health hazards associated with the diet. Then take the necessary precautions to reduce the risk.

  • Determining Food Availability

Food surveys provide valuable information on food availability in different parts of the country. Effective information design in these surveys helps ensure that the data is presented and understood. Therefore, plan the distribution of food accordingly.

  • Identifying Food Trends

Food surveys offer details on local food trends. This aids researchers in learning the shifts in dietary habits. Then create plans to address the populace’s shifting nutritional requirements.

Basic Food Survey Question Examples

Here are some basic food survey question examples to get you started.

  1. How frequently do you eat at our restaurant?
  2. How likely is it that you would refer our restaurant to a friend?
  3. What kind of cuisine do you prefer?
  4. How pleased are you with the quality of the food served?
  5. What do you think about the prices of our dishes?
  6. What do you think about the variety of meals on our menu?

How to Analyze Food Survey Questions in Excel?

Excel provides powerful data analysis capabilities.

Creating visualizations such as charts and graphs is one of the ideal analysis methods you can use.

You can glean invaluable insights from these visualizations to help you improve your restaurant business.

ChartExpo for Excel is the best Excel add-in for your data analysis needs.

ChartExpo is a powerful data visualization tool that allows users to create interactive charts and graphs. Thus, it is ideal for analyzing the data from food surveys.

For instance, you can create charts displaying the number of individuals who favor certain cuisines. Or the proportion of individuals willing to pay more for organic food.

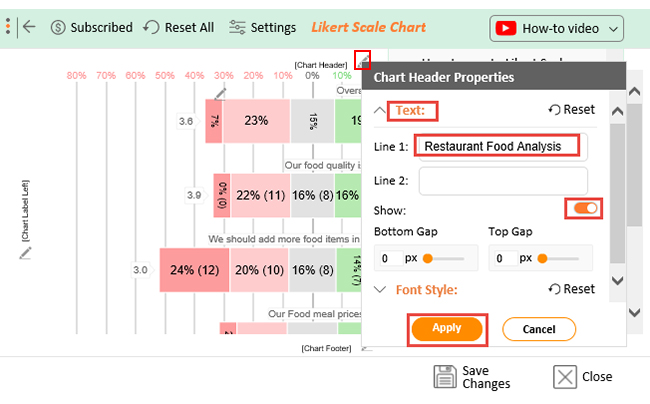
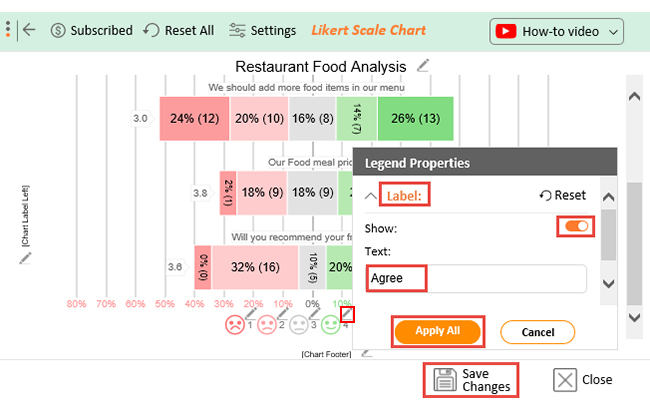
Furthermore, ChartExpo is easy to use and has customization capabilities. Therefore, you can change the properties to your liking.

Let’s learn how to Install ChartExpo in Excel.

  1. Open your Excel application.
  2. Open the worksheet and click on the “Insert” menu.
  3. You’ll see the “My Apps”.
  4. In the office Add-ins window, click on “Store” and search for ChartExpo on my Apps Store.
  5. Click on the “Add” button to install ChartExpo in your Excel.

ChartExpo charts and graphs are available both in Google Sheets and Microsoft Excel. Please use the following CTA’s to install the tool of your choice and create data visualizations in a few clicks in your favorite tool.

Example

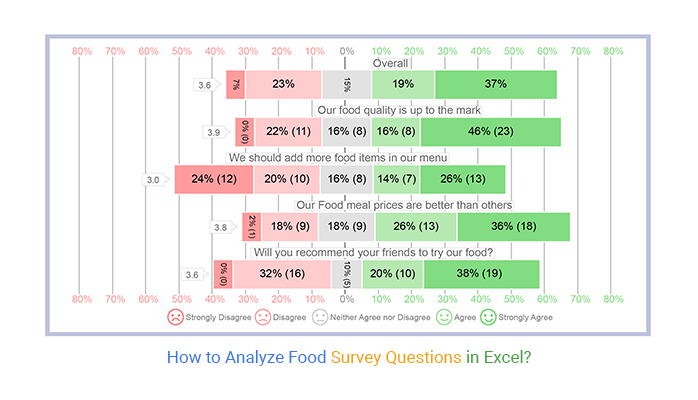
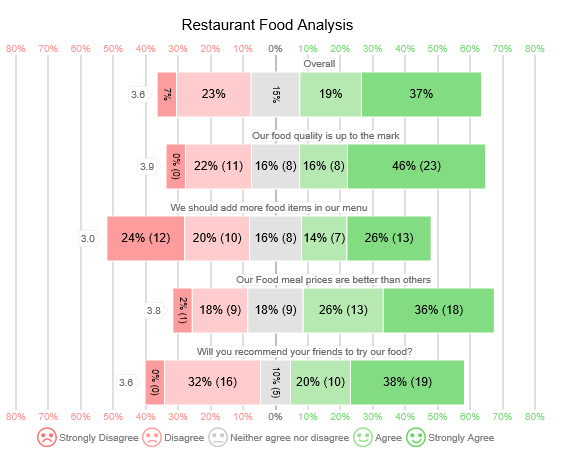
Let’s say you provide a food survey questionnaire to every customer who visits your restaurant. The questionnaire has these questions;

  1. Our food quality is up to the mark
  2. We should add more food items to our menu
  3. Our Food meal prices are better than others
  4. Will you recommend your friends to try our food?

Your customers provide an answer to each question using the scale below.

  1. Strongly Disagree
  2. Disagree
  3. Neither agree nor disagree
  4. Agree
  5. Strongly Agree

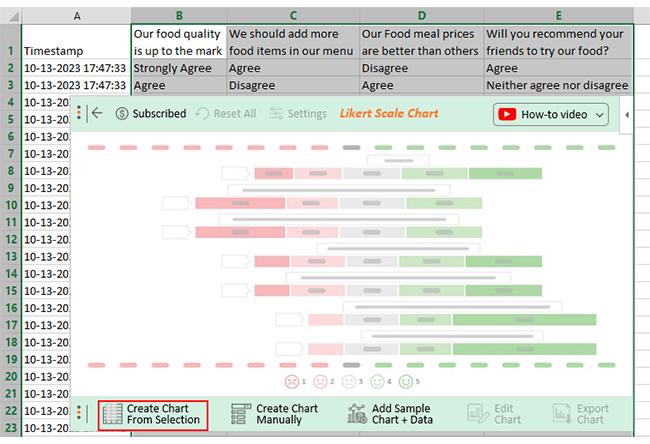
Now, it’s the end month, and you have the results on a table similar to this one.

Responses Our food quality is up to the mark


We should add more food items in our menu


Our Food meal prices are better than others


Will you recommend your friends to try our food?


Response 1 Strongly Agree


Agree


Disagree


Agree


Response 2 Agree


Disagree


Agree


Neither agree nor disagree


  • To get started with ChartExpo, install ChartExpo in Excel.
  • Now Click on My Apps from the INSERT menu.
insert chartexpo in excel
  • Choose ChartExpo from My Apps, then click Insert.
open chartexpo in excel
  • Once ChartExpo is loaded. Click on “Likert Scale Chart” from the list of charts.
search likert scale chart in excel
  • Click the “Create Chart From Selection” button after selecting the data from the sheet, as shown.
create likert scale chart in excel
  • When you click on Create Chart From Selection you have to manually map responses with numbers. The Likert scale has this arrangement:
    • Strongly Disagree = 1
    • Disagree = 2
    • Neither agree nor disagree = 3
    • Agree = 4
    • Strongly Agree = 5
  • Once all set click on Create Chart.
make likert scale chart in excel
  • The Likert Scale Chart will look as follows.
edit likert scale chart in excel
  • If you want to have the title of the chart, click on Edit Chart, as shown in the above image.
  • To change the title of the chart, click on the pencil icon that is available very next to Chart Header.
  • It will open the properties dialog. Under the Text section, you can add a heading in Line 1 and enable the Show option. Give the appropriate title of your chart and click on Apply button.
settings likert scale chart in excel
  • Let’s say you want to add text responses instead of numbers against every emoji.
  • Click on the pencil icon next to the respective emoji, expand the “Label” properties, and write the required text. After that click on the “Apply All” button.
  • For saving changes click on Save Changes. This will persist the changes.
save likert scale chart in excel
  • Your final chart will look like the as below.
likert scale chart in excel

Insights

  • 62% of customers say that food quality is good, but 22% disagree with this statement. The remaining 16% have no definite opinion.
  • 40% agree that more items should be added to the menu, while 44% disagree. The remaining 16% have no view on this matter.
  • 62% of customers approve of the prices, but 20% don’t.
  • 58% are willing to recommend the food to friends and family. On the other hand, 32% are not willing. This is not an insignificant percentage. Therefore, you should not ignore it.
  • Overall, 56% of customers responded positively to the questions, but 30% did not. And 15% remained neutral.

FAQs

What is a food survey?

A food survey gathers information on people’s food choices, preferences, and eating habits. Food outlets perform surveys to understand consumer trends and preferences better. It provides essential insight to help you meet your customers’ needs.

How do you make a food survey question?

Ensure the question is pertinent to the subject, straightforward, and brief. It should also be unbiased to avoid influencing responses. In addition, offer responders multiple-choice or checkbox answers. This makes the survey easy to answer and time-efficient.

What type of questions should I include in the survey?

The type of questions to use in a food survey depends on the survey’s objectives. For concrete responses, use closed-ended questions. In contrast, open-ended questions produce in-depth responses. For this reason, responses to open-ended questions yield rich data.

What is the purpose of a food survey?

A food survey gathers information used to gain insight into issues such as;

  • Dietary habits.
  • Nutritional needs.
  • Food preferences.

These insights help restaurants to improve their meals and meet consumer wants and needs.

Wrap Up

Creating a food survey questionnaire is an important step for any food business. You can gain insights into your customers’ food preferences and habits using food surveys. Consequently, identify customer trends and make informed decisions about your menu.

Similarly, researchers and government agencies rely heavily on food surveys to keep tabs on the nation’s eating habits. Then plan measures to encourage healthy eating.

Food surveys help in monitoring consumer attitudes toward healthy eating and nutrition. They are useful for evaluating public health initiatives’ impact and identifying potential risks.

The success of a food survey relies on the quality of the questions you ask. Questions that allow you to learn about the wants and opinions of your respondents.

Furthermore, the questions must be relevant and to the point.

With Excel, you can analyze the data from a food survey. To do so, you just need to install the ChartExpo add-in. Then you can create interactive charts and graphs to visualize your survey data and glean valuable insights.

How much did you enjoy this article?

ExcelAd1
Start Free Trial!
125456

Related articles

next previous
Microsoft Excel8 min read

Excel Task Tracker Template for Smarter Task Insights

Task tracker template in Excel organizes tasks, tracks deadlines, and boosts efficiency. Learn its benefits, and explore expert tips to simplify task management.

Microsoft Excel10 min read

Invoice Tracker Template in Excel for Better Insights

An invoice tracker Excel template helps track invoices, due dates, and payments. Learn how to use this template for better financial management.

Microsoft Excel12 min read

Key Performance Indicators in Healthcare for Better Insights

Key Performance Indicators in healthcare track patient care and efficiency. Learn about these KPIs, top examples, and how to use them to improve outcomes.

Microsoft Excel10 min read

BMI Calculation Formula in Excel for Better Fitness Insights

The BMI calculation formula in Excel helps track and analyze body mass index. Explore step-by-step instructions and tips to simplify BMI tracking in Excel.

Microsoft Excel29 min read

How to Create a Tornado Chart in Excel? A Complete Guide

Click to learn how to plot a Tornado Chart in Excel using easy-to-follow steps. Also, we’ll address the following question: what is a Tornado Diagram?

ChartExpo logo

Turn Data into Visual
Stories

CHARTEXPO

  • Home
  • Gallery
  • Videos
  • Services
  • Pricing
  • Contact us
  • FAQs
  • Privacy policy
  • Terms of Service
  • Sitemap

TOOLS

  • ChartExpo for Google Sheets
  • ChartExpo for Microsoft Excel
  • Power BI Custom Visuals by ChartExpo
  • Word Cloud

CATEGORIES

  • Bar Charts
  • Circle Graphs
  • Column Charts
  • Combo Charts
  • Comparison Charts
  • Line Graphs
  • PPC Charts
  • Sentiment Analysis Charts
  • Survey Charts

TOP CHARTS

  • Sankey Diagram
  • Likert Scale Chart
  • Comparison Bar Chart
  • Pareto Chart
  • Funnel Chart
  • Gauge Chart
  • Radar Chart
  • Radial Bar Chart
  • Sunburst Chart
  • see more
  • Scatter Plot Chart
  • CSAT Survey Bar Chart
  • CSAT Survey Chart
  • Dot Plot Chart
  • Double Bar Graph
  • Matrix Chart
  • Multi Axis Line Chart
  • Overlapping Bar Chart
  • Control Chart
  • Slope Chart
  • Clustered Bar Chart
  • Clustered Column Chart
  • Box and Whisker Plot
  • Tornado Chart
  • Waterfall Chart
  • Word Cloud
  • see less

RESOURCES

  • Blog
  • Resources
  • YouTube
SIGN UP FOR UPDATES

We wouldn't dream of spamming you or selling your info.

© 2025 ChartExpo, all rights reserved.