• Home
  • Tools dropdown img
    • Spreadsheet Charts

      • ChartExpo for Google Sheets
      • ChartExpo for Microsoft Excel
    • Power BI Charts

      • Power BI Custom Visuals by ChartExpo
    • Word Cloud

  • Charts dropdown img
    • Chart Category

      • Bar Charts
      • Circle Graphs
      • Column Charts
      • Combo Charts
      • Comparison Charts
      • Line Graphs
      • PPC Charts
      • Sentiment Analysis Charts
      • Survey Charts
    • Chart Type

      • Box and Whisker Plot
      • Clustered Bar Chart
      • Clustered Column Chart
      • Comparison Bar Chart
      • Control Chart
      • CSAT Survey Bar Chart
      • CSAT Survey Chart
      • Dot Plot Chart
      • Double Bar Graph
      • Funnel Chart
      • Gauge Chart
      • Likert Scale Chart
      • Matrix Chart
      • Multi Axis Line Chart
      • Overlapping Bar Chart
      • Pareto Chart
      • Radar Chart
      • Radial Bar Chart
      • Sankey Diagram
      • Scatter Plot Chart
      • Slope Chart
      • Sunburst Chart
      • Tornado Chart
      • Waterfall Chart
      • Word Cloud
    • Google Sheets
      Microsoft Excel
  • Services
  • Pricing
  • Contact us
  • Blog
  • Support dropdown img
      • Gallery
      • Videos
      • Contact us
      • FAQs
      • Resources
    • Please feel free to contact us

      atsupport@chartexpo.com

Categories
All Data Visualizations Data Analytics Surveys
Add-ons/
  • Google Sheets
  • Microsoft Excel
  • Power BI
All Data Visualizations Data Analytics Surveys
Add-ons
  • Google Sheets
  • Microsoft Excel
  • Power BI

We use cookies

This website uses cookies to provide better user experience and user's session management.
By continuing visiting this website you consent the use of these cookies.

Ok

ChartExpo Survey


Home > Blog > Microsoft Excel

Extract Data from a PDF to Excel: Key Insights for Success

How do you extract data from a PDF to Excel quickly and accurately?

Imagine you’ve just received a massive PDF report full of valuable insights. You need to analyze and share the data with your team, but it’s locked in a non-editable format. Manually retyping it would take hours. Thankfully, technology offers faster solutions.

Companies generate more than 2.5 quintillion bytes of data daily, with a large amount stored in PDF format. An increasing number of professionals need to transfer data from a PDF to Excel to boost efficiency. Having your data in Excel can streamline analysis and make it more easily accessible.

Extract Data from a PDF to Excel

Tools for PDF-to-Excel conversion have evolved. Many can convert structured data with minimal effort, saving time and reducing errors. Knowing which tools to use and understanding their limitations can make a significant difference. Some PDFs are straightforward; others, with complex tables or embedded images, need more advanced approaches.

There is a pressing demand for precise and quick data extraction. A recent survey found that 49% of companies consider data-driven decisions crucial to success. However, only 30% have convenient access to the necessary data. Extracting data from a PDF to Excel helps bridge this gap.

Let’s find out how.

Table of Contents:

  1. Why Do You Need to Extract Data from PDF to Excel?
  2. How to Extract Data from a PDF to Excel?
  3. How to Get and Use Data from PDF to Excel Directly in Microsoft Excel?
  4. How to Automate PDF Data Extraction to Excel?
  5. Which is the Method to Fetch Data from PDF to Excel?
  6. Wrap Up

First…

Why Do You Need to Extract Data from PDF to Excel?

Have you ever been handed a PDF filled with critical data and wished you could work with it in Excel? PDFs are great for sharing information but are not always ideal for analyzing or organizing data. That’s where extracting data from PDF to Excel comes in. Converting PDF data to Excel can save time and make your work smoother.

How?

  • Enhanced data analysis: In Excel, you can sort, filter, and apply formulas to your data instantly. Excel’s analytical tools make it easier to identify trends and patterns, helping you make data-driven decisions faster.
  • Data organization: PDFs often scatter data across multiple pages, making tracking hard. Once you transfer that information to Excel, you can organize it into clean, structured tables. This makes it easier to understand and manage your data in one place.
  • Improved efficiency: Manually copying data from PDFs is time-consuming and error-prone. Automating this process by converting to Excel saves time and reduces the risk of mistakes. It boosts productivity, allowing you to focus on what matters—analyzing the data, not entering it.
  • Integration and sharing: Excel simplifies integrating the extracted data with other tools, software, or financial reports. Plus, sharing information with colleagues or teams is much easier in an Excel format. Why? It is universally used across various industries.

How to Extract Data from a PDF to Excel?

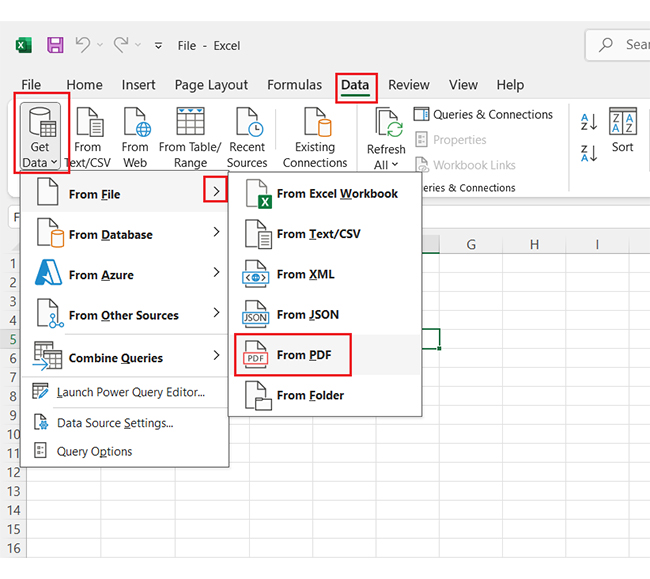
To import a PDF file directly into Excel, go to the “Data” tab. Then, access the “Get Data” drop-down in the “Get & Transform Data” section.

Click Get Data to Extract Data from a PDF to Excel 1

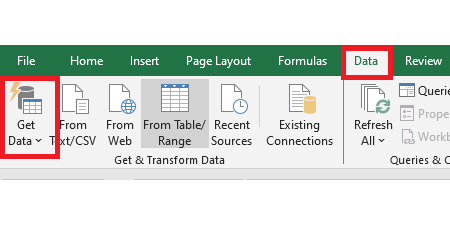
“Get Data” helps you discover, connect, and combine data from various sources. This allows you to shape and refine it to suit your needs.

How to Get and Use Data from PDF to Excel Directly in Microsoft Excel?

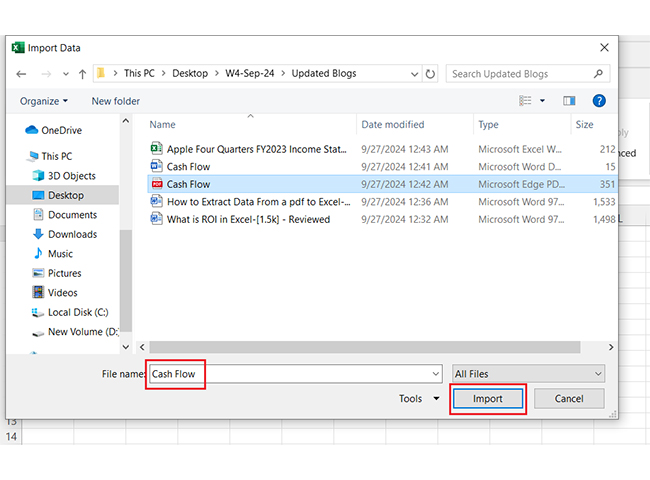
Have you ever tried to pull data from a PDF into Excel manually? It can be tedious and time-consuming. Thankfully, with Microsoft Excel’s built-in feature, you can extract data from a PDF directly into Excel. All this in just a few clicks.

Let’s walk through the steps to get data from PDF to Excel and speed up your workflow.

  1. Open Excel: Launch Microsoft Excel to get started.
  2. Import PDF data: Go to the “Data” tab and select “Get Data”. Then, choose “From File”> “From PDF”.
  3. Select PDF file: Browse and choose the PDF file from which you want to extract data.
  4. Navigator pane: A navigator window will open, showing the tables and pages of the PDF. Select the one you need.
  5. Load data: Click “Load” to import the selected data into your Excel sheet.
  6. Data transformation (optional): You can clean or transform the data by selecting “Transform Data” to edit it further.
  7. Analyze data: Your data is now in Excel and ready for data analysis. Use filters, pivot tables, or formulas to dig deeper.

How to Automate PDF Data Extraction to Excel?

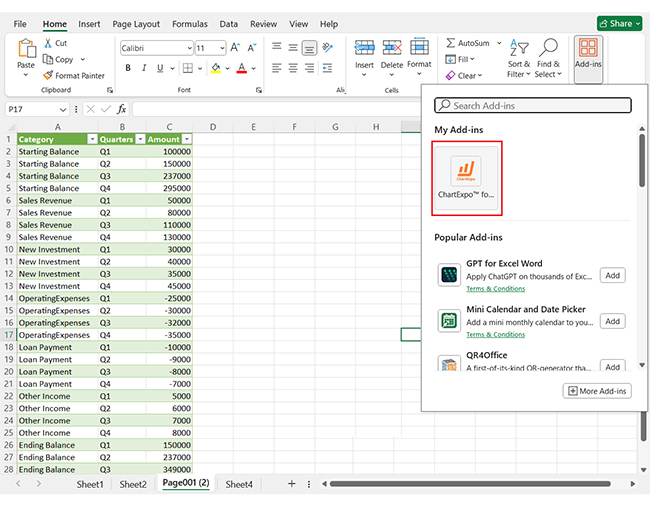
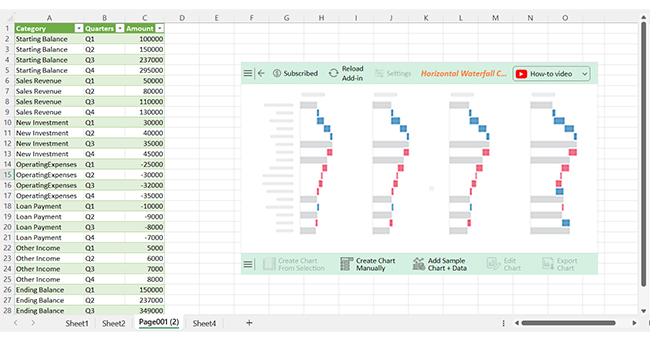
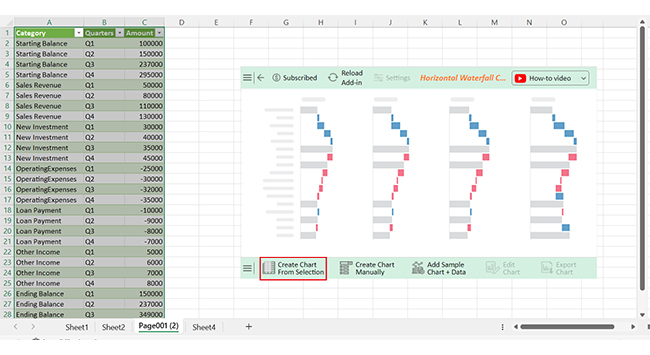
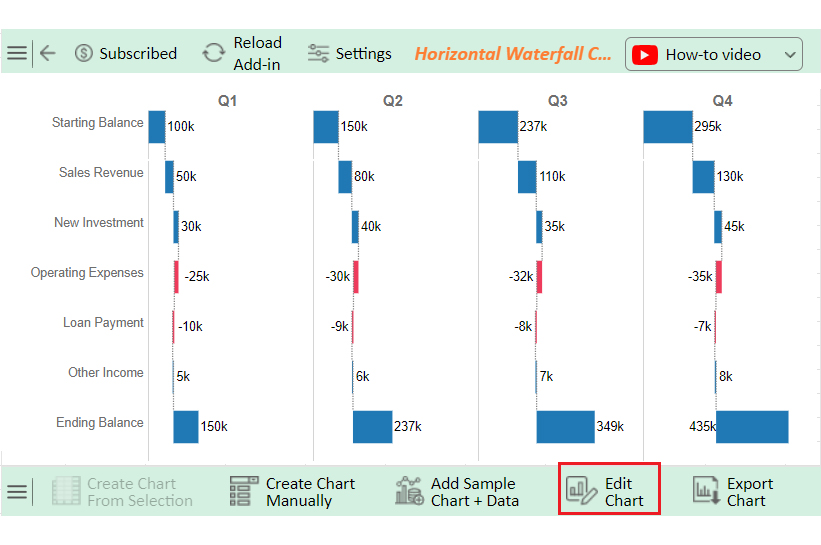
Manually extracting data from PDFs to Excel can be a chore. Especially if you’re dealing with large datasets or frequent reports. Fortunately, various ways exist to automate PDF data extraction and transfer it directly into Excel.

Here are some of the best methods to get started:

  • Use a PDF to Excel conversion tool: Online tools or software like Adobe Acrobat or specialized converters can automate the extraction process with just a few clicks.
  • Leverage Power Query in Excel: Power Query, built into Excel, allows you to import and clean PDF data with automation. It transforms the data instantly without manual input.
  • Employ VBA macros: Create custom VBA macros in Excel to automate recurring tasks, such as importing and formatting PDF data. Once set, you can run these scripts anytime to streamline the process.
  • Utilize Python scripts: Python libraries like PyPDF2 and Pandas can efficiently automate PDF to Excel extraction for more tech-savvy users. This is particularly useful for complex data sets.
  • Set up scheduled tasks: Automate the process further by scheduling regular tasks using built-in tools like Task Scheduler (Windows) or Automator (Mac). These tools run your scripts or conversions automatically.
  • API integration: For larger-scale operations, integrating APIs such as PDF.co or Adobe’s API can automate data extraction on a bigger scale. This feeds PDF data into Excel seamlessly.

Which is the Method to Fetch Data from PDF to Excel?

  • First, you can click on the “Get Data” drop-down button and click on “From PDF” as follows:
Click on From PDF to to Extract Data from a PDF to Excel 1
  • Second, you can select your PDF file from the system as follows:
Select PDF File to Extract Data from a PDF to Excel 1
  • A small window opens. From this, you can select a tabular data sheet and click on “Load” as follows:
Click Load Button to Extract Data from a PDF to Excel 1
  • You can see PDF file data in Excel converted as follows:
  • Now you can select the Add-Ins like one of the best ChartExpo as follows:
Select Add-Ins After You Have Extract Data from a PDF to Excel 1
  • After clicking the ChartExpo in Excel, you can select your chart from the chart list. For instance, the “Horizontal Waterfall Chart” is one of the best charts for analyzing sheet data as follows:
Click Horizontal Waterfall Chart After You Have Extract Data from a PDF to Excel 1
  • After clicking on the chart, you will see the Horizontal Waterfall Chart on the screen.
search horizontal waterfall chart in excel 1
  • Click the “Create Chart From Selection” button after selecting the data from the sheet, as shown.
Click on Create Chart From Selection After You Have Extract Data from a PDF to Excel 1
  • ChartExpo will generate the visualization below for you.
Initial Visual After You Have Extract Data from a PDF to Excel 1
  • If you want to have the chart’s title, click Edit Chart, as shown in the above image.
  • Click the pencil icon next to the Chart Header to change the title.
  • It will open the properties dialog. Under the Text section, you can add a heading in Line 1 and enable Show.
  • Give the appropriate title of your chart and click the Apply button.
Add Chart Header After You Have Extract Data from a PDF to Excel 1
  • You can enable the “Set as Total” option as follows:
Enable Set as Total After You Have Extract Data from a PDF to Excel 1
  • You can change the colors of the bars and click on “Apply All” as follows:
Change Colors of Bars and Click Apply All After You Have Extract Data from a PDF to Excel 1
  • After this, you can see both changes like “set as total” and “bars color,” and You can add the dollar sign with values as follows:
Add Prefix After You Have Extract Data from a PDF to Excel 1
  • Click the “Save Changes” button to persist the changes.
Click Save Changes After You Have Extract Data from a PDF to Excel 1
  • Your Horizontal Waterfall Chart will appear as below.
Final Extract Data from a PDF to Excel 1

Insights

  • There is consistent business growth with increasing sales revenue each quarter.
  • Regular investments are contributing to expansion.
  • There are rising expenses and loan payments throughout the year.
  • The ending balance shows significant financial progress.

FAQs

How do I extract data from multiple PDF files in Excel?

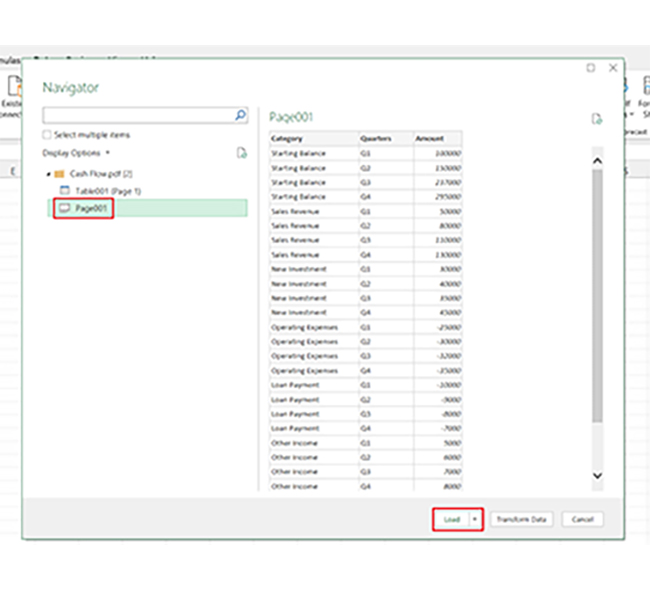
To extract data from multiple PDF files in Excel, use Power Query:

Import the PDFs into Power Query, then transform and combine the data.

You can also use third-party tools or copy-paste specific tables directly into Excel sheets.

How do you export PDFs to Excel for free?

To export PDF to Excel for free, use online tools like Smallpdf or Adobe’s free PDF converter. Upload the PDF, convert it to Excel, and download the file. You can also use Google Drive to convert PDFs into editable formats.

How do you extract particular data from a PDF?

To extract specific data from a PDF, use tools like Adobe Acrobat or Power Query in Excel. Select the needed data, copy it, and paste it into your desired program. You can also use specialized PDF extraction software for accuracy.

Wrap Up

Extracting data from a PDF to Excel doesn’t have to be complicated. There are several ways to get it done quickly and accurately. Each method offers its advantages, depending on your needs.

The easiest option is to use PDF to Excel converters. They are great for small tasks and one-time extractions. Power Query in Excel is ideal for users who need regular data imports and transformations. VBA macros are more technical but offer powerful automation for recurring tasks.

Python scripts are perfect for those who handle large or complex data sets. Scheduled tasks can automate everything without constant oversight. Finally, API integrations work well for large-scale data extraction across multiple platforms.

Choosing the right method depends on your requirements. Whether you need a quick fix or full automation, there’s a solution for everyone. Start by assessing your data extraction needs and try the best method. This will streamline your work and boost productivity.

How much did you enjoy this article?

ExcelAd2
Start Free Trial!
142251

Related articles

next previous
Microsoft Excel11 min read

How to Plot a Speedometer Chart in Excel?

Create a Speedometer Chart in Excel to track KPIs, goals, and performance metrics visually. Explore templates, examples, and step-by-step instructions for better dashboards.

Microsoft Excel13 min read

Excel for Teachers for Insightful Preparation

Excel for teachers simplifies grading, tracks attendance, and organizes data. Find its key features, expert tips, and how ChartExpo enhances data visualization.

Microsoft Excel14 min read

How to Make a Cash Flow Diagram in Excel?

Learn how to make a Cash Flow Diagram in Excel. It will help you learn to visualize and analyze inflows and outflows of your business cash flow.

Microsoft Excel11 min read

Succession Planning Template for Long-Term Success

Succession Planning Templates help businesses prepare for leadership changes. Learn to create, analyze, and use them for seamless transitions and growth.

Microsoft Excel10 min read

Grant Tracking Spreadsheet: Insights Made Easy

A Grant Tracker Spreadsheet helps track funding, deadlines, and expenses in Excel. Learn to use grant tracking templates, analyze data, and stay organized.

ChartExpo logo

Turn Data into Visual
Stories

CHARTEXPO

  • Home
  • Gallery
  • Videos
  • Services
  • Pricing
  • Contact us
  • FAQs
  • Privacy policy
  • Terms of Service
  • Sitemap

TOOLS

  • ChartExpo for Google Sheets
  • ChartExpo for Microsoft Excel
  • Power BI Custom Visuals by ChartExpo
  • Word Cloud

CATEGORIES

  • Bar Charts
  • Circle Graphs
  • Column Charts
  • Combo Charts
  • Comparison Charts
  • Line Graphs
  • PPC Charts
  • Sentiment Analysis Charts
  • Survey Charts

TOP CHARTS

  • Sankey Diagram
  • Likert Scale Chart
  • Comparison Bar Chart
  • Pareto Chart
  • Funnel Chart
  • Gauge Chart
  • Radar Chart
  • Radial Bar Chart
  • Sunburst Chart
  • see more
  • Scatter Plot Chart
  • CSAT Survey Bar Chart
  • CSAT Survey Chart
  • Dot Plot Chart
  • Double Bar Graph
  • Matrix Chart
  • Multi Axis Line Chart
  • Overlapping Bar Chart
  • Control Chart
  • Slope Chart
  • Clustered Bar Chart
  • Clustered Column Chart
  • Box and Whisker Plot
  • Tornado Chart
  • Waterfall Chart
  • Word Cloud
  • see less

RESOURCES

  • Blog
  • Resources
  • YouTube
SIGN UP FOR UPDATES

We wouldn't dream of spamming you or selling your info.

© 2025 ChartExpo, all rights reserved.