Categories
As a teacher, one of the essential tasks in your career is to track your students’ progress. Your objective is to identify the best-performing students. Still, you want to see if your teaching strategies are working.


Tracking progress in Excel is also crucial for education policymakers. They need to identify if the curriculum is working for the students.
Teachers and policymakers can adjust their strategies to ensure that students significantly benefit from education.
In monitoring your students’ growth, what visualization would you go for?
Yes, you guessed that right. An Excel spreadsheet to track students’ progress is the one for you.
This blog will help you learn much about tracking students’ progress, its benefits, and much more.
Are you ready? Let’s go.
Excel spreadsheets are one of the best in computing student data in schools.
As a teacher, you have used an Excel workbook more than often in calculating your students’ performance and organizing timetables.
One of the charts you can use in your Excel is a Stacked Bar Chart. It is one of the proven and tested visualizations you can use to track your students’ growth.
A Stacked Bar Chart is easy to read and interpret. An average student can also read this chart and understand their progress. This chart displays totals across categories.
As a teacher, you can use a Stacked Bar or a Clustered Stacked Bar Chart to visualize student performance in different subjects. These include mathematics, history, chemistry, etc.
This chart displays part-to-whole relationships. This means that you can view how one student compares to the rest of his classmates.
Excel does not have an advanced Stacked Bar Diagram. The best step is to supercharge your Excel with an add-in called ChartExpo. This add-in is unique because it features a skills matrix template in Excel, along with a tracking student progress template.
As a teacher, you don’t need a manual to use ChartExpo. It will be easy for you to visualize any school data.
ChartExpo is user-friendly, and you don’t need coding skills. It will work faster in whichever browser you use and give you the best results.
In installing ChartExpo in your Excel spreadsheet, follow the easy steps below:
In today’s education sector, students define their success by ensuring that they can track their academic growth. This means that a student has to perform well in every evaluation given to them by teachers.
The education sector aims to ensure every student benefits from academic excellence. Using an Excel spreadsheet to track students’ progress helps the sector strategize how to help the less-performing students.
As a teacher, you can use an Excel spreadsheet to track students’ progress optimally. You can monitor your student’s growth and development using a student progress report in Excel to ensure each student’s positive development from academic work.
Teachers can use an Excel spreadsheet to track students’ progress to follow up their achievements in a specific period. For instance, a teacher’s objective can ensure that 70% of their students score above the pass mark. This will help you as a teacher make more realistic and achievable goals every school year.
Tracking students’ progress encourages both teachers and students to utilize technology. How? Young students love technology. They might gain interest in learning how their teachers visualize their progress using software tools.
The best approach to monitoring your student’s progress would be to use charts.
With the help of charts and graphs, you can easily keep tabs on every student and evaluate their improvement or declining performance. You will have to use an Excel spreadsheet to track students’ progress.
In addition, charts display insights into key data points straightforwardly. As a teacher, you can use a Line Chart to observe an upward or downward trend of the whole class or an individual student.
Another essential chart you can use to track students’ progress is the Pareto Chart. How? It can help you as an educator reveal the 20% of students who contribute to 80% of the overall academic performance.
As a teacher, you can use a Bar Chart to visualize the best-performing students in your subject. Different bar sizes can easily give you insights into which student performed the best or the worst.


Let’s use an example to create a chart using ChartExpo. We will use a tracking student progress template in Excel.
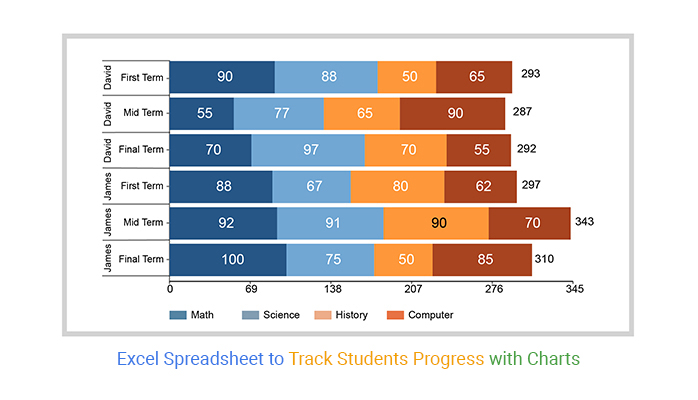
Let’s assume you want to evaluate your students’ performance in four subjects in different terms. You will use the example of a student data tracking sheet Excel below.
| Student | Term | Math | Science | History | Computer |
| Alex | First Term | 80 | 50 | 85 | 80 |
| Alex | Mid Term | 75 | 70 | 65 | 90 |
| Alex | Final Term | 65 | 66 | 72 | 77 |
| David | First Term | 90 | 88 | 50 | 65 |
| David | Mid Term | 55 | 77 | 65 | 90 |
| David | Final Term | 70 | 97 | 70 | 55 |
| James | First Term | 88 | 67 | 80 | 62 |
| James | Mid Term | 92 | 91 | 90 | 70 |
| James | Final Term | 100 | 75 | 50 | 85 |
Follow this easy guide to creating a Stacked Bar Chart.
To get started with ChartExpo, install ChartExpo in Excel from this link.
Follow the steps below:


You can track your students’ progress by using charts. This is because charts are easy to read and interpret.
Charts such as Pareto Charts can show you 20% of the students who contribute to 80% of overall performance. A Line Chart can help you track students’ performance over time.
The best way to organize students’ data in Excel is to classify each student’s performance in tables.
You can arrange students’ names alphabetically and indicate their performance in each subject. This makes it easy for you to visualize such data clearly and precisely.
Tracking students’ progress ensures they can track their progress and know the areas they can improve.
Tracking progress can help a teacher change teaching strategies, which guarantees improvement in the next period. It also allows policymakers to make decisions on how to improve education delivery.
Excel is one of the best spreadsheet tools you can use as a teacher to track your student’s progress.
To up your game, you need to supercharge your Excel with the ChartExpo add-in. You can access numerous advanced charts, which you can use to obtain insights into your students’ performance.
In a nutshell, tracking your students’ progress is vital for the success of their academic performance.
It is also essential for educators because they need to strategize on strategies that work best for students.
Policymakers also monitor students’ progress so that they install intervention methods””this will ensure that educators and students benefit from academic work.
The blog’s primary focus was to help you create an Excel spreadsheet to track students’ progress. This can help you as a teacher to quickly respond to challenges affecting students’ performance and optimize teaching strategies.
You learned why tracking students’ growth is essential in the education sector. Your primary focus is to ensure you can keep tabs on your student’s performance to maximize academic growth.
You have learned that charts are the way to go. They can help you reveal part-to-whole insights into your student’s progress. You have also learned how to track progress in Excel.
You have grasped how to create such charts in your Excel using the ChartExpo add-in. It has helped you learn how to visualize students’ performance using a Stacked Bar Chart in easy steps.
With that being said, it’s your turn to do it. Sign up for a 7-day free trial with ChartExpo. Don’t be left out in visualizing your students’ performance with irresistible easy-to-read charts.
How much did you enjoy this article?


Learn how to use sparklines in Excel to quickly visualize trends inside cells. Discover types, creation steps, customization, use cases, benefits, and best practices.

Learn what a confidence interval graph is, how to create it in Excel, and how to interpret results to make more reliable, data-driven decisions.

A correlation matrix in Excel helps identify relationships between variables. Learn how to create, read, and use it for effective data analysis.


