• Home
  • Tools dropdown img
    • Spreadsheet Charts

      • ChartExpo for Google Sheets
      • ChartExpo for Microsoft Excel
    • Power BI Charts

      • Power BI Custom Visuals by ChartExpo
    • Word Cloud

  • Charts dropdown img
    • Chart Category

      • Bar Charts
      • Circle Graphs
      • Column Charts
      • Combo Charts
      • Comparison Charts
      • Line Graphs
      • PPC Charts
      • Sentiment Analysis Charts
      • Survey Charts
    • Chart Type

      • Box and Whisker Plot
      • Clustered Bar Chart
      • Clustered Column Chart
      • Comparison Bar Chart
      • Control Chart
      • CSAT Survey Bar Chart
      • CSAT Survey Chart
      • Dot Plot Chart
      • Double Bar Graph
      • Funnel Chart
      • Gauge Chart
      • Likert Scale Chart
      • Matrix Chart
      • Multi Axis Line Chart
      • Overlapping Bar Chart
      • Pareto Chart
      • Radar Chart
      • Radial Bar Chart
      • Sankey Diagram
      • Scatter Plot Chart
      • Slope Chart
      • Sunburst Chart
      • Tornado Chart
      • Waterfall Chart
      • Word Cloud
    • Google Sheets
      Microsoft Excel
  • Services
  • Pricing
  • Contact us
  • Blog
  • Support dropdown img
      • Gallery
      • Videos
      • Contact us
      • FAQs
      • Resources
    • Please feel free to contact us

      atsupport@chartexpo.com

Categories
All Data Visualizations Data Analytics Surveys
Add-ons/
  • Google Sheets
  • Microsoft Excel
  • Power BI
All Data Visualizations Data Analytics Surveys
Add-ons
  • Google Sheets
  • Microsoft Excel
  • Power BI

We use cookies

This website uses cookies to provide better user experience and user's session management.
By continuing visiting this website you consent the use of these cookies.

Ok

ChartExpo Survey


Home > Blog > Microsoft Excel

10 Key Elements of Customer Experience Survey Questions

Customer satisfaction is key to success. However, figuring out what your customers are thinking can feel like trying to nail jelly to a wall.

That’s where surveys come in.

customer experience survey questions

I know the mere mention of surveys might make you want to run for the hills. But fear not, dear reader. We have crafted the ultimate guide to help you navigate the treacherous waters of survey creation.

Crafting a good customer experience survey is an art in itself. It requires a balance of being informative, concise, and witty. If you want to create engaging surveys that provide valuable insights, you’ve come to the right place.

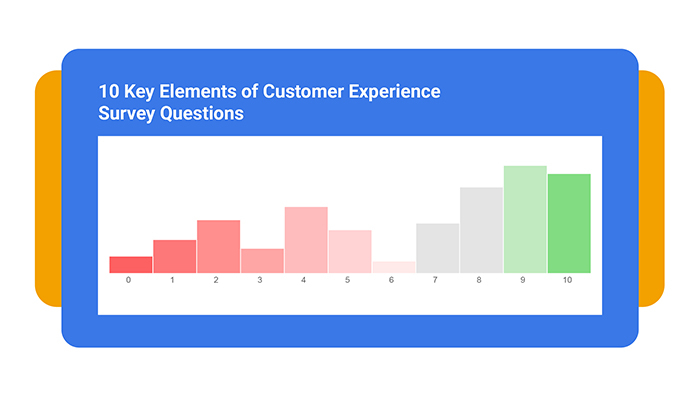
We’ll explore the 10 key elements of customer experience survey questions. From understanding your target audience to crafting the perfect question structure, we’ve got you covered.

Ultimately, you will effortlessly craft witty, engaging survey questions that provide valuable insights and make your customers smile.

Let’s get started.

Table of Content:

  1. What are Customer Experience Surveys?
  2. Why are Customer Experience Surveys So Important?
  3. 10 Key Elements of Customer Experience Survey Questions
  4. What are the Top 10 Customer Experience Survey Questions?
  5. How to Analyze Customer Experience Survey Results?
  6. Wrap Up

What are Customer Experience Surveys?

Customer experience surveys are a potent instrument that allows businesses to collect valuable customer feedback. These surveys reveal valuable insights regarding customer preferences, concerns, and expectations. The feedback aids in identifying areas necessitating improvement and recognizing areas of excellence within your business operations.

Why are Customer Experience Surveys So Important?

  • They Provide Insights into Customer Expectations

Surveys help uncover what customers expect from your business regarding products, services, support, and overall experience. Understanding these expectations, including their Net Promoter Score (NPS), allows you to tailor your offerings accordingly.

  • Identifying Areas for Improvement

Collecting feedback lets you pinpoint areas of your business that may be lacking or causing dissatisfaction. This information enables you to address issues, make necessary improvements, and enhance the overall customer experience, ultimately boosting consumer lifetime value.

  • Measuring Customer Satisfaction and Loyalty

Surveys allow you to gauge customer satisfaction levels and measure loyalty. By tracking satisfaction over time, you can assess the impact of changes or initiatives on customer perceptions. Then make informed decisions to retain and attract loyal customers.

  • Decision-Making and Strategy Development

Surveys provide valuable feedback that aids in data-driven decision-making and strategy development. They offer insights into customer preferences, market trends, and competitive advantages.

  • Building Customer Relationships

Engaging customers through surveys demonstrates that their opinions and experiences are valued. It shows a commitment to listening and responding to their needs. This, as a result, fosters stronger customer relationships and loyalty.

10 Key Elements of Customer Experience Survey Questions

Are you ready to take the survey of a lifetime? Here are 10 essential elements that will set your customer experience survey apart and make it truly remarkable.

  1. Clear and concise language: Use straightforward and easily understandable language to ensure respondents grasp the questions accurately.
  2. Specificity and focus: Ask precise and targeted questions that address specific aspects of the customer experience to obtain relevant feedback.
  3. Balanced question types: Use a mix of closed-ended and open-ended questionnaires to gather varied insights.
  4. Avoid leading or biased questions: Formulate questions neutrally without influencing respondents’ answers or introducing bias.
  5. Sequential and logical flow: Arrange questions in a logical order that follows a natural progression, facilitating a smooth and coherent survey experience.
  6. Customer-centric perspective: Frame questions from the customer’s viewpoint, focusing on their needs, preferences, and experiences.
  7. Appropriately sized survey: Keep the survey concise and manageable, respecting respondents’ time and attention to maximize completion rates.
  8. Pre-testing and validation: Conduct pilot testing with a small group. This helps you identify potential issues or ambiguities in the survey questions before deploying them widely.
  9. Flexibility for open-ended feedback: Include opportunities for respondents to provide detailed, open-ended feedback, allowing for nuanced insights and additional comments.
  10. Outcome-oriented inquiries: Frame questions in a way that connects to specific outcomes or improvements. This will help you gather actionable feedback for enhancing the customer experience.

What are the Top 10 Customer Experience Survey Questions?

Are you tired of shooting in the dark when trying to understand your customers? Do you want to gather valuable feedback that will help you improve your business? Look no further than these top 10 customer experience survey questions.

  1. How would you rate your overall experience with our company?
  2. How likely will you recommend our products/services to others?
  3. Did our product/service meet your expectations?
  4. How would you rate the quality of our customer service?
  5. Were you satisfied with the resolution of any issues or concerns you had?
  6. How easy was it to navigate our website/use our app?
  7. Did our staff demonstrate knowledge and professionalism?
  8. Did you receive prompt and efficient assistance?
  9. How would you rate the value for money of our products/services?
  10. Did our product/service solve your problem or meet your needs?

How to Analyze Customer Experience Survey Results?

Excel is like that trusty old friend who’s always got your back when organizing data. It’s reliable, familiar, and can handle a lot of information without breaking a sweat.

However, Excel can be a buzzkill regarding data visualization. You could spend hours trying to create a chart that accurately conveys the insights from your surveys. Only to end up with a confusing mess that nobody wants to look at.

That’s where ChartExpo comes in.

This powerful Excel add-in transforms your survey findings into insightful and interactive visualizations. As a result, you can delve into your customers’ feedback seamlessly and gain invaluable insights.

Benefits of ChartExpo

  • ChartExpo is like a genie lamp for your survey data, with an array of visualizations to choose from. This makes data analysis and presentation a piece of cake.
  • No coding skills are required; ChartExpo’s user interface is as easy as ABC.
  • You can add a personal touch to your visuals by customizing colors, fonts, and styles.
  • ChartExpo is affordable with a $10 monthly plan and offers a free 7-day trial. You won’t have to break the bank to create insightful, appealing visualizations.

How to Install ChartExpo in Excel?

  1. Open your Excel application.
  2. Open the worksheet and click the “Insert” menu.
  3. You’ll see the “My Apps” option.
  4. In the office Add-ins window, click “Store” and search for ChartExpo on my Apps Store.
  5. Click the “Add” button to install ChartExpo in your Excel.

ChartExpo charts are available both in Google Sheets and Microsoft Excel. Please use the following CTA’s to install the tool of your choice and create beautiful visualizations in a few clicks in your favorite tool.

Example

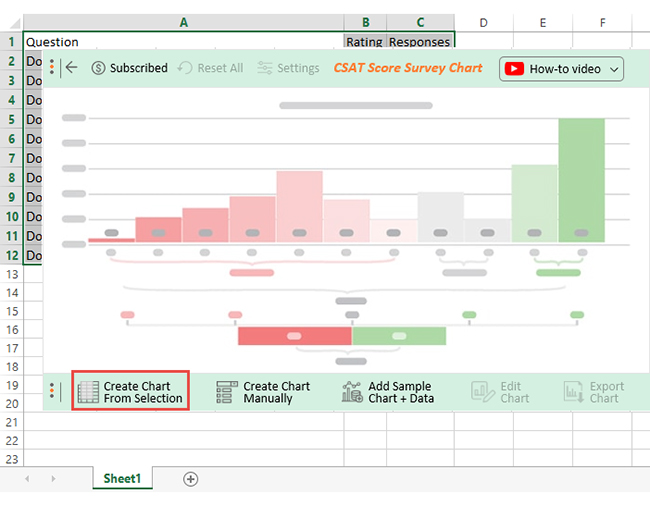
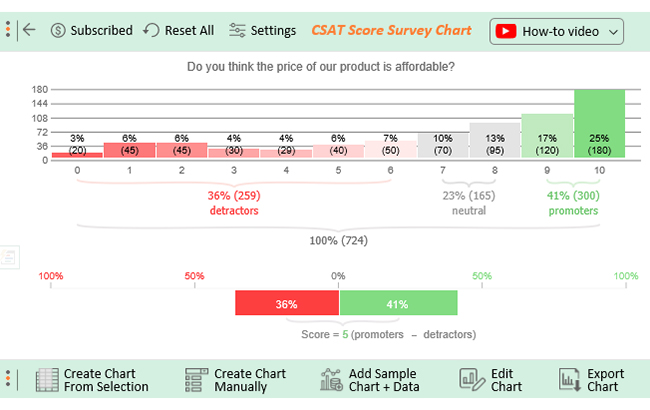
Let’s say you conduct a survey that yields the result table below.

Question Rating Responses
Is the price of our product affordable? 0 20
Is the price of our product affordable? 1 45
Is the price of our product affordable? 2 45
Is the price of our product affordable? 3 30
Is the price of our product affordable? 4 29
Is the price of our product affordable? 5 40
Is the price of our product affordable? 6 50
Is the price of our product affordable? 7 70
Is the price of our product affordable? 8 95
Is the price of our product affordable? 9 120
Is the price of our product affordable? 10 180

Follow through as I show you how to create a visualization with ChartExpo and glean valuable insights.

  • Install ChartExpo in Excel to get started.
  • After installation, click My Apps from the INSERT menu.
insert chartexpo in excel
  • Select ChartExpo, and click the Insert button.
open chartexpo in excel
  • Once it loads, choose the CSAT Score Survey Chart from the chart list.
search csat score chart in excel
  • Select the data from the sheet and click the Create Chart From Selection button.
Create Chart From Selection ce363
  • ChartExpo will generate the visualization below for you.
final customer experience survey questions

Insights

  • 41% of the respondents gave positive responses, 36% gave negative responses, and 23% remained neutral.
  • The Net Promoter Score (NPS) is positive 5; the value of promoters is higher than that of detractors.

FAQs

How often should I conduct customer experience surveys?

The frequency of customer experience surveys depends on factors such as your industry, customer lifecycle, and business objectives. However, it is generally recommended to conduct regular surveys, whether quarterly, biannually, or annually. This helps you track and assess customer experiences consistently.

What is the best format for customer experience survey questions?

The best format for customer experience survey questions typically includes a mix of question types. This allows for a combination of quantitative data, qualitative insights, and flexibility for respondents to provide detailed feedback.

How can I measure the ROI of customer experience surveys?

Measuring the return on investment (ROI) of customer experience surveys involves analyzing various metrics. Such metrics include customer satisfaction scores, retention rates, repeat purchase behavior, and referrals. Then compare them to revenue growth and cost savings attributable to improvements driven by survey insights.

Wrap Up

Well-designed survey questions are a fundamental component of a successful customer experience program. Incorporating the 10 key elements of customer experience survey questions can significantly enhance your survey’s effectiveness and value.

Clarity, conciseness, specificity, and focus allow you to obtain precise and actionable feedback. Balancing question types and avoiding leading or biased questions maintains survey neutrality and encourages unbiased responses.

A sequential and logical flow of questions helps respondents navigate the survey easily. A customer-centric perspective ensures the survey addresses their needs and expectations.

Keep the survey appropriately sized and conduct pre-testing and validation to help you optimize the survey experience.

Offering flexibility for open-ended feedback allows customers to express their thoughts and suggestions, providing valuable qualitative insights. Furthermore, crafting outcome-oriented inquiries focuses on gathering actionable data that drive improvements and strategic decision-making.

How you interpret the data you receive can make a big difference in the growth of your business. That’s why it is essential to have a tool that makes survey result analysis effortless and effective.

ChartExpo for Excel is the tool you need it’s affordable and easy to use. It transforms your survey findings into interactive visualizations that are both engaging and insightful. As a result, you can delve into your customers’ feedback seamlessly and gain invaluable insights.

Net Promoter, NPS, NPS Prism and many other terms related to NPS are registered trademarks of Bain & Company Inc., Satmetrix Systems Inc., and Fred Reichheld.

How much did you enjoy this article?

ExcelAd1
Start Free Trial!
127782

Related articles

next previous
Microsoft Excel8 min read

Excel Task Tracker Template for Smarter Task Insights

Task tracker template in Excel organizes tasks, tracks deadlines, and boosts efficiency. Learn its benefits, and explore expert tips to simplify task management.

Microsoft Excel10 min read

Invoice Tracker Template in Excel for Better Insights

An invoice tracker Excel template helps track invoices, due dates, and payments. Learn how to use this template for better financial management.

Microsoft Excel12 min read

Key Performance Indicators in Healthcare for Better Insights

Key Performance Indicators in healthcare track patient care and efficiency. Learn about these KPIs, top examples, and how to use them to improve outcomes.

Microsoft Excel10 min read

BMI Calculation Formula in Excel for Better Fitness Insights

The BMI calculation formula in Excel helps track and analyze body mass index. Explore step-by-step instructions and tips to simplify BMI tracking in Excel.

Microsoft Excel29 min read

How to Create a Tornado Chart in Excel? A Complete Guide

Click to learn how to plot a Tornado Chart in Excel using easy-to-follow steps. Also, we’ll address the following question: what is a Tornado Diagram?

ChartExpo logo

Turn Data into Visual
Stories

CHARTEXPO

  • Home
  • Gallery
  • Videos
  • Services
  • Pricing
  • Contact us
  • FAQs
  • Privacy policy
  • Terms of Service
  • Sitemap

TOOLS

  • ChartExpo for Google Sheets
  • ChartExpo for Microsoft Excel
  • Power BI Custom Visuals by ChartExpo
  • Word Cloud

CATEGORIES

  • Bar Charts
  • Circle Graphs
  • Column Charts
  • Combo Charts
  • Comparison Charts
  • Line Graphs
  • PPC Charts
  • Sentiment Analysis Charts
  • Survey Charts

TOP CHARTS

  • Sankey Diagram
  • Likert Scale Chart
  • Comparison Bar Chart
  • Pareto Chart
  • Funnel Chart
  • Gauge Chart
  • Radar Chart
  • Radial Bar Chart
  • Sunburst Chart
  • see more
  • Scatter Plot Chart
  • CSAT Survey Bar Chart
  • CSAT Survey Chart
  • Dot Plot Chart
  • Double Bar Graph
  • Matrix Chart
  • Multi Axis Line Chart
  • Overlapping Bar Chart
  • Control Chart
  • Slope Chart
  • Clustered Bar Chart
  • Clustered Column Chart
  • Box and Whisker Plot
  • Tornado Chart
  • Waterfall Chart
  • Word Cloud
  • see less

RESOURCES

  • Blog
  • Resources
  • YouTube
SIGN UP FOR UPDATES

We wouldn't dream of spamming you or selling your info.

© 2025 ChartExpo, all rights reserved.