Categories
Budgeting in healthcare involves allocating financial resources to manage costs, ensure sustainable operations, and improve patient care. Careful planning, forecasting, and monitoring are required to balance healthcare and financial needs.


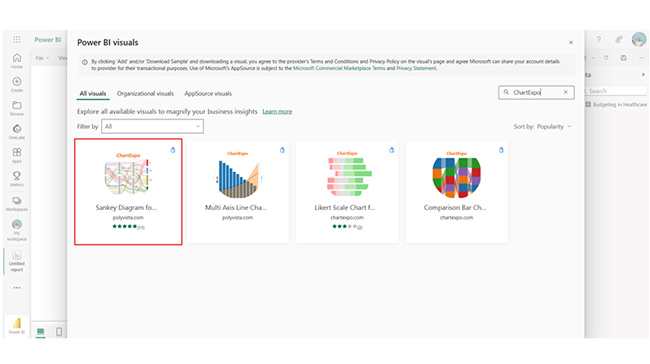
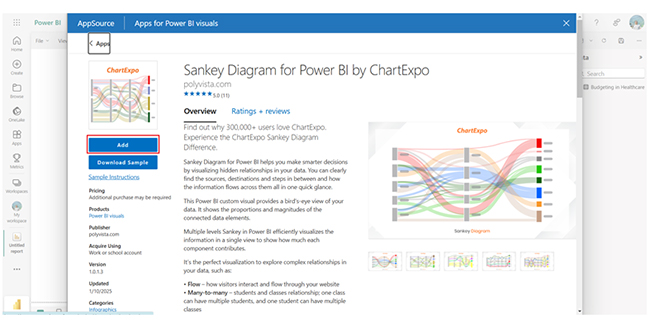
In this guide, you’ll discover what budgeting in healthcare is, the importance of healthcare budgeting, and the factors that affect hospital budgets. The guide also helps you figure out how data presentation can be done using the Sankey diagram in Power BI.
As a Power BI user, you’ll also figure out how the percentage of total in Power BI works, and what data gateway in Power BI is. This guide shows how cash flow analysis is, and the importance of data storytelling during data analysis.
Finally, you’ll discover the types of budgeting in healthcare, and what the healthcare budgeting process is.
Definition: A budget in healthcare is a financial plan that outlines expected expenditures and revenues for a healthcare organization. It helps in managing resources, controlling costs, and ensuring financial sustainability while delivering quality care.
Budgeting in healthcare also plays a role in quality of care measures in healthcare. It provides tools to help you evaluate how well healthcare is provided.
A well-structured budget helps healthcare providers to plan for future growth and improvements. It helps identify areas where funds should be invested.
Effective budgeting enables healthcare providers to allocate resources toward essential patient care services. It ensures that quality care is not compromised.
Healthcare budgeting plays a major role in controlling costs within an organization. Strategically allocating funds across different departments and services prevents overspending and ensures that resources are put to good use.
Healthcare budgets help organizations comply with government regulations, meet financial reporting requirements, and fulfill obligations to investors, insurance companies, and stakeholders, with financial charts adding clarity to complex financial data.
The number of patients and their specific healthcare needs impact hospital spending. A higher patient volume requires more resources like medical supplies, staff, and equipment.
Changes in healthcare laws and regulations, like quality standards, new reimbursement models, and safety mandates, lead to increased operational costs (or reduced revenue).
Labor is a significant budgetary expense for hospitals, especially when managing performance-based budgeting. Benefits, salaries, and staff training are key considerations. Fluctuations in staffing levels due to overtime, turnover, or temporary staff affect budgeting.
The adoption of new medical technologies comes with high initial costs. That includes purchasing equipment and training staff.
This method adjusts the previous year’s budget by a fixed percentage. Inflation or changes in healthcare needs should be considered.
It allows adjustments based on changes in patient volume (or other variables). It offers adaptability and helps organizations manage fluctuating demands (or unforeseen expenses).
Senior management sets the overall budget, which is distributed across departments. It ensures alignment with organizational goals but may limit departmental flexibility.
It focuses on costs associated with specific activities (or services) rather than departments. It provides a detailed view of resource usage and encourages more precise cost management.
There’s a yearly review and justification of every expense. This way, resources are allocated based on current priorities rather than historical spending, and it promotes efficiency.
You should define the organization’s financial objectives, such as improving patient care, controlling costs, and maintaining profitability (or sustainability).
Hospital administrators collect data from multiple departments, like patient volume trends, equipment requirements, and historical financial records. All these help to inform the budget planning.
The collected data is used to draft budget proposals for different departments. Adjustments are made according to the available resources and priorities.
The proposed budget is reviewed by senior management and adjusted before it’s approved.
The budget is implemented after approval, and you have to monitor and compare the actual expenses with the budgeted amounts using Power BI charts. This helps identify discrepancies and allows for timely adjustments.
In this section, you’ll discover some Power BI KPI dashboards and some healthcare dashboard examples. You’ll also discover some advanced features like the Power BI remove duplicates, Power BI cross filter direction, and the Power BI Selectedvalue.
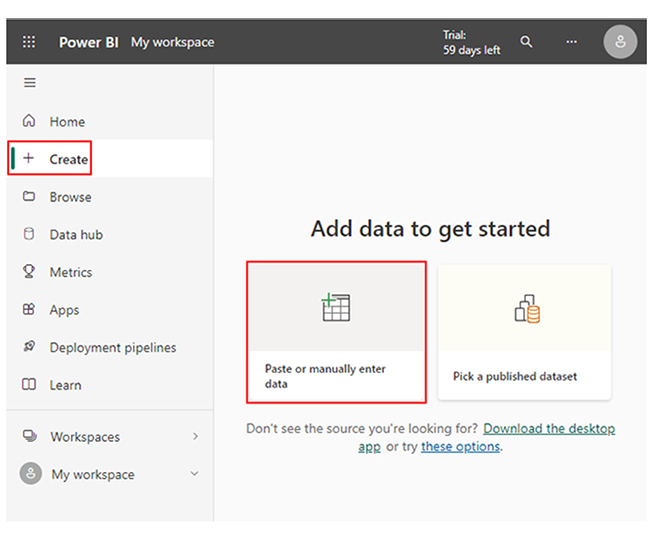
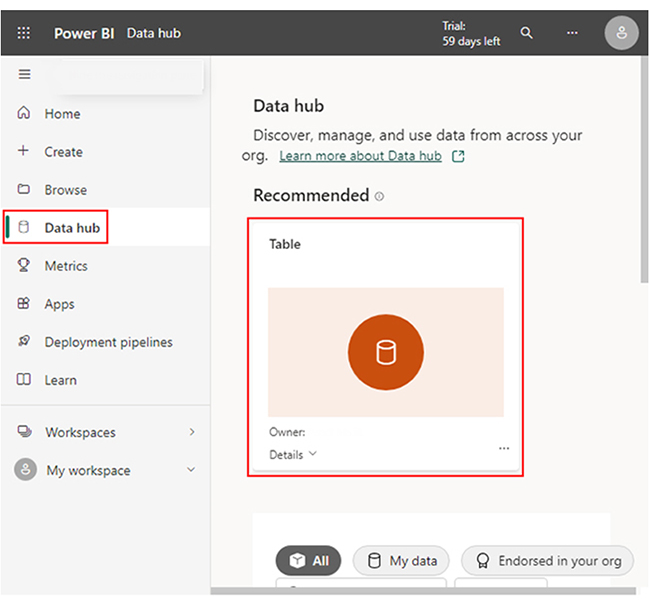
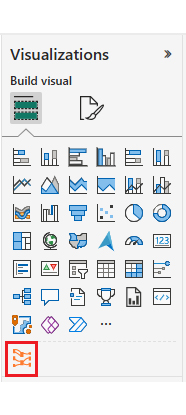
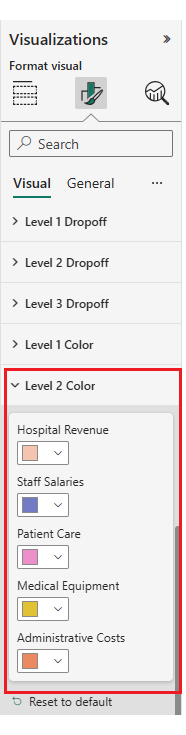
Here are the stages to help you analyze your healthcare budget in Power BI, using tools like a Sankey diagram generator to visualize complex flows and uncover clearer insights.
| Level 1 | Level 2 | Level 3 | Expenses |
| Revenue | Hospital Revenue | General Revenue | 1500000 |
| Revenue | Hospital Revenue | Insurance Payments | 1000000 |
| Costs | Patient Care | Emergency Services | 300000 |
| Costs | Patient Care | Surgery Services | 400000 |
| Costs | Medical Equipment | Diagnostic Equipment | 200000 |
| Costs | Medical Equipment | Surgical Instruments | 150000 |
| Costs | Staff Salaries | Doctors’ Salaries | 500000 |
| Costs | Staff Salaries | Nurses’ Salaries | 250000 |
| Operating Expenses | Administrative Costs | Office Supplies | 50000 |
| Operating Expenses | Administrative Costs | Facility Maintenance | 100000 |
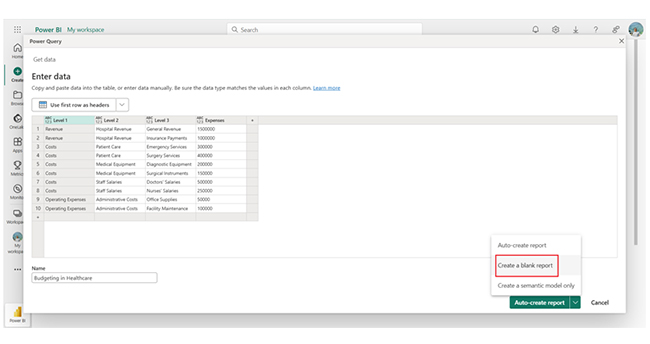
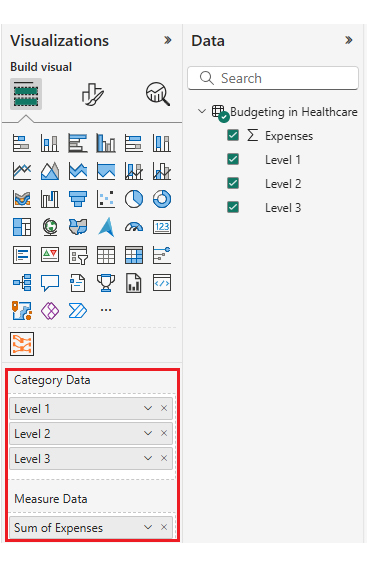
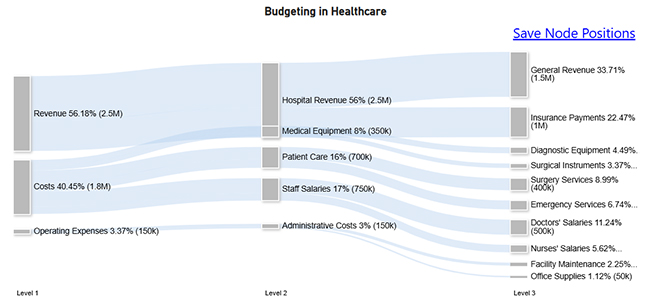
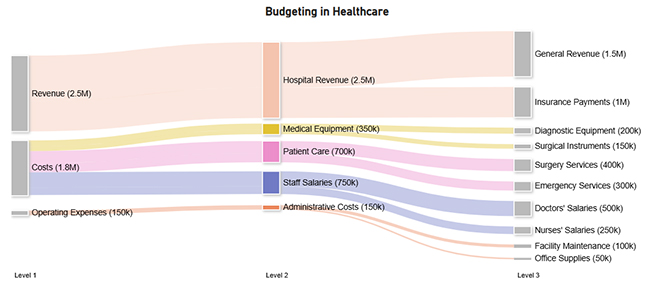
The data shows revenue sources from insurance and hospital payments. Major expenses include staff salaries (nurses, doctors), patient care services (surgery, emergency), and medical equipment. The data also shows operating expenses focused on maintenance and administration.
A well-planned budget helps healthcare organizations manage their financial resources. It helps prevent overspending and ensures financial stability. By allocating resources efficiently, hospitals can stay within their means, and avoid deficits.
Budgeting provides a framework for investment in technology, service improvements, or expansion. It gives healthcare organizations the room to plan for future growth and respond proactively to changing demands and trends in healthcare.
A budget ensures that funds are allocated to priority areas like medical equipment, facility maintenance, and patient care. This improves resource utilization and ensures that essential services are well-funded.
Budgeting establishes a benchmark for financial performance, and that helps healthcare providers monitor actual expenditures against the budget. This boosts accountability and helps managers identify areas of improvement.
You have to ensure that the budget reflects the healthcare organization’s long-term objectives. This alignment ascertains that resources are used effectively.
Take advantage of historical data, cost trends, and patient volume projections to inform the budgeting process. Accurate forecasting helps you anticipate fluctuations and set realistic financial targets.
You have to include a contingency fund in the budget to account for unforeseen expenses like unexpected healthcare demands or emergencies. This is a good way to ensure financial flexibility.
Involve financial experts, department heads, and healthcare managers in budgeting. Insights gained from these stakeholders help create realistic budgets based on actual needs and challenges. This will foster ownership and collaboration.
Budgeting in healthcare ensures efficient resource allocation, financial sustainability, and cost control. It gives room for strategic planning, maintains compliance with regulations, and improves care delivery. It also helps organizations navigate financial challenges.
To budget for healthcare expenses, you have to estimate medical costs, out-of-pocket expenses, and consider insurance premiums, and deductibles.
A healthcare budget is a financial plan that allocates resources for operations, patient care, and growth. It gives room for strategic planning, cost control, and sustainable care delivery while meeting regulatory requirements.
To get the most out of budgeting in health care, you have to plan for contingencies. There has to be a contingency fund in the budget to account for unforeseen expenses like unexpected healthcare demands (or emergencies). It ensures financial flexibility.
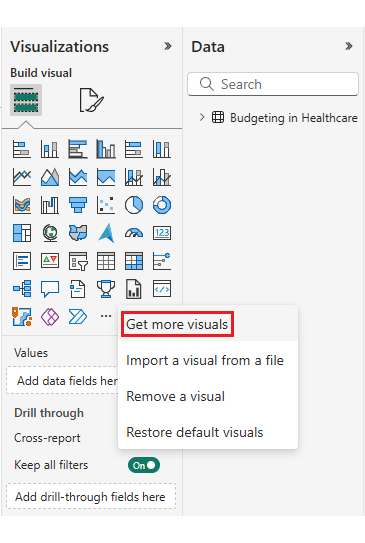
The steps in this guide will help you create compelling visualizations by using the healthcare budget in Power BI.
Now you know what budgeting in healthcare is, what things will you consider when creating a healthcare budget for your organization?
How much did you enjoy this article?


Discover diverse and high-quality Power BI report examples for inspiration and insights. Elevate your reporting with strategic visualization techniques.

A Customer Relationship Management Dashboard centralizes data, tracks key metrics, and drives smarter business decisions. Discover now!

Explore Healthcare Dashboard Examples and learn how to turn complex healthcare data into clear, actionable insights for better decision-making.


