Categories
A benchmark for surveying is a fixed reference point used in measuring elevations, and it ensures accuracy in mapping, land surveys, and construction projects.


This guide dives deep into what benchmark surveying is, the importance of benchmarks in modern surveying, and the types of benchmarks in surveying. You’ll also discover what 360 surveys are all about, customer experience survey questions, exit survey questions, best survey questions, leading questions, and how to study survey results.
The guide shows you the average survey response rates and how to use Google Forms for surveys. Aside from all these, you’ll discover how to create an open-ended questionnaire, how to draw insights from graphing survey results, and how to perform quantitative surveys.
How are surveys conducted? Well, this guide gives you insight into that. It also gives you clues on how to perform consumer research and demographic survey questions to help you conduct qualitative surveys.
There are sections in the guide that will introduce you to the process of establishing benchmarks in surveying and the use cases of temporary benchmarks in surveying.
Definition: Benchmark surveying involves using fixed reference points (or benchmarks) to measure elevations and ensure accuracy in construction, mapping, and land surveys. The benchmarks serve as precise elevation markers, and that helps surveyors establish consistent measurements across different locations.
Benchmarks offer fixed elevation points that allow surveyors to accurately measure land elevations. This comes in handy during flood assessments, topographic mapping, and land-use planning.
Modern infrastructure projects like bridges, railways, and highways require consistent elevation references over time. Benchmarks ascertain that future surveys align with past measurements. This will, in turn, prevent errors.
By using established benchmarks, you’ll reduce the time required for survey setup, and that makes the process faster and more cost-effective.
Construction projects rely on benchmarks for road grading, drainage systems, and foundation leveling. Precise elevation data helps engineers design structures that align with existing land contours.
It was established by the national survey departments for high-precision elevation measurements. And it’s based on geodetic surveys using advanced instruments like theodolites and GPS.
This type of benchmark in the survey comes in handy during mapping, geographic data analysis, and infrastructure projects. It’s often marked by metal pillars or plates, and found in permanent locations.
An arbitrary benchmark was created for specific projects where no official benchmark is available. It’s used in local land surveys, temporary projects, and small construction sites. In this benchmark type, elevation is assumed, and it does not correspond to sea level.
It’s fixed by government agencies on stable structures like rocks, bridges, or buildings. The permanent benchmark provides a long-term reference for future surveys and is vital for large-scale engineering projects. Permanent benchmarks also come into play during projects like land records and property boundary identification.
A temporary benchmark is set up by surveyors for short-term use during ongoing projects. It’s used for building construction, excavation, and roadwork surveys. This benchmark type is usually marked on concrete structures, wooden stakes, or fences.
You have to choose a stable, permanent site with minimal risk of disturbance, like a building, rock, or concrete structure. This will ascertain accessibility and visibility for future surveys.
To determine elevation, use high-precision instruments like total stations, GPS receivers, or theodolites. Also, connect the benchmark to an existing reference point like the GTS benchmark.
Install a concrete pillar, metal plate, or inscribed mark at the selected location. Also, record the exact elevation, longitude, and latitude for future reference.
You have to conduct repeated measurements to ascertain accuracy. Aside from that, cross-check with nearby benchmarks for consistency.
Always register the benchmark details in official survey records or maps. After that, share the data with government agencies, surveyors, and engineers for further use.


It helps in slope calculation, drainage planning, and grading. It’s also used to measure elevation differences between different sections of a road.
The temporary benchmark in surveying assesses temporary elevation changes due to environmental conditions. Aside from all these, it plays a role in flood control studies, soil erosion monitoring, and temporary water level measurements.
Plays a major role when marking elevation levels for roads, buildings, and bridges. It ensures consistency in height measurements for structural alignment and foundation leveling.
It provides elevation references for laying pipelines, constructing embankments, and digging trenches. With a temporary benchmark in surveying, you’ll ascertain that excavation meets the required alignment and depth.
Some PBMs are located in restricted or remote areas, and that makes access difficult for surveyors. Urban development can lead to benchmarks being removed or obstructed.
Earthquakes, erosion, and floods can shift (or damage) benchmarks. This will, in turn, affect accuracy. Climate change can also alter land elevation over time.
Not all regions have PBMs, and that requires surveyors to establish arbitrary or temporary benchmarks.
Agencies (or governments) must regularly update and verify benchmarks. This verification and update process requires resources.
Benchmarks are fixed reference points with known elevations. They’re used by surveyors to measure land height. It ascertains consistency in construction, mapping, and engineering projects. They serve as reliable elevation markers for precise surveying.
To set a benchmark in surveying, you have to select a stable location and measure elevation using GPS or leveling instruments. You’ll have to mark it with a durable reference point, verify its accuracy, and document it for future use.
Survey benchmarks are found in government databases, geodetic agencies, online GIS portals, local land survey offices, or topographic maps. They’re usually marked on permanent structures like bridges, concrete pillars, or buildings.
Benchmark surveying involves the use of fixed reference points with known elevations for accurate land measurement. It’s important to factor in survey bias during this process. After all, it’s nearly impossible to eliminate it during surveying.
Benchmark surveying comes with limitations like limited coverage and the risk of physical damage. Not all regions have PBMs, and that requires surveyors to establish arbitrary (or temporary) benchmarks.
Furthermore, natural wear, vandalism, or construction can degrade markings or structures. And if you’re working with concrete markers (or metal), they may corrode (or erode) over time.
The cost of maintenance could also be a limiting factor. Regular updates and benchmark verification require resources, and that counts as extra cost.
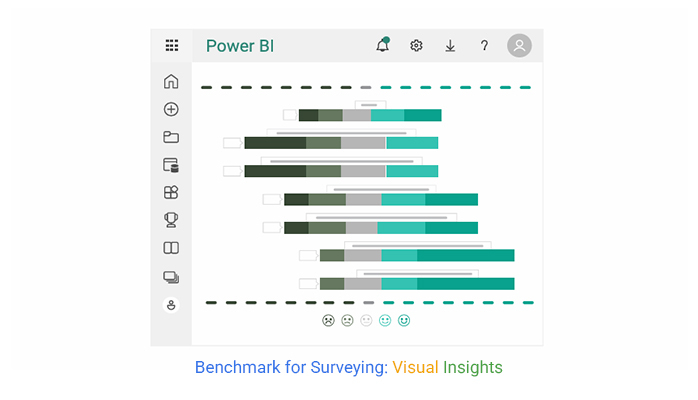
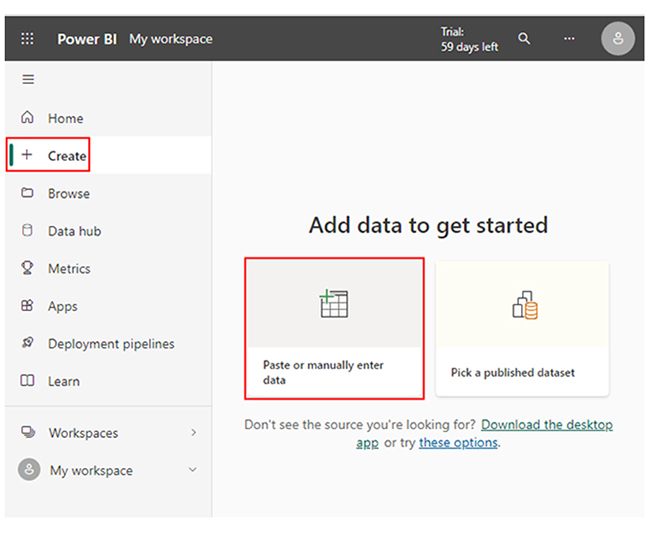
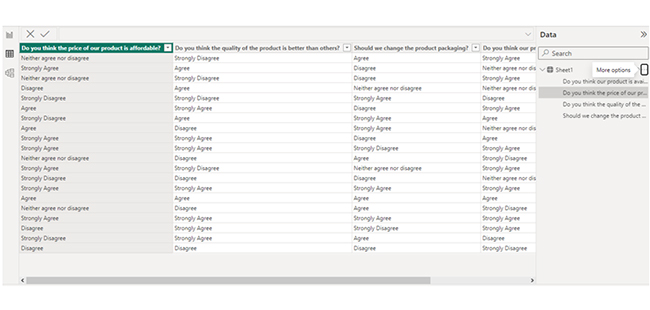
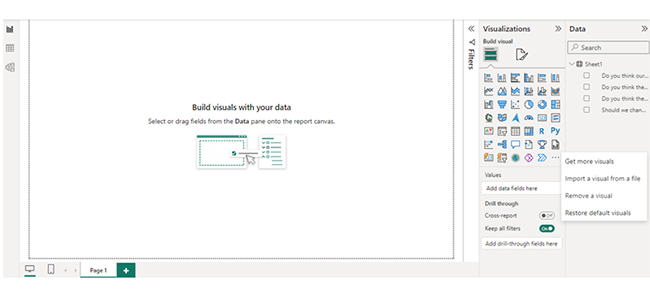
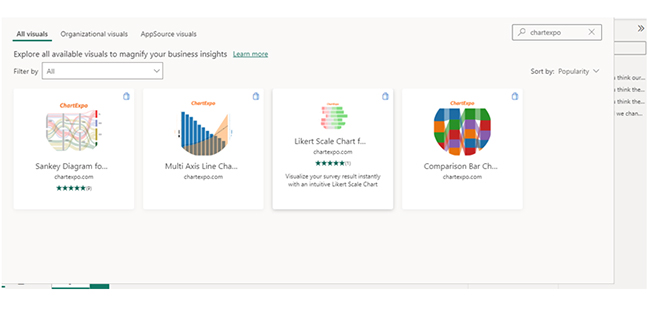
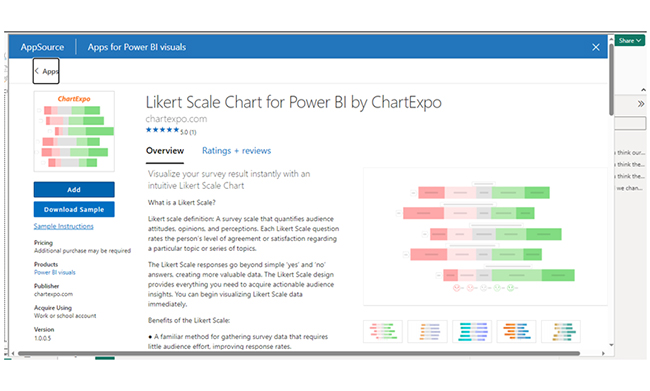
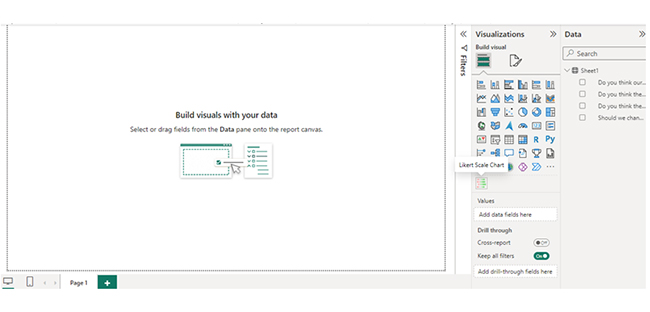
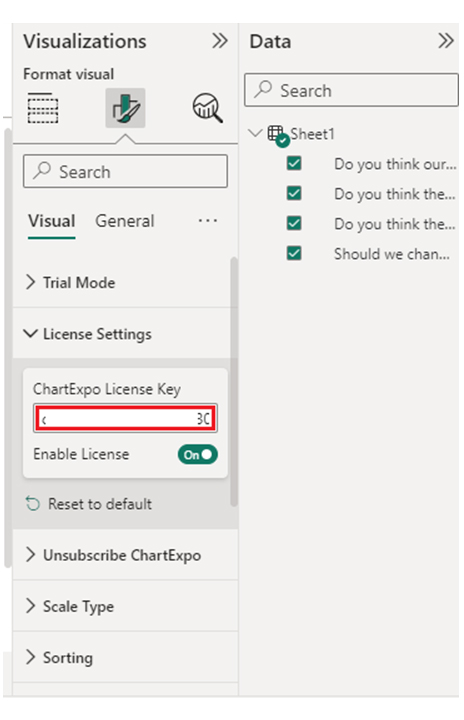
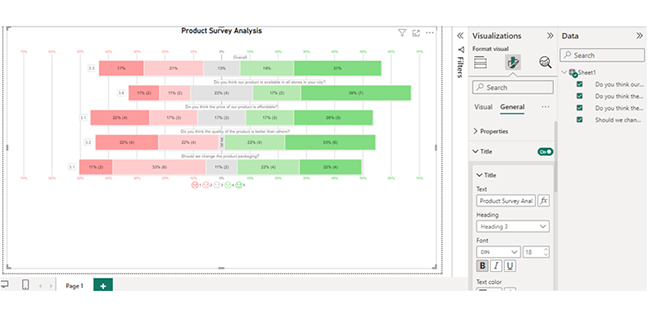
Now you know what benchmark surveying is, how will you use your benchmark survey data to create a visualization in Power BI?
How much did you enjoy this article?


Google Forms to Google Sheets keeps your data organized and current with every submission. Learn the steps, methods, and tips now!

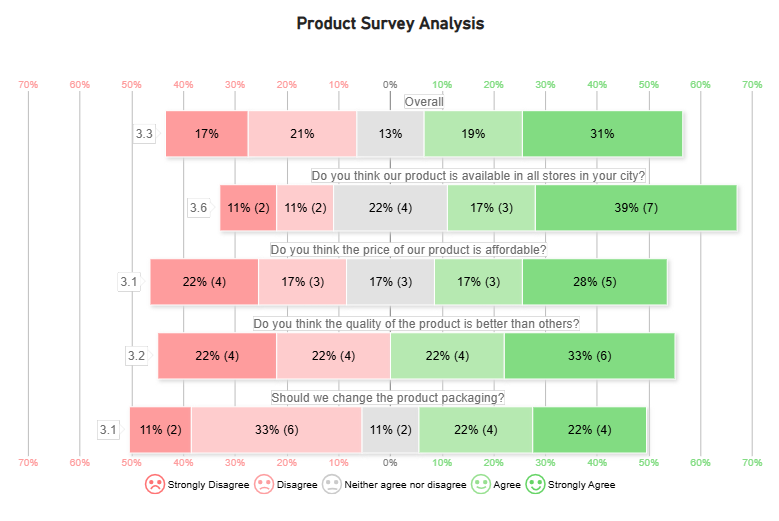
Product survey questions reveal what customers truly think. Learn how to ask the right ones and act on the survey results. Read on!

Learn how the 5-Point Performance Rating Scale improves employee evaluations with clear, consistent, and fair performance reviews across teams.


