• Home
  • Tools dropdown img
    • Spreadsheet Charts

      • ChartExpo for Google Sheets
      • ChartExpo for Microsoft Excel
    • Power BI Charts

      • Power BI Custom Visuals by ChartExpo
    • Word Cloud

  • Charts dropdown img
    • Chart Category

      • Bar Charts
      • Circle Graphs
      • Column Charts
      • Combo Charts
      • Comparison Charts
      • Line Graphs
      • PPC Charts
      • Sentiment Analysis Charts
      • Survey Charts
    • Chart Type

      • Box and Whisker Plot
      • Clustered Bar Chart
      • Clustered Column Chart
      • Comparison Bar Chart
      • Control Chart
      • CSAT Survey Bar Chart
      • CSAT Survey Chart
      • Dot Plot Chart
      • Double Bar Graph
      • Funnel Chart
      • Gauge Chart
      • Likert Scale Chart
      • Matrix Chart
      • Multi Axis Line Chart
      • Overlapping Bar Chart
      • Pareto Chart
      • Radar Chart
      • Radial Bar Chart
      • Sankey Diagram
      • Scatter Plot Chart
      • Slope Chart
      • Sunburst Chart
      • Tornado Chart
      • Waterfall Chart
      • Word Cloud
    • Google Sheets
      Microsoft Excel
  • Services
  • Pricing
  • Contact us
  • Blog
  • Support dropdown img
      • Gallery
      • Videos
      • Contact us
      • FAQs
      • Resources
    • Please feel free to contact us

      atsupport@chartexpo.com

Categories
All Data Visualizations Data Analytics Surveys
Add-ons/
  • Google Sheets
  • Microsoft Excel
  • Power BI
All Data Visualizations Data Analytics Surveys
Add-ons
  • Google Sheets
  • Microsoft Excel
  • Power BI

We use cookies

This website uses cookies to provide better user experience and user's session management.
By continuing visiting this website you consent the use of these cookies.

Ok

ChartExpo Survey


Home > Blog > Google Sheets

Annual Budget Template in Google Sheets: A Visual Guide

Year-end financial surprises are almost always the result of poor tracking during the year itself. Businesses, households, and project teams that use an annual budget template in Google Sheets prevent that problem by building a clear, structured plan before the first dollar is committed.

Annual Budget Template in Google Sheets

The template gives every stakeholder a shared view of income, expenses, and running totals without requiring specialized software or finance training.

This blog explains what the template is, how to build one from the ground up, how to read and analyze its data, and how to keep it accurate across all twelve months for dependable year-round financial control.

What is an Annual Budget Template in Google Sheets?

Definition: An annual budget template in Google Sheets is a twelve-month financial planning spreadsheet that consolidates income sources, expense categories, running totals, and summary data into a single, organized file.

Its core purpose is to give users a full-year financial picture while preserving month-by-month visibility for granular tracking. Finance teams, small businesses, startups, and households all rely on it for structured, long-term planning.

Sometimes called a yearly budget planner, it stores all financial data in one shareable location. The primary advantage is year-round financial clarity.

Where general-purpose spreadsheets fall short, a dedicated annual template for Google Sheets adds formula automation, live collaboration across teams, and direct integration with charting tools for richer analysis.

Why Use an Annual Budget Template in Google Sheets?

A consistent framework for monitoring twelve months of financial data keeps planning organized, targets measurable goals, and makes course corrections timely.

Key reasons teams and individuals rely on it:

  • Tracks yearly income and expenses in one place: Centralizes all revenue and cost data in a single file, much like a small business budget spreadsheet built for structured financial oversight.
  • Breaks annual goals into monthly milestones: Converts large yearly targets into manageable month-by-month projections that are easier to monitor and adjust.
  • Automates totals to reduce miscalculations: Applies SUM and related formulas across all rows and columns so every figure updates without manual recalculation.
  • Supports quick revisions and real-time edits: Lets users update projections on the fly without restructuring the sheet, keeping the file current at all times.
  • Enables forward-looking financial planning: Supports the setting of spending limits and income targets, then uses trend data to project performance in future periods.
  • Promotes cross-team collaboration: Shares live access with stakeholders so budget updates are visible to everyone, functioning much like an operating budget spreadsheet used for coordinated departmental planning.
  • Limits errors from manual data entry: Reduces reliance on hand-keyed figures by automating calculations and enforcing consistent formatting throughout the sheet.

Key Components of a Google Sheets Annual Budget Template

Every well-built annual budget template contains a core set of sections that together produce a complete financial picture.

Key components include:

  • Income categories (e.g., salary, business revenue): Captures all revenue sources so the template can compute total yearly earnings accurately, including workforce costs tracked through payroll spreadsheet templates.
  • Expense categories (fixed, variable, discretionary): Groups all spending into logical classifications for cleaner tracking, similar to the structure found in a business expenses spreadsheet.
  • Monthly breakdown section: Spreads projected and actual figures across all twelve months so seasonal patterns and cost fluctuations become visible.
  • Totals and summaries: Calculates monthly subtotals and cumulative annual figures automatically, so the financial position is always current.
  • Charts or graphs for visualization: Converts raw data into bar charts, pie charts, or Waterfall Charts so trends and variances are immediately interpretable.
  • Savings or investment trackers: Monitors surplus allocation toward savings goals or long-term investment targets throughout the year.
  • Notes or comments section for assumptions: Stores projection rationale, estimate sources, and adjustment explanations so the file remains auditable and transparent.

Annual Budget Template Examples in Google Sheets

The annual budget template in Google Spreadsheets adapts to a wide range of use cases across industries and personal finance scenarios.

Below are four practical examples:

1. Small Business Annual Budget Breakdown

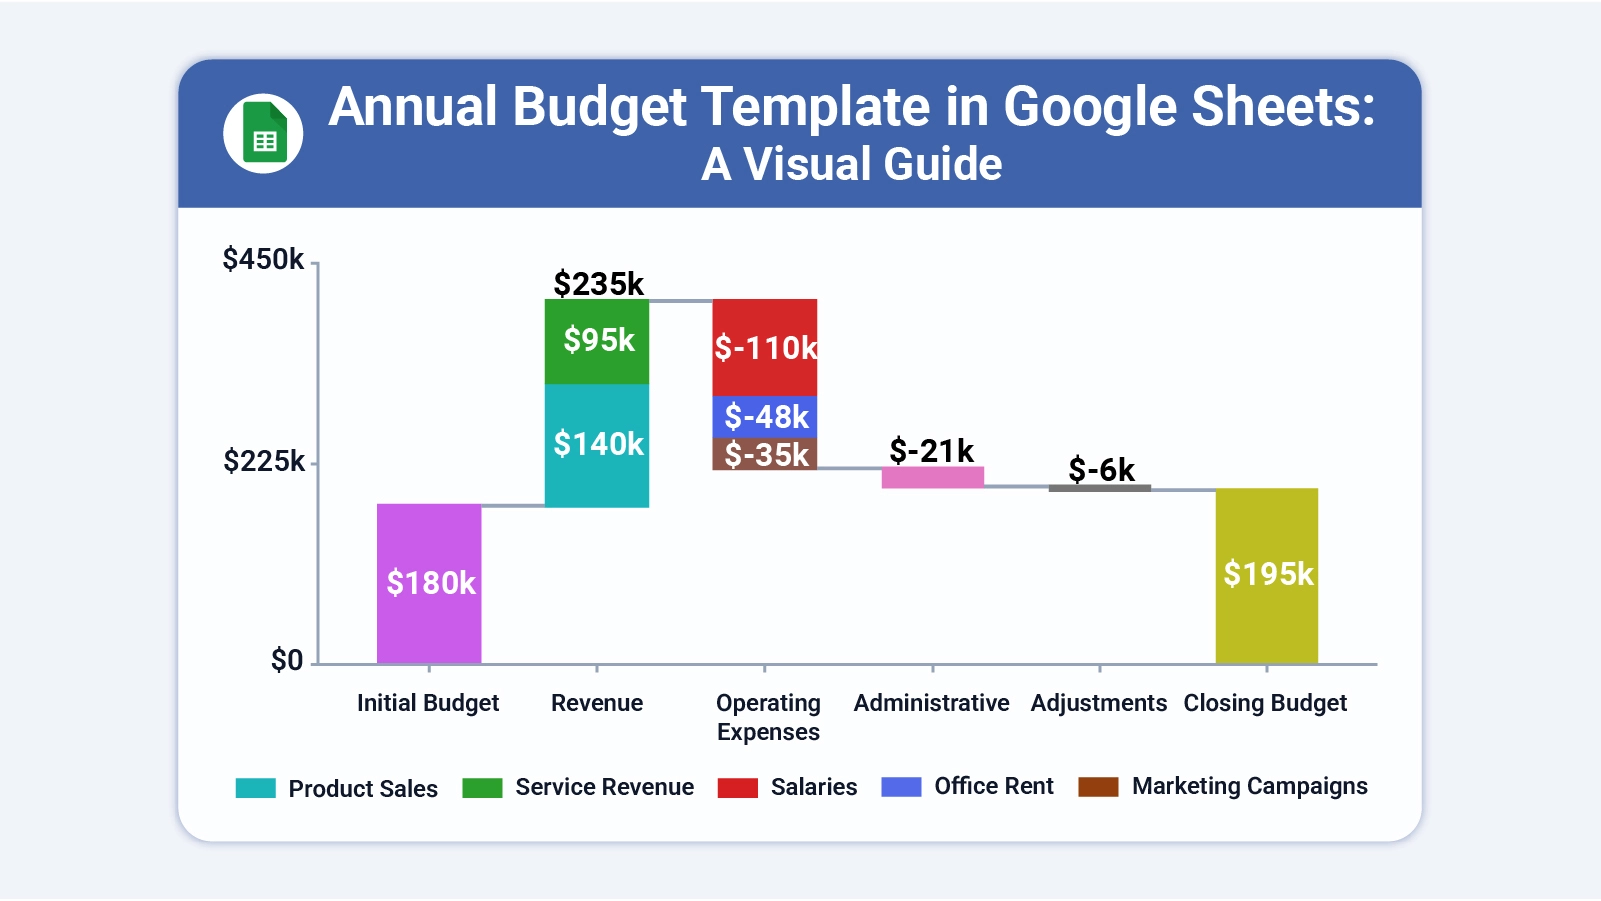
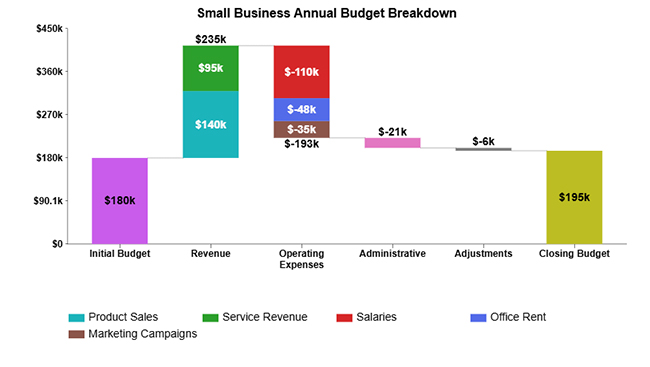
The small business annual budget breakdown shows total revenue of $235k offsetting $220k in costs, producing a $195k closing surplus.

Annual Budget Template in Google Sheets

2. Corporate Operating Budget Breakdown

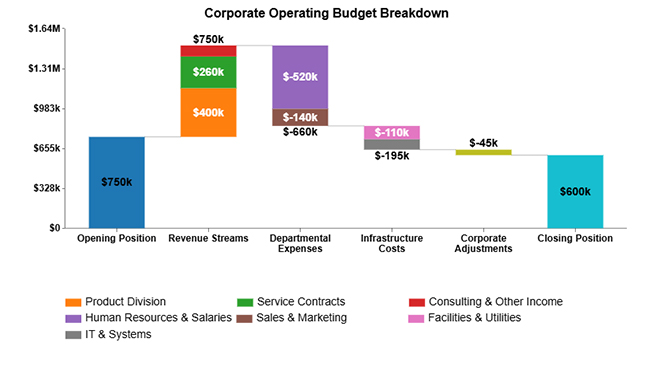
The corporate operating budget breakdown illustrates how $750k in opening funds combined with $750k in revenue absorb $900k in total costs and still yield a $600k closing surplus.

Annual Budget Template in Google Sheets

3. Household Annual Budget Breakdown

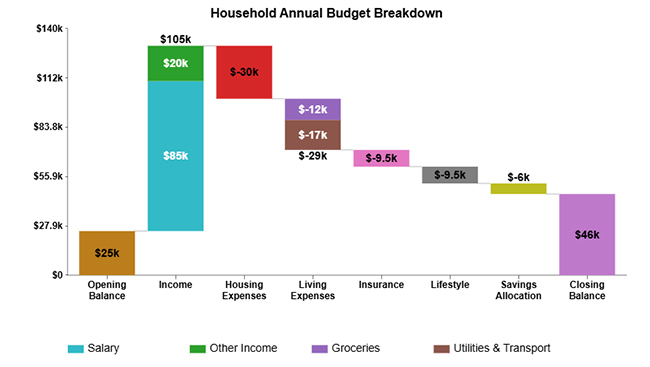
The household annual budget breakdown demonstrates $105k in income covering $84k in expenses, with a $25k starting balance growing to a $46k closing figure.

Annual Budget Template in Google Sheets

4. Project-Based Annual Budget Breakdown

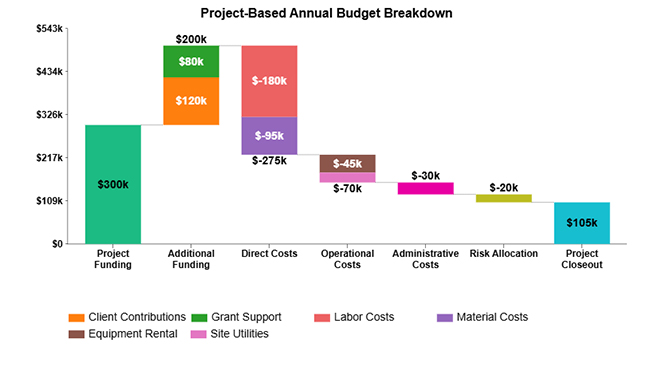
The project-based annual budget breakdown shows $500k in total funding covering $395k in project costs and leaving a $105k balance at closeout.

Annual Budget Template in Google Sheets

How to Create an Annual Budget Template in Google Sheets?

Building an annual budget template in Google Sheets requires a deliberate structure and consistent category logic. A well-organized template automates calculations and delivers a dependable yearly financial overview.

Step 1: Prepare Categories and Sections

Start by defining major sections such as income, fixed expenses, variable expenses, and savings. Create columns for each month (January to December) and add a totals column at the end to summarize yearly figures.

Annual Budget Template in Google Sheets

Step 2: Add Income Sources

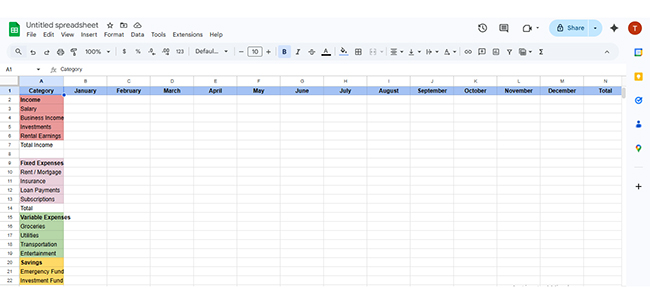
List all expected revenue streams, including salary, business income, investments, or rental earnings. Enter projected monthly amounts to calculate total annual income accurately.

Annual Budget Template in Google Sheets

Step 3: Add Expense Categories

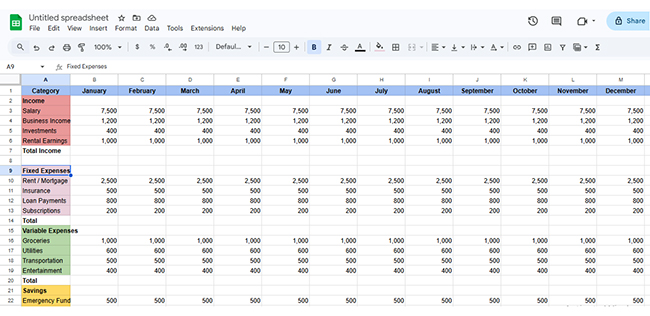
Organize expenses into fixed (rent, utilities), variable (marketing, supplies), and discretionary spending. This categorization improves tracking and financial clarity.

Annual Budget Template in Google Sheets

Step 4: Insert Formulas for Totals

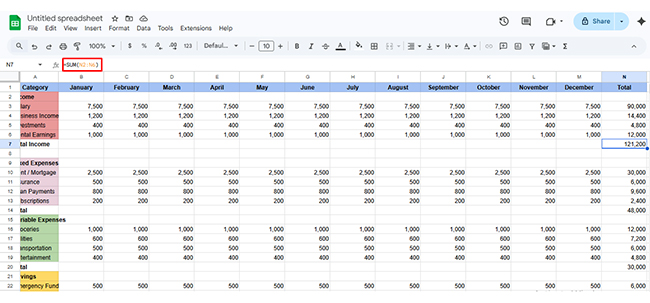
Use SUM formulas to calculate monthly and yearly totals automatically. This ensures accurate calculations and minimizes manual errors.

Annual Budget Template in Google Sheets

Step 5: Add Charts or Visualization (Optional)

Create bar charts, pie charts, or a summary dashboard to visualize income versus expenses and identify trends quickly.

Step 6: Test and Review Calculations

Double-check formulas, validate totals, and compare projections with realistic expectations to ensure your template works accurately throughout the year.

H2: How to Analyze an Annual Budget Template in Google Sheets?

Analyzing an annual budget template in Google Sheets helps you evaluate financial performance, track variances, and optimize spending decisions.

With structured steps, you can turn raw budget data into actionable insights. This process is especially useful for finance teams and small businesses managing structured budgets in Google Sheets.

Step 1: Review and Confirm Budget Structure

Start by verifying that all categories, revenue, and expense fields are correctly formatted and consistent with the template structure.

Step 2: Organize Financial Data

Group income and expenses into clear sections to improve readability, comparison, and overall analysis efficiency.

Step 3: Apply Google Sheets Functions

Use SUM, SUMIF, AVERAGE, and IF functions to calculate totals, variances, and performance indicators across the dataset.

Step 4: Use Filters and Pivot Tables

Apply filters and pivot tables to segment data by category, time period, or department for deeper insights.

Step 5: Visualize Trends with Charts

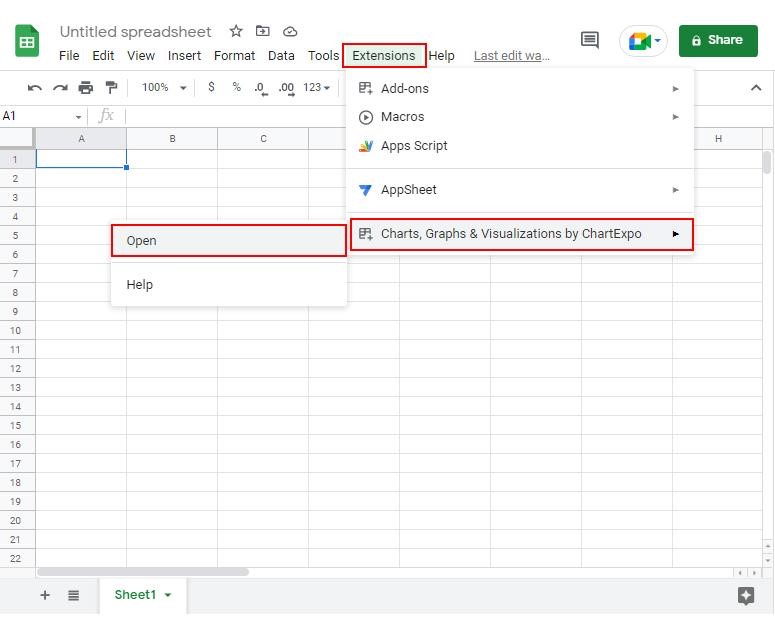
Visualize revenue and expense trends using charts, and for advanced interactive dashboards, use ChartExpo to simplify analysis.

Step 6: Identify Budget Variances

Compare planned vs actual budget to identify variances, cost overruns, and underperforming categories.

Step 7: Adding Final Interpretation Layer

Adding a final layer of interpretation by reviewing all insights and connecting them to the overall financial performance. Refer to the image below for the budget breakdown visualization.

Annual Budget Template in Google Sheets

Key Insights

  • The $235k in revenue pushes the total budget from $180k to $415k before any expenses are deducted.
  • At $193k combined, operating expenses represent the largest cost block, led by the $110k salary figure.
  • Once every cost category is settled, the business retains a $195k closing surplus.

Benefits of Using an Annual Budget Template in Google Sheets

Adopting an annual budget template in Google Sheets creates a foundation for financial stability by keeping data organized and accessible to everyone who needs it.

Key benefits include:

  • Streamlines budget planning: Structures all yearly income and expenses into a single framework that simplifies long-term financial preparation.
  • Improves financial visibility: Delivers a complete view of monthly and annual performance, including variable costs tracked in a travel expenses spreadsheet template.
  • Enables quick adjustments: Allows fast updates whenever income shifts or expense patterns change, keeping projections current without rebuilding the sheet.
  • Facilitates goal tracking: Supports monitoring of savings targets, investment milestones, and spending limits across all twelve months.
  • Encourages accountability: Makes responsibility for each budget line visible to all stakeholders, creating transparency across the organization.
  • Reduces calculation errors: Relies on automated formulas to eliminate manual computation mistakes and maintain accurate financial records.

Tips for Maintaining a Google Sheets Annual Budget Template

Maintaining an annual budget template over time requires consistent habits and periodic review. Follow these best practices:

  • Update monthly or quarterly: Record actual income and expenses on a regular schedule so the budget reflects current financial reality.
  • Keep consistent categories: Avoid renaming or restructuring category labels mid-year to preserve accuracy in year-over-year comparisons.
  • Review and reconcile actuals vs. budget: Compare real figures with projections on a set schedule to identify variances before they become significant problems.
  • Use color coding or formatting for clarity: Apply conditional formatting or color highlights to flag overruns, key figures, or rows requiring immediate attention.
  • Back up and version the file: Save dated copies at regular intervals to prevent data loss and preserve a record of how the budget evolved.
  • Share with relevant stakeholders: Grant controlled access to team members and decision-makers so the budget remains a shared, transparent reference.

FAQs

How do I create an annual budget template in Google Sheets?

Set up income and expense categories, then create one column per month plus a totals column at the end. Apply SUM formulas to each row and column, add summary rows for key totals, and insert a chart to compare projected figures against actual results.

Can I customize a Google Sheets annual budget template?

Yes. You can add or rename categories, insert industry-specific line items, and build a summary dashboard. The template is designed to be flexible so it fits any business or personal financial structure.

Is it free to use an annual budget template in Google Sheets?

Yes. Creating and maintaining an annual budget template in Google Sheets requires only a Google account. The file is free to build, edit, and share with anyone who has access.

Wrap Up

Sound financial management depends on a system that captures every dollar, surfaces trends early, and keeps all stakeholders aligned throughout the year.

An annual budget template in Google Sheets delivers exactly that by combining structured data entry, formula automation, and shareable access in a single file that the whole team can view and update in real time.

Pair that foundation with a capable visualization tool, and the budget becomes more than a record of past spending. It becomes a forward-looking resource that supports faster decisions, clearer reporting to stakeholders, and measurable, month-by-month progress toward every financial goal you set for the year.

How much did you enjoy this article?

GSAd1
Start Free Trial!
160640

Related articles

next previous
Google Sheets6 min read

Best Graph to Show Profit and Loss in Google Sheets

Learn the best graph to show profit and loss with practical examples and use cases. Discover how to visualize your business data, track trends, and make smarter financial decisions.

Google Sheets5 min read

How to Create a Sankey Diagram in Google Sheets?

Learn how to create a Sankey diagram in Google Sheets to visualize flows such as customer journeys, energy transfers, and cash movements for deeper insights and analysis.

Google Sheets12 min read

Google Sheets Accounting Template: Insights Made Simple

Google Sheets Accounting Template organize finances, track expenses, and simplify reporting without costly software. Start managing smarter today!

Google Sheets13 min read

Google Spreadsheet Templates: You Can Use Today

Google spreadsheet templates simplify tracking, planning, and reporting. Click here to learn how to use them with examples, tips, visual tools, and more.

Google Sheets6 min read

Google Sheets Pie Chart: A Complete Visual Guide

Transform data into clear visuals with a Google Sheets Pie Chart. Learn setup steps, customization tricks, and tips to create charts that communicate fast.

ChartExpo logo

Turn Data into Visual
Stories

CHARTEXPO

  • Home
  • Gallery
  • Videos
  • Services
  • Pricing
  • Contact us
  • FAQs
  • Privacy policy
  • Terms of Service
  • Sitemap

TOOLS

  • ChartExpo for Google Sheets
  • ChartExpo for Microsoft Excel
  • Power BI Custom Visuals by ChartExpo
  • Word Cloud

CATEGORIES

  • Bar Charts
  • Circle Graphs
  • Column Charts
  • Combo Charts
  • Comparison Charts
  • Line Graphs
  • PPC Charts
  • Sentiment Analysis Charts
  • Survey Charts

TOP CHARTS

  • Sankey Diagram
  • Likert Scale Chart
  • Comparison Bar Chart
  • Pareto Chart
  • Funnel Chart
  • Gauge Chart
  • Radar Chart
  • Radial Bar Chart
  • Sunburst Chart
  • see more
  • Scatter Plot Chart
  • CSAT Survey Bar Chart
  • CSAT Survey Chart
  • Dot Plot Chart
  • Double Bar Graph
  • Matrix Chart
  • Multi Axis Line Chart
  • Overlapping Bar Chart
  • Control Chart
  • Slope Chart
  • Clustered Bar Chart
  • Clustered Column Chart
  • Box and Whisker Plot
  • Tornado Chart
  • Waterfall Chart
  • Word Cloud
  • see less

RESOURCES

  • Blog
  • Resources
  • YouTube
SIGN UP FOR UPDATES

We wouldn't dream of spamming you or selling your info.

© 2026 ChartExpo, all rights reserved.