• Home
  • Tools dropdown img
    • Spreadsheet Charts

      • ChartExpo for Google Sheets
      • ChartExpo for Microsoft Excel
    • Power BI Charts

      • Power BI Custom Visuals by ChartExpo
    • Word Cloud

  • Charts dropdown img
    • Chart Category

      • Bar Charts
      • Circle Graphs
      • Column Charts
      • Combo Charts
      • Comparison Charts
      • Line Graphs
      • PPC Charts
      • Sentiment Analysis Charts
      • Survey Charts
    • Chart Type

      • Box and Whisker Plot
      • Clustered Bar Chart
      • Clustered Column Chart
      • Comparison Bar Chart
      • Control Chart
      • CSAT Survey Bar Chart
      • CSAT Survey Chart
      • Dot Plot Chart
      • Double Bar Graph
      • Funnel Chart
      • Gauge Chart
      • Likert Scale Chart
      • Matrix Chart
      • Multi Axis Line Chart
      • Overlapping Bar Chart
      • Pareto Chart
      • Radar Chart
      • Radial Bar Chart
      • Sankey Diagram
      • Scatter Plot Chart
      • Slope Chart
      • Sunburst Chart
      • Tornado Chart
      • Waterfall Chart
      • Word Cloud
    • Google Sheets
      Microsoft Excel
  • Services
  • Pricing
  • Contact us
  • Blog
  • Support dropdown img
      • Gallery
      • Videos
      • Contact us
      • FAQs
      • Resources
    • Please feel free to contact us

      atsupport@chartexpo.com

Categories
All Data Visualizations Data Analytics Surveys
Add-ons/
  • Google Sheets
  • Microsoft Excel
  • Power BI
All Data Visualizations Data Analytics Surveys
Add-ons
  • Google Sheets
  • Microsoft Excel
  • Power BI

We use cookies

This website uses cookies to provide better user experience and user's session management.
By continuing visiting this website you consent the use of these cookies.

Ok

ChartExpo Survey


Home > Blog > Google Sheets

Small Business Budget Spreadsheet: A Complete Guide

Have you created a small business budget template yet? It might feel sudden, but every business owner eventually faces the same question. But many entrepreneurs push it aside until cash flow problems hit.

Small Business Budget Spreadsheet

The truth is that nearly 82% of small businesses that fail cite poor money management as a key factor. A structured budget can prevent that.

Think about the decisions you make every day. Hiring one more employee, stocking up inventory, and expanding into a new location. Without a small business budget template, those decisions turn into risky guesses.

A spreadsheet lays out numbers that tell the story of your business. It shows where money is earned, where it is lost, and where it could be invested.

Now, consider the power of pairing budgeting with business analytics. Data-driven decisions cut waste and boost growth. A template becomes more than a document. It becomes a tool that guides each step with clarity. And clarity in a small business is priceless.

So ask yourself again. Do you have a small business budget template that is working for you? If not, now is the moment to start. This blog will give you examples, practical advice, and best practices. What you’ll discover could be the turning point in how you view and manage money.

Let’s get started.

Table of Contents:

  1. What is a Small Business Budget Template in Google Sheets?
  2. Why is a Small Business Budget Spreadsheet Important in Google Sheets?
  3. Examples of Small Business Budget Sheet in Google Sheets
  4. How to Create a Small Business Budget Template in Google Sheets?
  5. How to Analyze a Small Business Budget Template in Google Sheets?
  6. How to Download and Use a Small Business Budget Template in Google Sheets?
  7. Pros and Cons of a Small Business Budget Template in Google Spreadsheet
  8. Best Practices of Small Business Finance Spreadsheet
  9. FAQs
  10. Wrap Up

What is a Small Business Budget Template in Google Sheets?

Definition: A small business budget template in Google Sheets is a ready-made spreadsheet that helps organize income and expenses. It provides small businesses with a straightforward way to track finances without advanced software.

The template can show patterns in spending and reveal growth opportunities.

When paired with business forecasting, a small business budget template helps plan with confidence. Some templates also include a Google Sheet profit and loss template to make reporting easier.

This way, you gain clear financial insights into performance. It reduces guesswork and enhances decision-making. A budget in Google Sheets is flexible, shareable, and always accessible online.

Why is a Small Business Budget Spreadsheet Important in Google Sheets?

Money often feels unpredictable in a small business. One month is strong, the next feels uncertain. Without structure, expenses rise quietly, and cash flow shrinks fast.

That is where a small business budget spreadsheet in Google Sheets steps in. It brings order to the numbers and provides a solid foundation for every decision.

How?

  • Clarity in finances: A budget spreadsheet organizes income and expenses in one view. This makes it easier to see where money is coming from and where it is going.
  • Cash flow tracking: Monitoring inflows and outflows ensures owners avoid shortages. It also helps identify patterns that affect stability.
  • Goal setting and progress: Budgets enable setting targets for growth. Tracking against these goals shows whether the business is on the right path.
  • Easy collaboration: With Google Sheets, multiple people can access the same file. This keeps everyone updated and aligned without extra emails.
  • Avoiding surprises: A spreadsheet highlights risks before they become crises. Planning reduces stress and improves decision-making.

Examples of Small Business Budget Sheet in Google Sheets

Every small business runs on numbers. Some track them well, while others scramble when tax season arrives. The truth is, a small business budget sheet in Google Sheets can turn messy records into clear financial snapshots.

It is simple to use, easy to share, and keeps everyone on the same page. Let’s look at some practical examples that make managing money far less stressful:

  • Operating Budget Spreadsheet: This tracks day-to-day expenses and income. It keeps regular operations balanced and prevents overspending.
  • Google Sheet Profit and Loss Template: It shows total revenue against costs. You see if the business is truly making money or losing it.
  • Payroll Template in Google Sheets: Paying employees becomes accurate and consistent. Salaries, deductions, and benefits are recorded in one place.
  • Construction Budget Spreadsheet: This one is perfect for project-based businesses. It organizes labor, material, and overhead costs in one sheet.
  • Budget Deficit by Year Graph: This visualizes how spending compares with earnings. It helps you spot financial gaps before they grow larger.

How to Create a Small Business Budget Template in Google Sheets?

Every budget begins with a blank page, but it does not have to stay empty. A small business budget template in Google Sheets brings order and makes financial planning simple.

With a few steps, you can create a system that highlights cash flow and provides steady business insights. Numbers then shift from being confusing to becoming tools that drive smarter choices.

Follow these steps to build one:

  1. Open Google Sheets and navigate to the Template Gallery: This section offers ready-made budget options. Using a template saves time and simplifies the setup process.
  2. Start with a Small Business Finance Spreadsheet or from scratch: Templates are beginner-friendly. On the other hand, creating from scratch offers more control. But both lead to accurate and usable results.
  3. Add columns for revenue and expenses: These categories form the backbone of your budget. They separate the money coming in from the money going out.
  4. Add formulas to auto-calculate totals: Let Google Sheets handle the math. This reduces errors and makes financial tracking smooth.
  5. Match visuals with financial insights: Graphs and charts bring data to life. Combined with bookkeeping Spreadsheets for small businesses, they reveal trends that numbers alone might hide.

How to Analyze a Small Business Budget Template in Google Sheets?

Money talks, but spreadsheets often mumble. A small business budget spreadsheet can track every cent, yet raw numbers rarely tell the whole story. So, data analysis thrives on visuals that highlight patterns and expose gaps.

But that is where Google Sheets falls short. Its charts are basic, limited, and often fail to reveal deeper trends. This is a problem when decisions depend on clear insights.

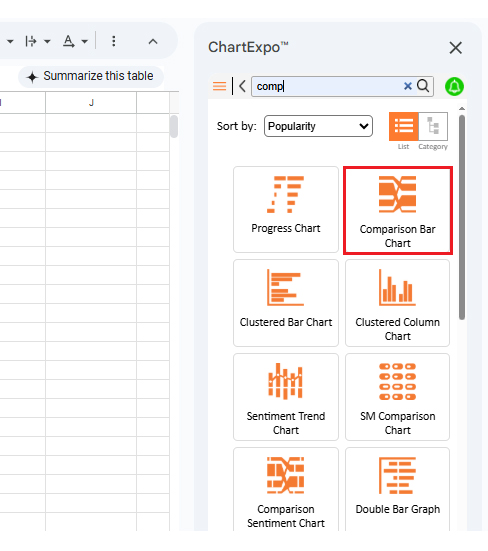
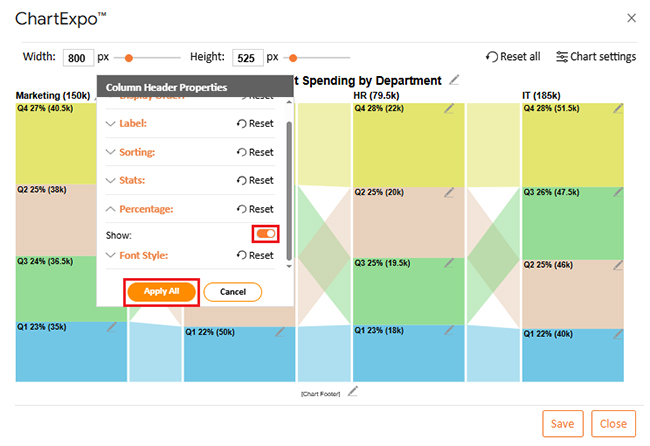
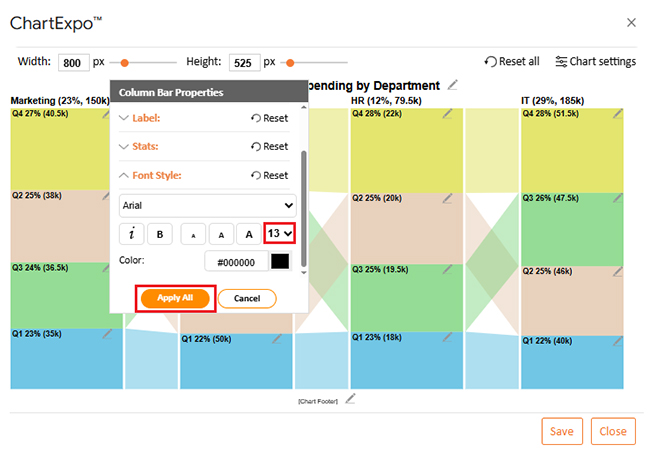
But don’t worry; we have ChartExpo. It transforms simple data into engaging visuals that make numbers easy to understand. With ChartExpo, business data speaks loudly, clearly, and with purpose.

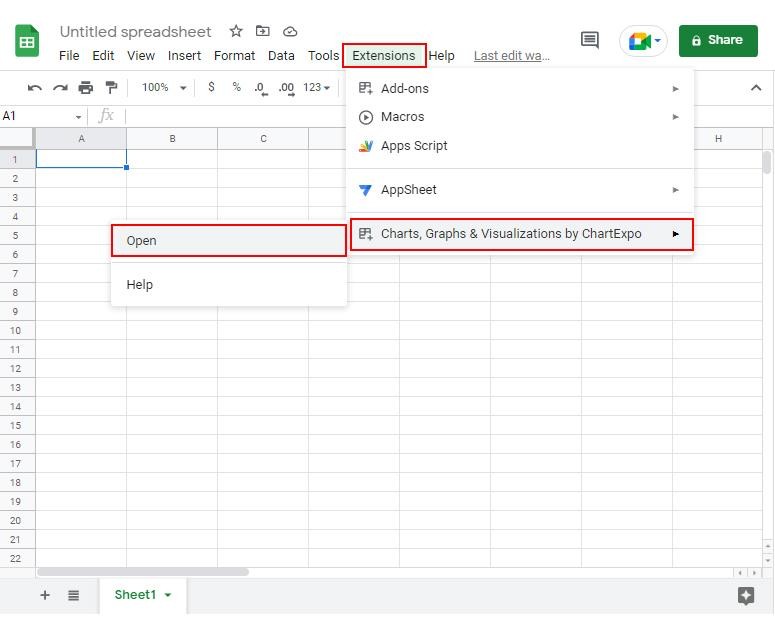
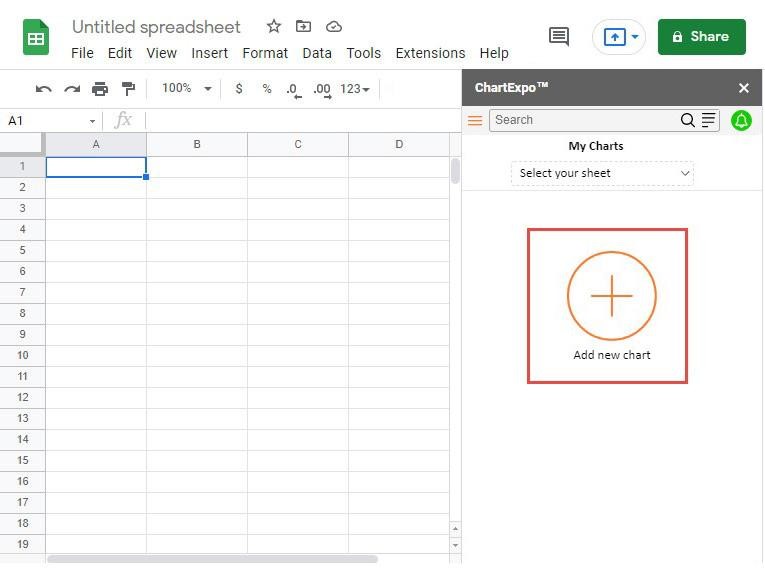
How to Install ChartExpo in Google Sheets?

  1. To start using ChartExpo, download it directly from the Google Sheets program. To do this, select Extensions from the top toolbar.
  2. A menu will appear. Click the Get add-ons option.
  3. Search for ChartExpo, and click on Charts, Graphs & Visualizations by ChartExpo when it appears in the results.
  4. Click the Install button. You will have to confirm your Google account and accept some permissions.

ChartExpo charts are available both in Google Sheets and Microsoft Excel. Please use the following CTAs to install the tool of your choice and create beautiful visualizations in a few clicks in your favorite tool.

Example

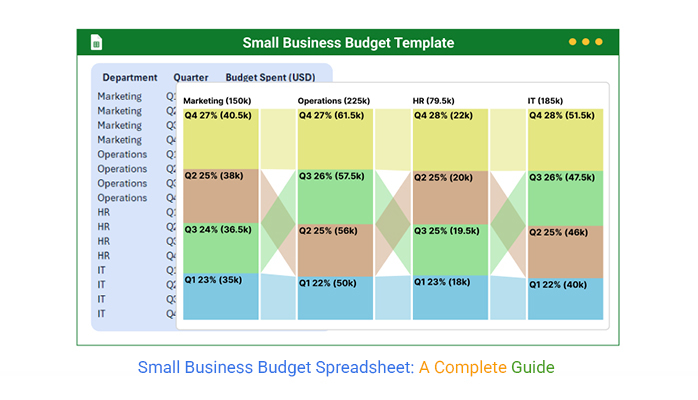
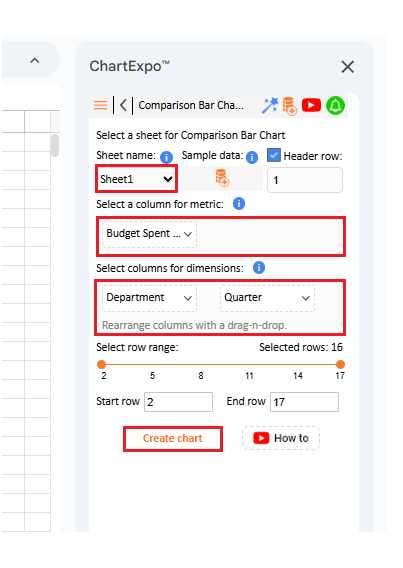
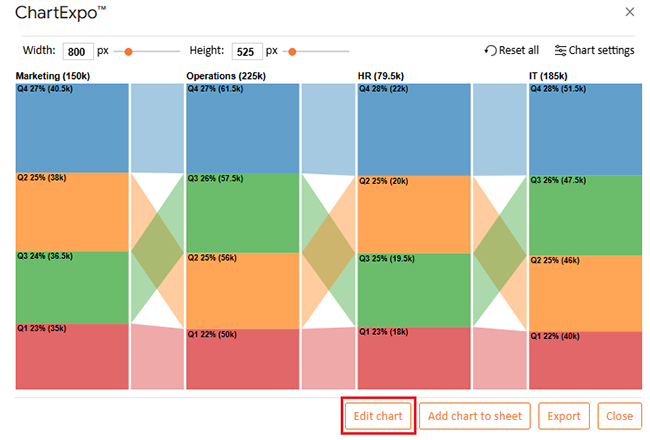
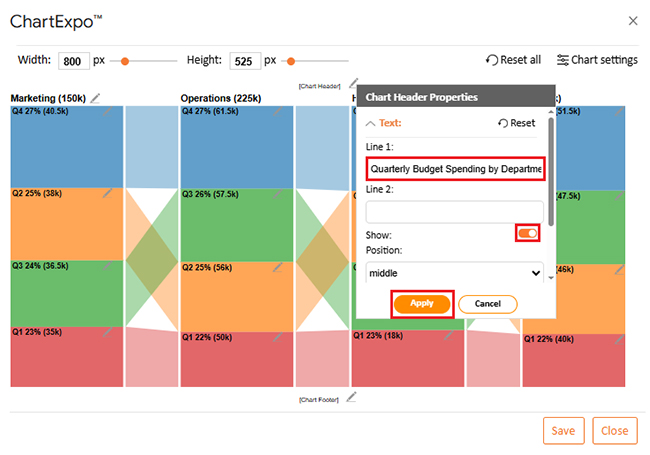
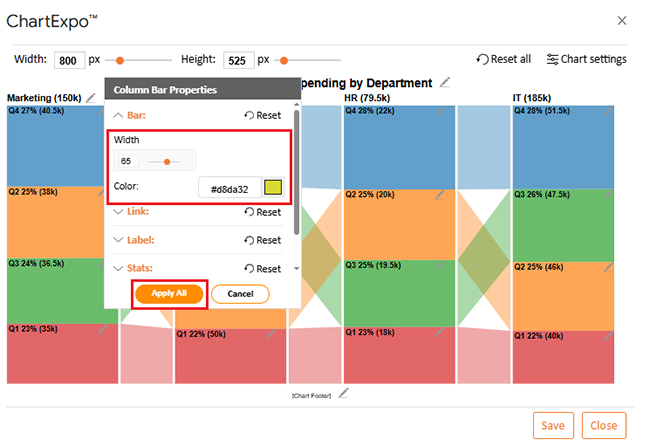
Let’s visualize and analyze this sample data in Google Sheets using ChartExpo.

Department

Quarter

Budget Spent (USD)

Marketing Q1 35,000
Marketing Q2 38,000
Marketing Q3 36,500
Marketing Q4 40,500
Operations Q1 50,000
Operations Q2 56,000
Operations Q3 57,500
Operations Q4 61,500
HR Q1 18,000
HR Q2 20,000
HR Q3 19,500
HR Q4 22,000
IT Q1 40,000
IT Q2 46,000
IT Q3 47,500
IT Q4 51,500
  • To get started with ChartExpo, install ChartExpo in Google Sheets.
  • Go to Extensions > Charts, Graphs & Visualizations by ChartExpo > Open.
Small Business Budget Spreadsheet
  • To access the charts library, click the Add new chart button.
Small Business Budget Spreadsheet
  • Once ChartExpo is loaded. Click on “Comparison Bar Chart”.
Small Business Budget Spreadsheet
  • Select the sheet holding your data and select the Metric option. Fill in the numerical value.
  • Select the Dimensions button and fill in the dimensional data
  • Click the Create chart button to complete the process.
Small Business Budget Spreadsheet
  • Your tabular data will turn into a Comparison Bar chart, as shown below.
Small Business Budget Spreadsheet
  • To change the chart’s title, click the pencil icon next to the Chart Header.
  • It will open the properties dialog. Under the Text section, you can add a heading in Line 1 and enable the Show option. Give the appropriate title of your chart and click the Apply button.
Small Business Budget Spreadsheet
  • You can change the bar color as follows:
Small Business Budget Spreadsheet
  • You can show the percentage on the label as follows:
Small Business Budget Spreadsheet
  • You can increase font size for better readability from “Font Style” also:
Small Business Budget Spreadsheet
  • Click the “Save” button:
Small Business Budget Spreadsheet
  • Your final chart will appear as follows.
Small Business Budget Spreadsheet

Insights

  • Operations: Has the largest share at 35%, growing steadily each quarter as the primary cost center.
  • IT: Second largest at 29%, with Q4 at 28% showing substantial year-end tech investments.
  • Marketing: Holds 23%, peaking in Q4 at 27% due to seasonal campaigns.
  • HR: Smallest share at 12%, steady across quarters, reflecting stable workforce costs.

How to Download and Use a Small Business Budget Template in Google Sheets?

Budgeting does not have to feel complicated. With a small business budget template in Google Sheets, you can get organized in minutes. No expensive software.

No steep learning curve. Just a simple tool that keeps income and expenses clear. The best part is you can download it for free and start using it right away.

Here is how you do it:

  1. Go to Google Sheets Template Gallery: Open Google Sheets, click on “Template Gallery”, and browse the options. You will find ready-to-use business templates.
  2. Select a Small Business Budget Template: Pick a template that matches your needs. You can constantly adjust it later.
  3. Customize revenue and expense categories: Edit the labels to match your business. This makes the spreadsheet more accurate and relevant.
  4. Add your data: Enter income, expenses, and recurring costs. The sheet updates totals automatically.
  5. Use it for ongoing planning: Treat it as a living document. Regular updates give you clearer business insights and stronger control over cash flow.

Pros and Cons of a Small Business Budget Template in Google Spreadsheet

Every tool has strengths and weaknesses, and a small business budget template in Google Spreadsheet is no different. It can save time, organize numbers, and support planning. But it also has limitations worth noting.

Pros:

  • Easy to access online and share with your team: Since it is cloud-based, you can open it anywhere and allow others to collaborate in real time. This makes teamwork and financial tracking smoother.
  • Free to use and simple to customize: Google provides templates at no cost. You can edit them to match your business needs.
  • Provides quick business insights when updated regularly: Entering accurate data helps highlight spending patterns. This leads to smarter financial decisions.

Cons:

  • Limited charts and visuals for deep analysis: Google Sheets has only basic visualization tools. It struggles to reveal trends clearly.
  • Errors can happen if formulas are entered incorrectly: A single mistake can distort totals. This affects accuracy and planning.
  • May not scale well for businesses with very complex data: As transactions grow, spreadsheets can become cluttered. At that point, advanced tools might be needed.

Best Practices of Small Business Finance Spreadsheet

A small business finance spreadsheet works best with structure and consistency. Using it correctly ensures reliable numbers and better financial planning. Here is how to make the most of it:

  • Keep categories simple: Divide income and expenses into clear groups. Simple categories reduce confusion and speed up tracking.
  • Update often: Record transactions weekly or monthly. Frequent updates make your business metrics more reliable.
  • Use formulas wisely: Automate calculations like totals and percentages. This saves time and reduces human errors.
  • Add visuals when possible: Graphs and charts help spot patterns faster. They turn raw data into practical business insights.
  • Review and adjust: Budgets change with business conditions. Regular reviews help you stay flexible and in control.

FAQs

How do I create a budget for my small business?

  • List all income sources.
  • Track expenses in detail.
  • Use a small business budget spreadsheet.
  • Apply formulas for totals.
  • Review business insights often.
  • Adjust based on business metrics.

What is the 50/30/20 rule on a budget template?

The 50/30/20 rule splits money into three parts:

  • 50% goes to essential needs.
  • 30% is for wants and growth opportunities.
  • 20% is saved or used for debt repayment.

Use a small business budget spreadsheet to make tracking simple.

Wrap Up

Budgeting is the language of business survival. A small business budget spreadsheet provides structure to financial decisions. It makes growth possible and mistakes avoidable. Numbers become clear, and choices become smarter.

Think of a construction budget Spreadsheet. It keeps every project aligned with costs and timelines. Without it, overruns and confusion take control. With it, financial order is maintained.

Visual tools bring even more clarity. A budget deficit by year graph shows gaps and strengths over time. It highlights areas that need attention. Trends are easier to act on when they are visible.

Reports also play a significant role. A Google Sheet profit and loss template summarizes performance in one place. Income and expenses balance into a single view, and business owners can finally see if their work is paying off.

Employee costs are equally important. A payroll template in Google Sheets makes salaries and deductions manageable. Accuracy builds trust with staff. It also prevents errors that drain resources.

Every spreadsheet provides lessons. Those lessons turn into financial insights that shape the future. However, Google Sheets has limitations in displaying these insights. That is where ChartExpo steps in. It transforms raw data into powerful visuals.

So, do not hesitate. Install ChartExpo today and start using it. Your budget deserves more than numbers. It deserves stories that guide success.

How much did you enjoy this article?

GSAd1
Start Free Trial!
158285

Related articles

next previous
Google Sheets13 min read

Real Estate Investment Spreadsheet for Property Insights

A real estate investment spreadsheet tracks income, expenses, and ROI. This blog offers sample templates and tips to enhance property investment decisions.

Google Sheets13 min read

Sales Projection Template in Google Sheets for Clear Insights

A sales projection template helps predict revenue with clarity. Learn best practices, examples, and tips in Google Sheets to improve planning and growth.

Google Sheets11 min read

Google Sheets Apps for Presentable Insights

Google Sheets apps boost productivity with smarter data handling. Click here to learn how to use them for better charts, faster analysis, and smarter decisions.

Google Sheets14 min read

Google Sheets Query Function: A Visual Approach

The Google Sheets query function filters and analyzes data fast. Click here to learn the syntax with examples and best practices to boost your data analysis.

Google Sheets14 min read

Google Sheets Automation: Practical Use Cases

Google Sheets automation helps you save time and reduce errors with smart tools. Learn how to automate, analyze, and visualize your data with ease.

ChartExpo logo

Turn Data into Visual
Stories

CHARTEXPO

  • Home
  • Gallery
  • Videos
  • Services
  • Pricing
  • Contact us
  • FAQs
  • Privacy policy
  • Terms of Service
  • Sitemap

TOOLS

  • ChartExpo for Google Sheets
  • ChartExpo for Microsoft Excel
  • Power BI Custom Visuals by ChartExpo
  • Word Cloud

CATEGORIES

  • Bar Charts
  • Circle Graphs
  • Column Charts
  • Combo Charts
  • Comparison Charts
  • Line Graphs
  • PPC Charts
  • Sentiment Analysis Charts
  • Survey Charts

TOP CHARTS

  • Sankey Diagram
  • Likert Scale Chart
  • Comparison Bar Chart
  • Pareto Chart
  • Funnel Chart
  • Gauge Chart
  • Radar Chart
  • Radial Bar Chart
  • Sunburst Chart
  • see more
  • Scatter Plot Chart
  • CSAT Survey Bar Chart
  • CSAT Survey Chart
  • Dot Plot Chart
  • Double Bar Graph
  • Matrix Chart
  • Multi Axis Line Chart
  • Overlapping Bar Chart
  • Control Chart
  • Slope Chart
  • Clustered Bar Chart
  • Clustered Column Chart
  • Box and Whisker Plot
  • Tornado Chart
  • Waterfall Chart
  • Word Cloud
  • see less

RESOURCES

  • Blog
  • Resources
  • YouTube
SIGN UP FOR UPDATES

We wouldn't dream of spamming you or selling your info.

© 2026 ChartExpo, all rights reserved.