• Home
  • Tools dropdown img
    • Spreadsheet Charts

      • ChartExpo for Google Sheets
      • ChartExpo for Microsoft Excel
    • Power BI Charts

      • Power BI Custom Visuals by ChartExpo
    • Word Cloud

  • Charts dropdown img
    • Chart Category

      • Bar Charts
      • Circle Graphs
      • Column Charts
      • Combo Charts
      • Comparison Charts
      • Line Graphs
      • PPC Charts
      • Sentiment Analysis Charts
      • Survey Charts
    • Chart Type

      • Box and Whisker Plot
      • Clustered Bar Chart
      • Clustered Column Chart
      • Comparison Bar Chart
      • Control Chart
      • CSAT Survey Bar Chart
      • CSAT Survey Chart
      • Dot Plot Chart
      • Double Bar Graph
      • Funnel Chart
      • Gauge Chart
      • Likert Scale Chart
      • Matrix Chart
      • Multi Axis Line Chart
      • Overlapping Bar Chart
      • Pareto Chart
      • Radar Chart
      • Radial Bar Chart
      • Sankey Diagram
      • Scatter Plot Chart
      • Slope Chart
      • Sunburst Chart
      • Tornado Chart
      • Waterfall Chart
      • Word Cloud
    • Google Sheets
      Microsoft Excel
  • Services
  • Pricing
  • Contact us
  • Blog
  • Support dropdown img
      • Gallery
      • Videos
      • Contact us
      • FAQs
      • Resources
    • Please feel free to contact us

      atsupport@chartexpo.com

Categories
All Data Visualizations Data Analytics Surveys
Add-ons/
  • Google Sheets
  • Microsoft Excel
  • Power BI
All Data Visualizations Data Analytics Surveys
Add-ons
  • Google Sheets
  • Microsoft Excel
  • Power BI

We use cookies

This website uses cookies to provide better user experience and user's session management.
By continuing visiting this website you consent the use of these cookies.

Ok

ChartExpo Survey


Home > Blog > Data Analytics

Analytics in Telecom Industry for Better Insights

What are analytics in the telecom industry, and what’s the fuss about them? Every call, text, and data session generates information. This data has untapped potential, which only becomes valuable with analytics. Data storytelling transforms these insights into clear, compelling narratives, driving better decision-making.

Analytics in Telecom Industry

Telecom providers rely on analytics to make decisions. They predict network congestion, detect fraud, and improve customer experience. This data discovery helps identify hidden patterns, allowing them to optimize networks and enhance service quality.

Fraud costs telecom companies billions annually. From SIM card cloning to fake calls, criminals exploit network loopholes. Analytics detects unusual patterns, stopping fraud before it spreads. AI-driven tools flag suspicious activity, saving millions in potential losses.

Self-service analytics empower telecom teams to explore data without relying on IT, making insights more accessible. You can track customer preferences to inform personalized plans. Giving customers relevant promotions boosts engagement, increases retention rates, and reduces customer complaints.

The future of telecom depends on analytics. As 5G expands and IoT devices multiply, data volumes will skyrocket. Companies that harness analytics effectively will stay ahead. Those who ignore it risk falling behind.

Let me show you how to stay ahead.

First…

Table of Contents:

  1. What are Telecom Analytics?
  2. Importance of Data Analytics in the Telecom Industry
  3. How Many Types of Telecommunication Analytics?
  4. How Does Data Analytics Work in the Telecom Industry?
  5. How to Analyze the Telecom Industry?
  6. Challenges of Big Data Analytics in Telecom
  7. Use Cases of Telecom Industry Analytics
  8. FAQs
  9. Wrap Up

What are Telecom Analytics?

Definition: Telecom analytics examines data from networks, customers, and operations. It helps improve service, detect fraud, and reduce costs. With analytics, predicting demand and preventing outages becomes easy.

AI for data analytics enhances the customer experience by identifying pain points. AI-driven analysis speeds up fraud detection and resolution. As 5G and IoT grow, data volumes rise. Telecom analytics ensures networks stay efficient, secure, and customer-focused in a competitive industry.

Importance of Data Analytics in the Telecom Industry

Data is the backbone of telecom. Every call, message, and internet session generates valuable insights. Without analytics, companies would struggle to keep up with growing demand. Efficient networks, satisfied customers, and strong security depend on data integrity and data-driven decisions.

Here’s why telecom data analytics are valuable

  • Enhancing network performance: Customers are frustrated by slow connections and missed calls. Analytics help with congestion detection, failure prediction, and real-time performance optimization.
  • Improving customer experience: Customers demand smooth communication. Data analytics helps identify pain points so providers can offer faster, more reliable service.
  • Fraud detection and prevention: Telecom fraud accounts for billions in yearly losses. Analytics detects these strange patterns and enables companies to avoid scams.
  • Revenue optimization and cost reduction: Inefficiencies cannibalize profits. Analytics reveal waste, optimize operations, and increase revenue opportunities.
  • Customer retention and churn prediction: It’s costly to lose a customer. You can use data-driven insights to predict churn and curate personalized offers to keep customers returning.
  • Competitive advantage: The telecom market is highly competitive. Organizations that utilize analytics effectively can keep ahead with better services and more innovative business approaches.

How Many Types of Telecommunication Analytics?

Telecommunication analytics is a game-changer. Combining it with business analytics helps companies make smarter decisions, improve services, and boost profits. But did you know there are different types? Each one serves a unique purpose, giving telecom companies the edge they need:

  1. Network analytics: Think of this as the health checkup for telecom networks. It monitors performance, detects issues, and ensures smooth connections. Slow speeds or dropped calls? Network analytics spots the problem before customers even notice.
  2. Customer analytics: Who are your customers? What do they need? By analyzing data, companies can personalize services, improve customer experience, and boost loyalty. Happy customers = long-term success.
  3. Fraud analytics: Scammers never sleep, but neither do fraud analytics. It tracks unusual activity, detects fraud in real-time, and prevents financial losses. Whether it’s SIM card cloning or identity theft, this system is always on guard.
  4. Revenue and business analytics: Every telecom company wants to grow. Revenue and business analytics help by tracking revenue trends, optimizing pricing strategies, and identifying new business opportunities. Data-driven decisions mean bigger profits and smarter spending.
  5. Operational analytics: Success in telecom depends on efficiency. Operational analytics help streamline processes, reduce downtime, and optimize resource management to boost productivity.

How Does Data Analytics Work in the Telecom Industry?

Telecom generates massive amounts of data every second. Without analytics, this data would be overwhelming and unusable. Visual analytics helps transform complex data into clear insights that improve networks, enhance experiences, and inform smarter decisions.

Here’s how the process works.

  1. Data collection: Every call, text, and internet session generates valuable data. Telecom providers collect this information from network signals, customer interactions, and usage patterns to help ascertain demand and performance.
  2. Data processing and storage: Raw data is complex and unstructured. Advanced systems clean, organize, and store it securely, ensuring it’s ready for accurate analysis.
  3. Data analysis and insights generation: AI and machine learning identify trends, help predict potential problems, and offer recommendations to improve services.
  4. Actionable decision-making: Telecom companies use analytics to improve network utilization, provide individualized plans, and identify fraud before it creates harm.
  5. Continuous improvement: The telecom industry is constantly evolving. Data analytics helps companies refine their strategies, adapt to new challenges, and consistently improve services.

How to Analyze the Telecom Industry?

Data in telecom moves fast. Calls, messages, and data usage create endless numbers to analyze. But staring at spreadsheets won’t reveal the real story. You need data visualization. Why? It turns raw numbers into clear insights.

However, Excel can handle data, but it struggles with advanced visualizations. Complex telecom analytics need more than basic charts.

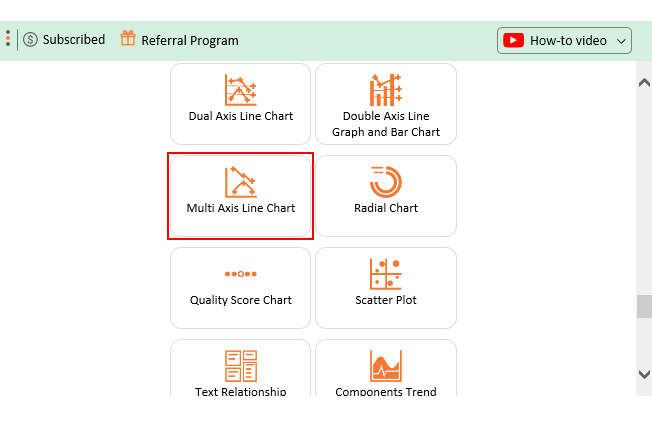
That’s where ChartExpo comes in. It transforms dull data into interactive, easy-to-read visuals. With better graphs and deeper insights, decisions become smarter and faster.

Top 5 Charts created in Excel using ChartExpo for Telecom Analytics

Multi Axis Line Chart

Analytics in Telecom Industry

Sankey Chart

Analytics in Telecom Industry

Progress Circle Chart

Analytics in Telecom Industry

Clustered Stacked Bar Chart

Analytics in Telecom Industry

Likert Scale Chart

Analytics in Telecom Industry

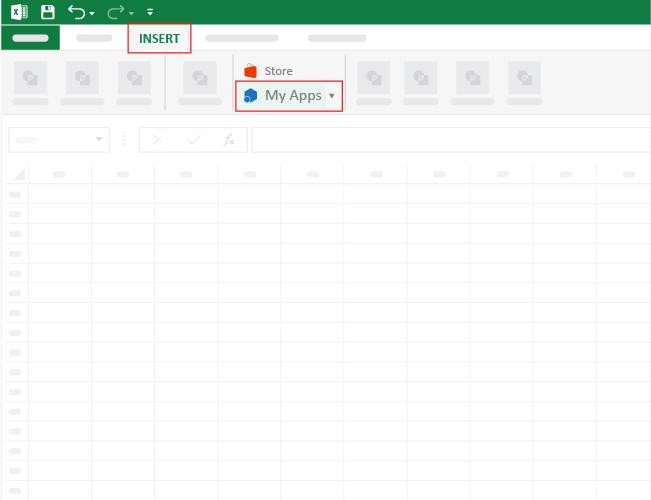
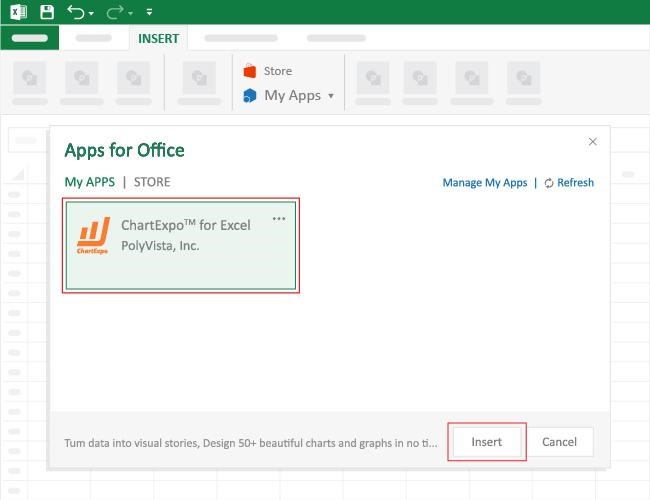
How to Install ChartExpo in Excel?

  1. Open your Excel application.
  2. Open the worksheet and click the “Insert” menu.
  3. You’ll see the “My Apps” option.
  4. In the Office Add-ins window, click “Store” and search for ChartExpo on the My Apps Store.
  5. Click the “Add” button to install ChartExpo in your Excel.

ChartExpo charts are available both in Google Sheets and Microsoft Excel. Please use the following CTAs to install the tool of your choice and create beautiful visualizations with a few clicks in your favorite tool.

Example

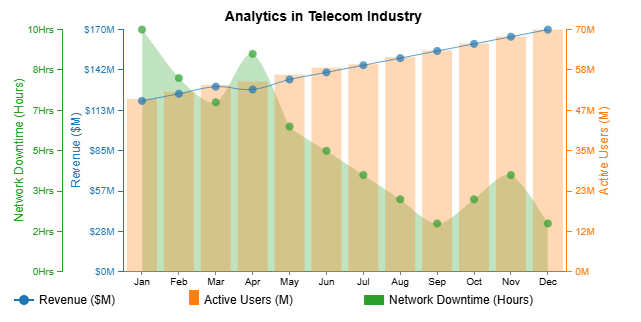
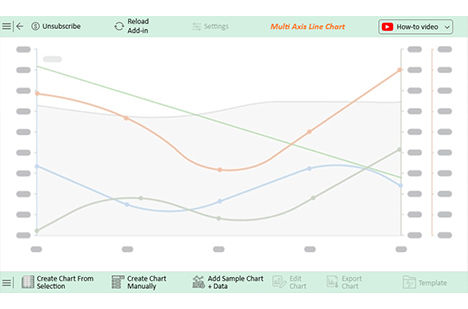
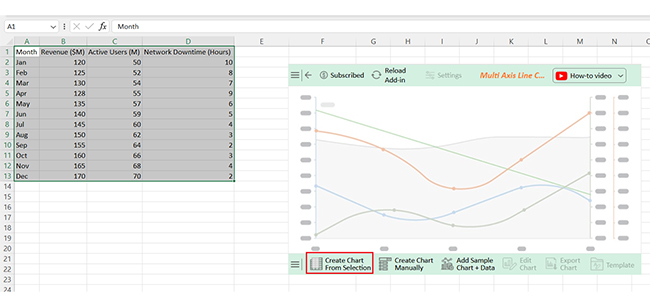
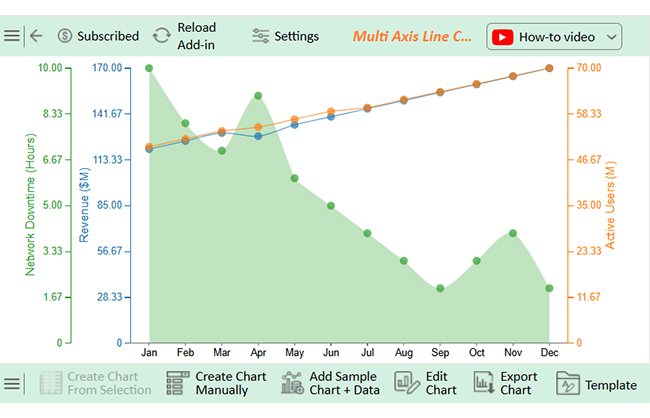
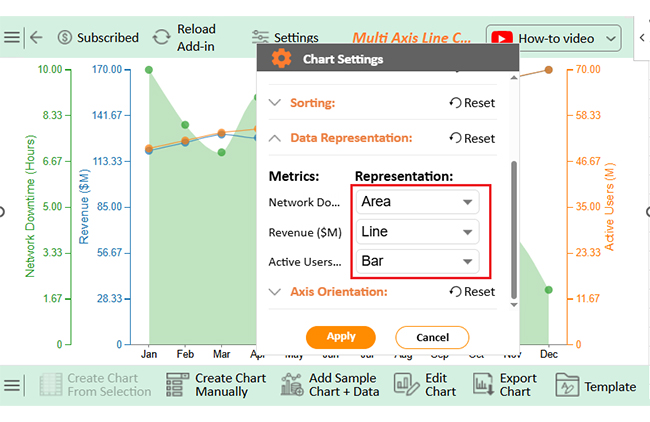
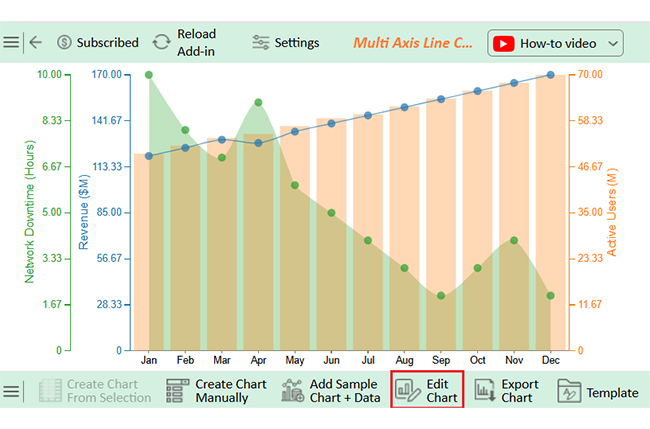
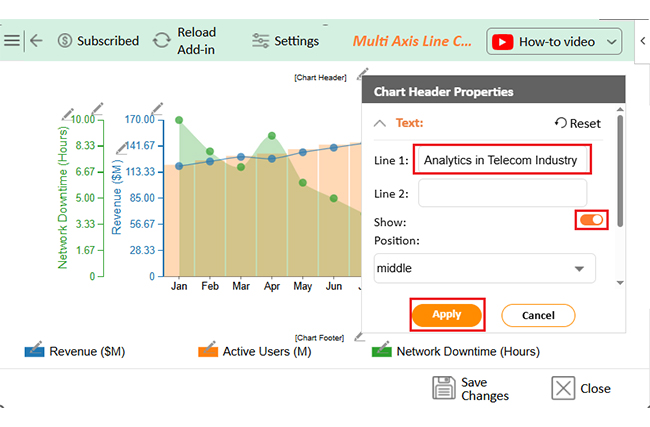
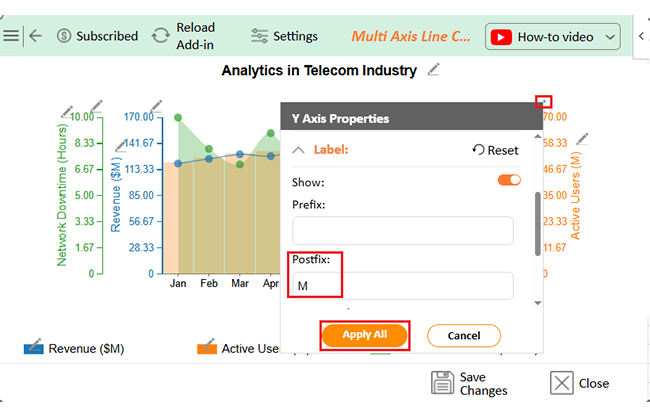
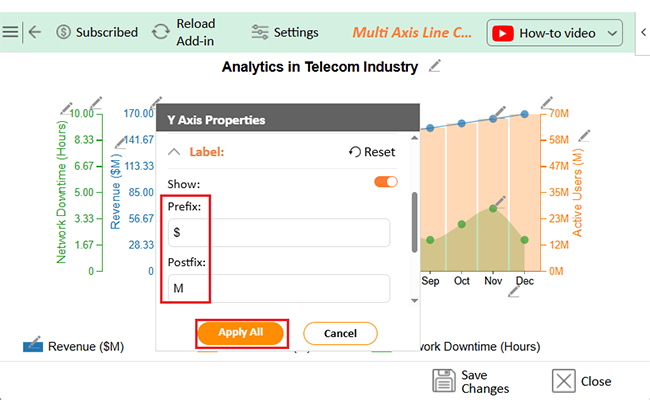
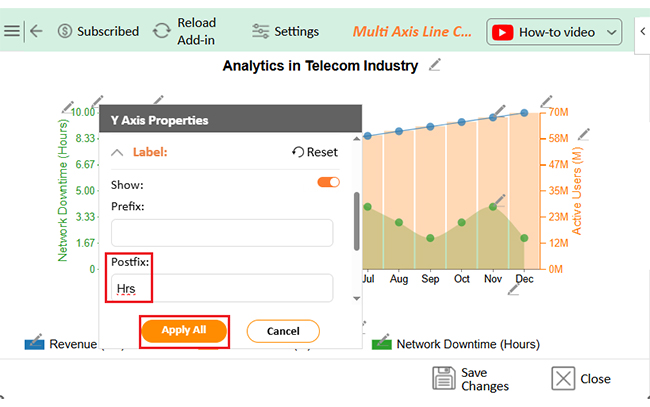
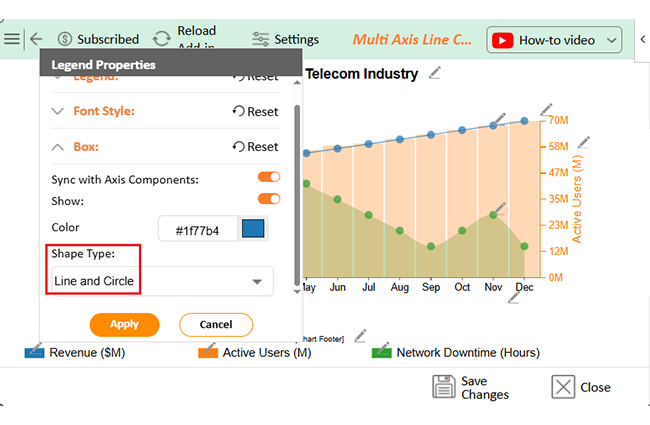
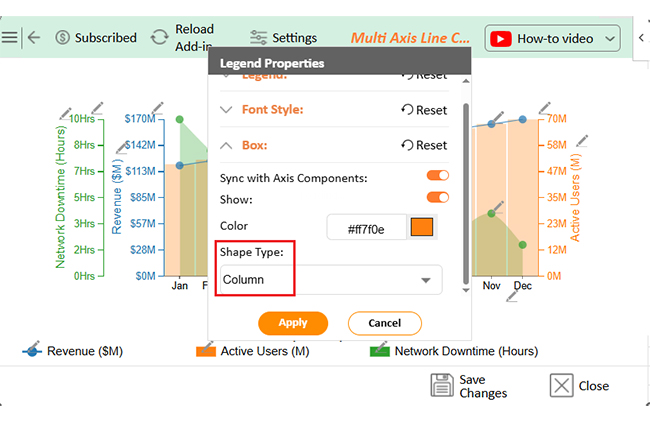
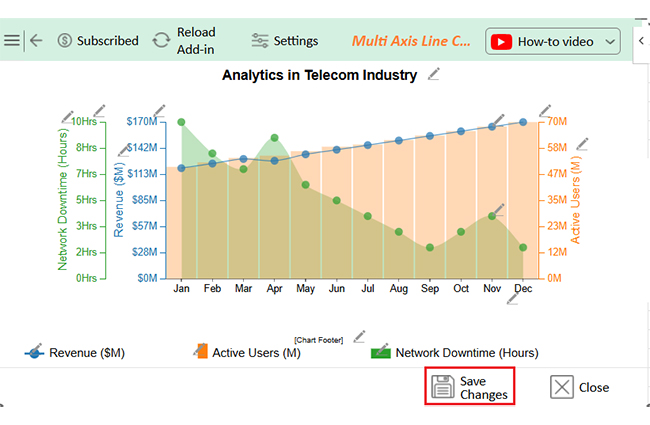
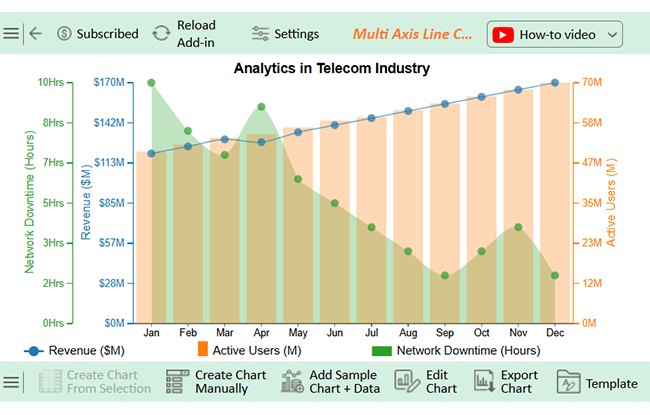
Let’s analyze this sample data in Excel using ChartExpo.

Month Revenue ($M) Active Users (M) Network Downtime (Hours)
Jan 120 50 10
Feb 125 52 8
Mar 130 54 7
Apr 128 55 9
May 135 57 6
Jun 140 59 5
Jul 145 60 4
Aug 150 62 3
Sep 155 64 2
Oct 160 66 3
Nov 165 68 4
Dec 170 70 2
  • To get started with ChartExpo, install ChartExpo in Excel.
  • Now, click on My Apps from the INSERT menu.
Analytics in Telecom Industry
  • Choose ChartExpo from My Apps, then click Insert.
Analytics in Telecom Industry
  • Once it loads, scroll through the charts list to locate and choose the “Multi Axis Line Chart”.
Analytics in Telecom Industry
  • You will see a Multi-Axis Line Chart on the screen.
Analytics in Telecom Industry
  • Click the “Create Chart From Selection” button after selecting the data from the sheet, as shown.
Analytics in Telecom Industry
  • ChartExpo will generate the visualization below for you.
Analytics in Telecom Industry
  • Click on Settings and change the “Data Representation” as follows.
Analytics in Telecom Industry
  • If you want to add anything to the chart, click the Edit Chart button:
Analytics in Telecom Industry
  • Click the pencil icon next to the Chart Header to change the title.
  • It will open the properties dialog. Under the Text section, you can add a heading in Line 1 and enable Show.
  • Give the appropriate title of your chart and click the Apply button.
Analytics in Telecom Industry
  • You can change the value of Active Users Precision to zero and add (M) as Postfix with values as follows:
Analytics in Telecom Industry
  • You can add the dollar sign with Revenue as a Prefix, (M) as a postfix, and change the precision value to zero as follows:
Analytics in Telecom Industry
  • You can add the Hours sign with Network Downtime and also change the precision value to zero as follows:
Analytics in Telecom Industry
  • Change the Legend shape of Revenue into Line and Circle, and click the “Apply” button:
Analytics in Telecom Industry
  • Change the Legend shape of Active Users into a Column and click the “Apply” button:
Analytics in Telecom Industry
  • Click the “Save Changes” button to persist the changes made to the chart.
Analytics in Telecom Industry
  • Your final Multi Axis Line Chart will look like the one below.
Analytics in Telecom Industry

Insights

  • Steady growth: Telecom revenue and user numbers continue to rise, signaling market expansion.
  • Better reliability: Network downtime is decreasing, improving overall service stability.
  • Higher revenue: More active users lead to increased earnings for providers.
  • Seasonal trend: Downtime fluctuations suggest regular maintenance schedules.
  • Customer impact: Enhanced reliability helps reduce churn and boost satisfaction.

Challenges of Big Data Analytics in Telecom

Big data is a goldmine for telecom companies, but digging through it isn’t easy. Digital analytics helps process and interpret this data efficiently. However, with millions of users generating massive amounts of data every second, challenges are everywhere.

Let’s break down the biggest roadblocks.

  • Data volume and complexity: A telecom network generates petabytes of data daily. Such vast amounts of data require advanced tools and infrastructure to manage, store, and analyze.
  • Data security and privacy: Customer data is sensitive. A single breach can lead to massive fines and lost trust. Protecting personal information while complying with strict regulations is a constant balancing act.
  • Real-time processing: Delays in data analysis impact the quality of service. Telecom providers require rapid, AI-driven systems that can process information on the fly.
  • Integration with legacy systems: Many older infrastructures were not built for modern analytics. Additionally, integrating new technology with legacy systems can be expensive and complex.
  • High implementation costs: Building and maintaining advanced analytics platforms requires significant investment. Companies need to balance long-term benefits with expenses to stay profitable.

Use Cases of Telecom Industry Analytics

Telecom runs on speed, efficiency, and reliability. Without analytics, networks become inefficient, fraud goes undetected, and customers leave for better service. Telecom companies use data analytics to stay ahead, improve performance, and increase profits. Here’s how it’s done:

  • Network optimization: Strong, reliable networks are essential for seamless communication. Analytics helps detect congestion, predict failures, and enhance coverage to ensure uninterrupted service.
  • Customer experience management: Personalized experiences improve customer satisfaction. Data-driven insights allow telecom providers to offer tailored plans, resolve issues proactively, and deliver seamless connectivity.
  • Fraud detection and prevention: AI-powered analytics identify suspicious patterns, detect anomalies, and prevent fraudulent activities in real-time.
  • Churn prediction and retention: Losing customers impacts revenue and growth. Predictive analytics helps identify who is likely to leave and enables targeted retention strategies to improve loyalty.
  • Revenue assurance and billing optimization: Billing errors can damage customer trust and financial stability. Analytics ensures accurate billing, detects revenue leaks, and optimizes pricing models for maximum profitability.

FAQs

What is the role of analytics in telecommunication?

Analytics in telecommunication helps optimize networks, enhance customer experience, and detect fraud. It improves service quality by predicting issues and reducing downtime. Data insights drive better decision-making, increase revenue, and reduce churn. Telecom companies rely on analytics to stay competitive and efficient.

How big is the telecom analytics market?

The telecom analytics market was valued at approximately $4.2 billion in 2020. Experts project it will reach around $9.8 billion by 2025, growing at a compound annual growth rate (CAGR) of 18.5%. This growth reflects the increasing importance of data analytics in the telecommunications industry.

Wrap Up

Analytics in the telecom industry turns data into actionable insights. It helps companies improve networks, detect fraud, and enhance customer experiences. Without data analytics, managing massive data volumes would be impossible.

Strong networks keep customers connected. Data analysis detects congestion, predicts failures, and ensures smooth performance. Faster, more reliable service leads to higher satisfaction.

Fraud prevention is a significant challenge. Scammers exploit network vulnerabilities, resulting in significant financial losses. Data and analytics services help spot unusual activity, stopping fraud before it spreads.

Customer retention is another key focus. Data insights help predict churn and create personalized offers. Satisfied customers stay longer and contribute to steady revenue.

Revenue optimization keeps telecom businesses profitable. Analytics identifies new income streams, reduces waste, and improves billing accuracy. Better financial management leads to long-term success.

Telecom analytics is the future. As data volumes grow, companies must invest in more innovative tools. Those that embrace analytics will stay ahead in an increasingly competitive market.

Pro tip: Install ChartExpo to transform complex telecom data into clear, actionable insights.

How much did you enjoy this article?

GSAd1
Start Free Trial!
150711

Related articles

next previous
Data Analytics7 min read

Financial Forecasting for Startups: A Complete Guide

This guide dives deep into financial forecasting for startups. You'll also discover elements of a financial projection for a startup, and tips for creating one.

Data Analytics32 min read

Data Reporting: Making Your Reports Irresistible

Data reporting turns numbers into insights that guide decisions. Learn how to simplify complex data and make confident choices. Read on for key strategies!

Data Analytics10 min read

Employee Performance KPIs: Insights That Drive Action

Employee performance KPIs track productivity and success. Learn the key metrics, measurement methods, and analysis techniques to boost performance.

Data Analytics27 min read

Prescriptive Analytics: From Forecasts to Fixes

Prescriptive analytics helps you turn data into action. Learn how it improves decision-making, drives results, and supports smarter strategies. Get started!

Data Analytics32 min read

Predictive Analytics: See What's Coming Before It Happens

Predictive analytics helps businesses cut costs, reduce risks, and act fast when it matters most. Want results that stick? Predictive analytics works—read on!

ChartExpo logo

Turn Data into Visual
Stories

CHARTEXPO

  • Home
  • Gallery
  • Videos
  • Services
  • Pricing
  • Contact us
  • FAQs
  • Privacy policy
  • Terms of Service
  • Sitemap

TOOLS

  • ChartExpo for Google Sheets
  • ChartExpo for Microsoft Excel
  • Power BI Custom Visuals by ChartExpo
  • Word Cloud

CATEGORIES

  • Bar Charts
  • Circle Graphs
  • Column Charts
  • Combo Charts
  • Comparison Charts
  • Line Graphs
  • PPC Charts
  • Sentiment Analysis Charts
  • Survey Charts

TOP CHARTS

  • Sankey Diagram
  • Likert Scale Chart
  • Comparison Bar Chart
  • Pareto Chart
  • Funnel Chart
  • Gauge Chart
  • Radar Chart
  • Radial Bar Chart
  • Sunburst Chart
  • see more
  • Scatter Plot Chart
  • CSAT Survey Bar Chart
  • CSAT Survey Chart
  • Dot Plot Chart
  • Double Bar Graph
  • Matrix Chart
  • Multi Axis Line Chart
  • Overlapping Bar Chart
  • Control Chart
  • Slope Chart
  • Clustered Bar Chart
  • Clustered Column Chart
  • Box and Whisker Plot
  • Tornado Chart
  • Waterfall Chart
  • Word Cloud
  • see less

RESOURCES

  • Blog
  • Resources
  • YouTube
SIGN UP FOR UPDATES

We wouldn't dream of spamming you or selling your info.

© 2025 ChartExpo, all rights reserved.