Categories
Every organization operating in a distributed environment needs reliable data to guide workforce decisions. Remote work statistics translate employee behavior into measurable patterns, giving leaders the clarity to act on evidence rather than intuition.
From productivity shifts to communication trends, these figures capture dimensions of work that are otherwise invisible to managers and difficult to evaluate without a structured approach.
In this guide, you will discover how to interpret, analyze, and present remote work data effectively. You will also explore practical tools that transform raw numbers into visual insights, making complex findings far easier to communicate, share, and act on across any organization.
Definition: Remote work statistics are measurable data points that describe how employees function, communicate, and deliver results outside a conventional office setting.
These figures convert daily workforce activities into quantifiable signals that reveal operational patterns and behavioral tendencies. Companies use them to track efficiency, gauge engagement, and determine whether distributed work models are producing their intended outcomes.
Unlike basic attendance logs, work-from-home statistics examine deeper indicators such as output volume, schedule consistency, and the rhythm of team communication.
When these metrics are analyzed carefully, they expose productivity shifts, uncover hidden friction points, and provide the evidence organizations need to build smarter, more adaptive workforce policies.
Any leader managing a distributed workforce depends on dependable performance data. Remote work statistics provide that clarity, particularly when findings are translated into statistical graphs that make complex trends accessible at a glance.
Building an accurate understanding of work-from-home statistics begins with knowing what each data type actually measures. Every category illuminates a different aspect of distributed work and plays a distinct role in effective data analysis in Google Sheets.
Remote work compatibility varies considerably across professions, with certain fields naturally suited to distributed arrangements and others requiring some level of in-person coordination, especially when teams rely on strong Google Sheets functionality for reporting.
Data becomes most actionable when converted to visual form. Turning distributed workforce metrics into charts exposes performance patterns that raw numbers alone fail to communicate clearly to decision-makers.
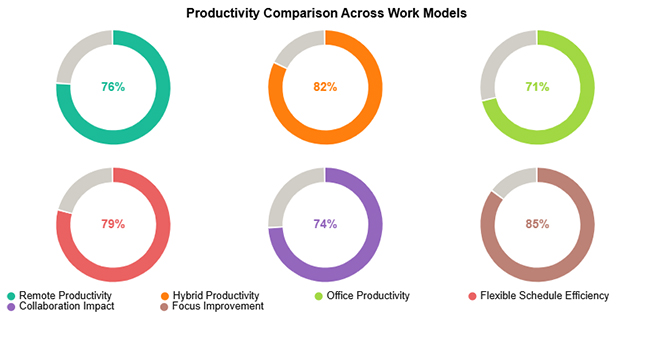
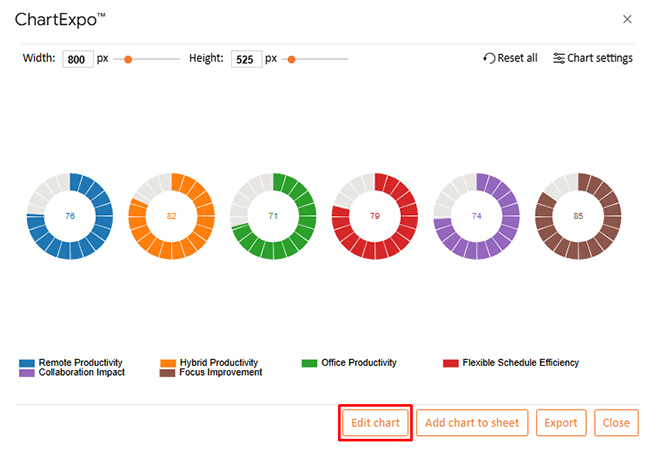
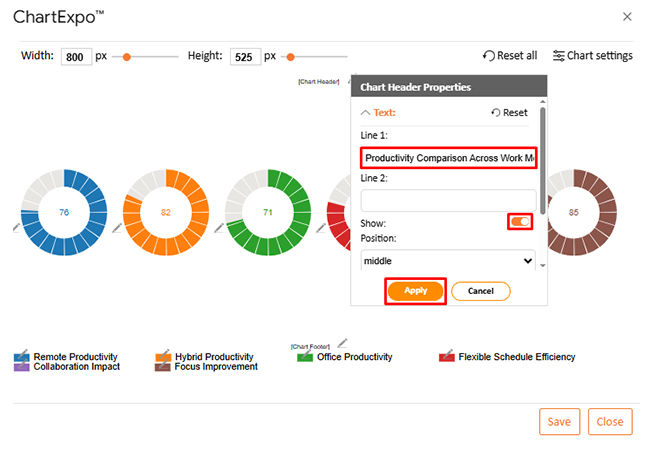
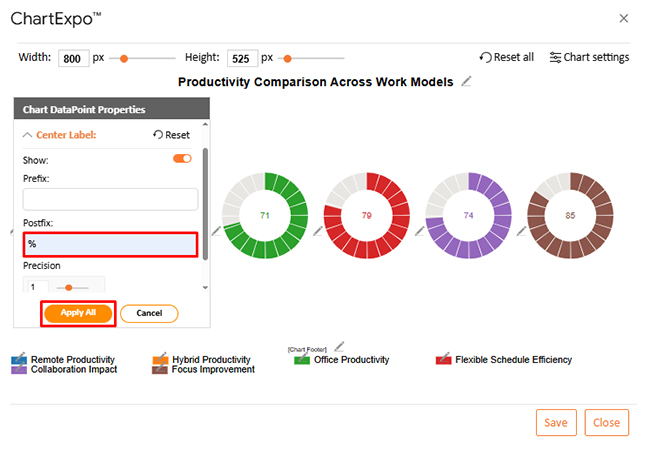
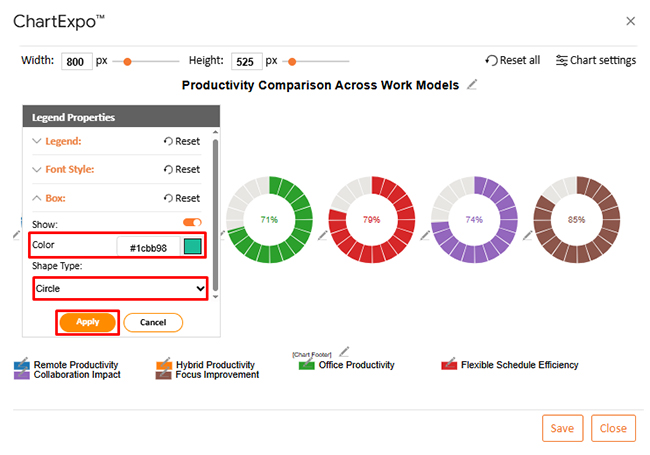
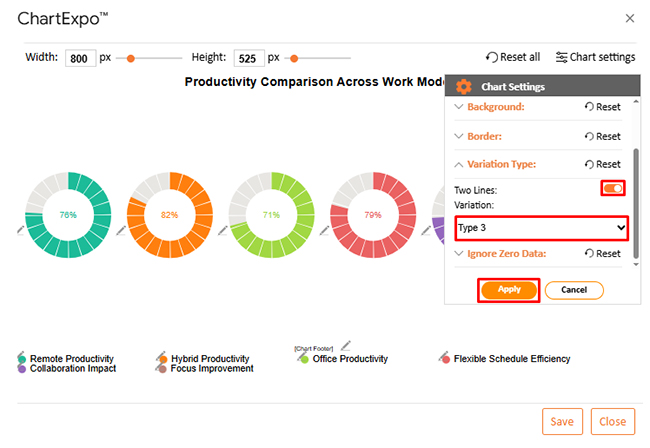
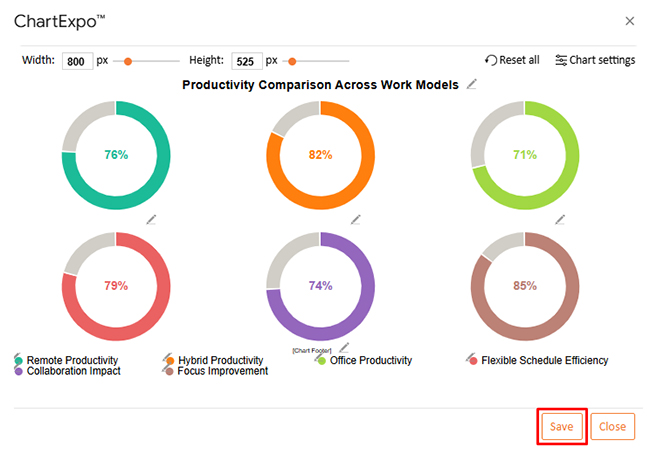
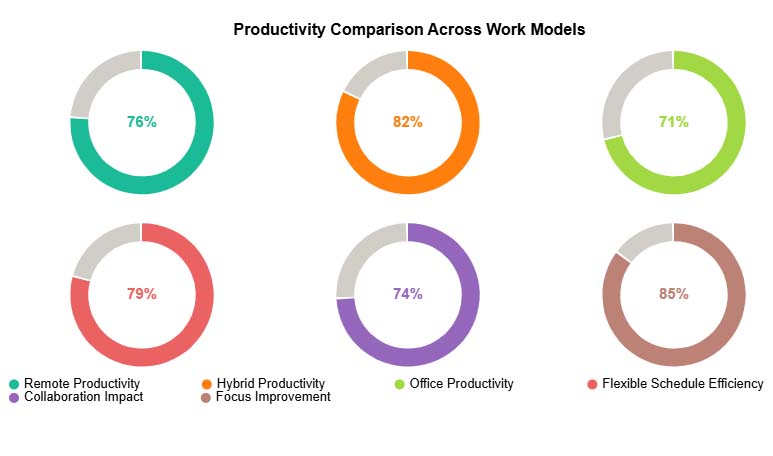
The Productivity Comparison Across Work Models chart shows that hybrid arrangements deliver the strongest productivity outcomes, with schedule flexibility and reduced-distraction focus time contributing most significantly.
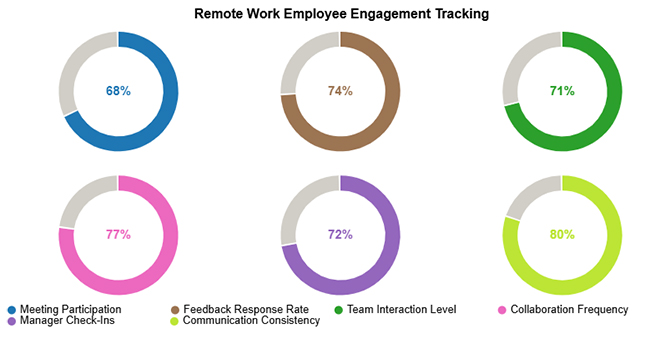
The Remote Work Employee Engagement Tracking chart shows that communication consistency and collaboration frequency drive the highest engagement, while attendance at regular meetings contributes comparatively less.
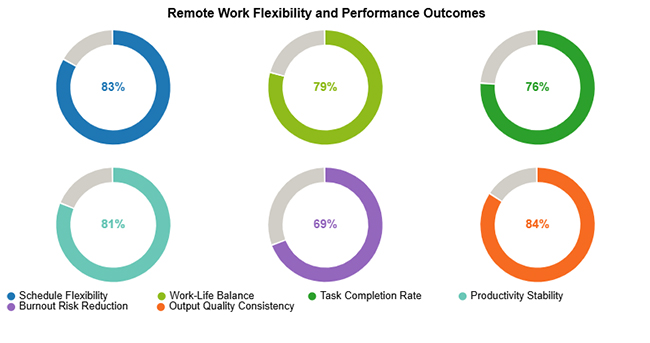
The Remote Work Flexibility and Performance Outcomes chart shows that schedule control and output quality are the top performance drivers, while reducing burnout risk scores lower overall.
Analyzing remote work stats effectively with a spreadsheet tool becomes far more manageable when a clear, structured workflow guides the process from start to finish.
ChartExpo deepens this analysis by converting complex metric sets into interactive, easy-to-navigate visualizations. Applying Google Sheets tips and tricks alongside ChartExpo streamlines the reporting process and sharpens analytical output.
Why use ChartExpo?
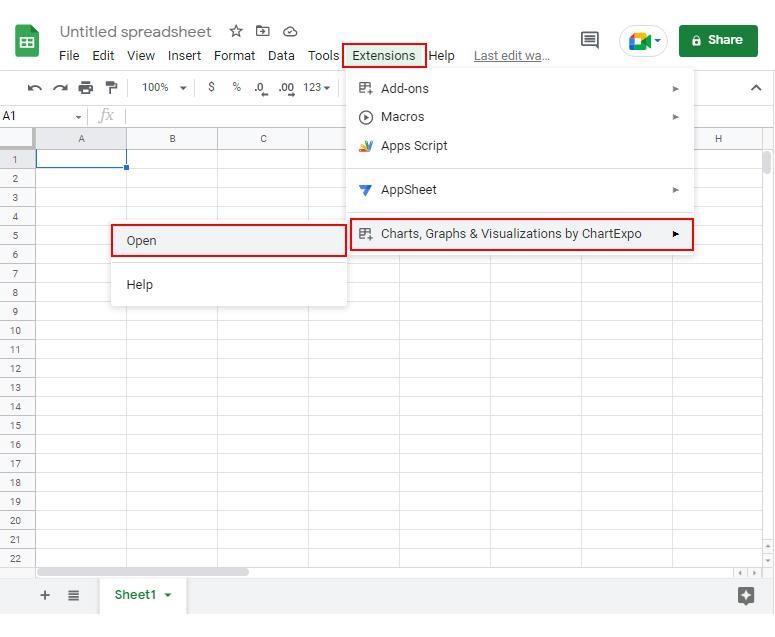
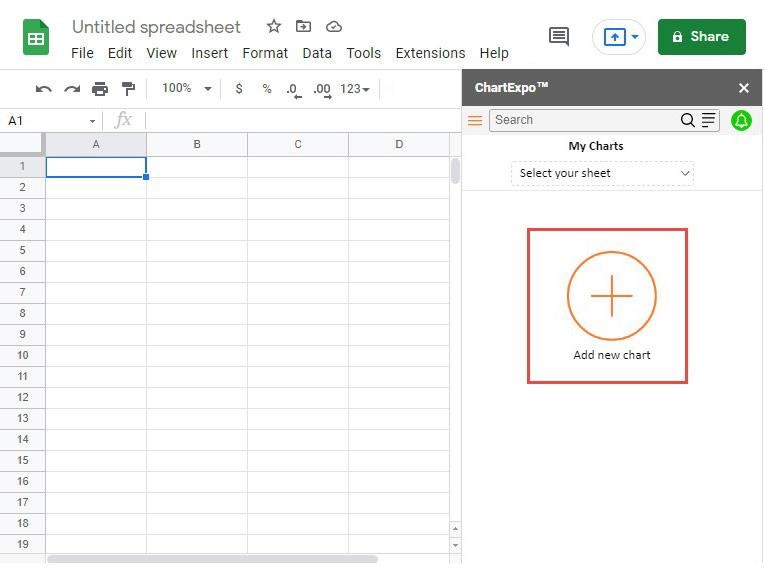
How to install ChartExpo in Google Sheets?
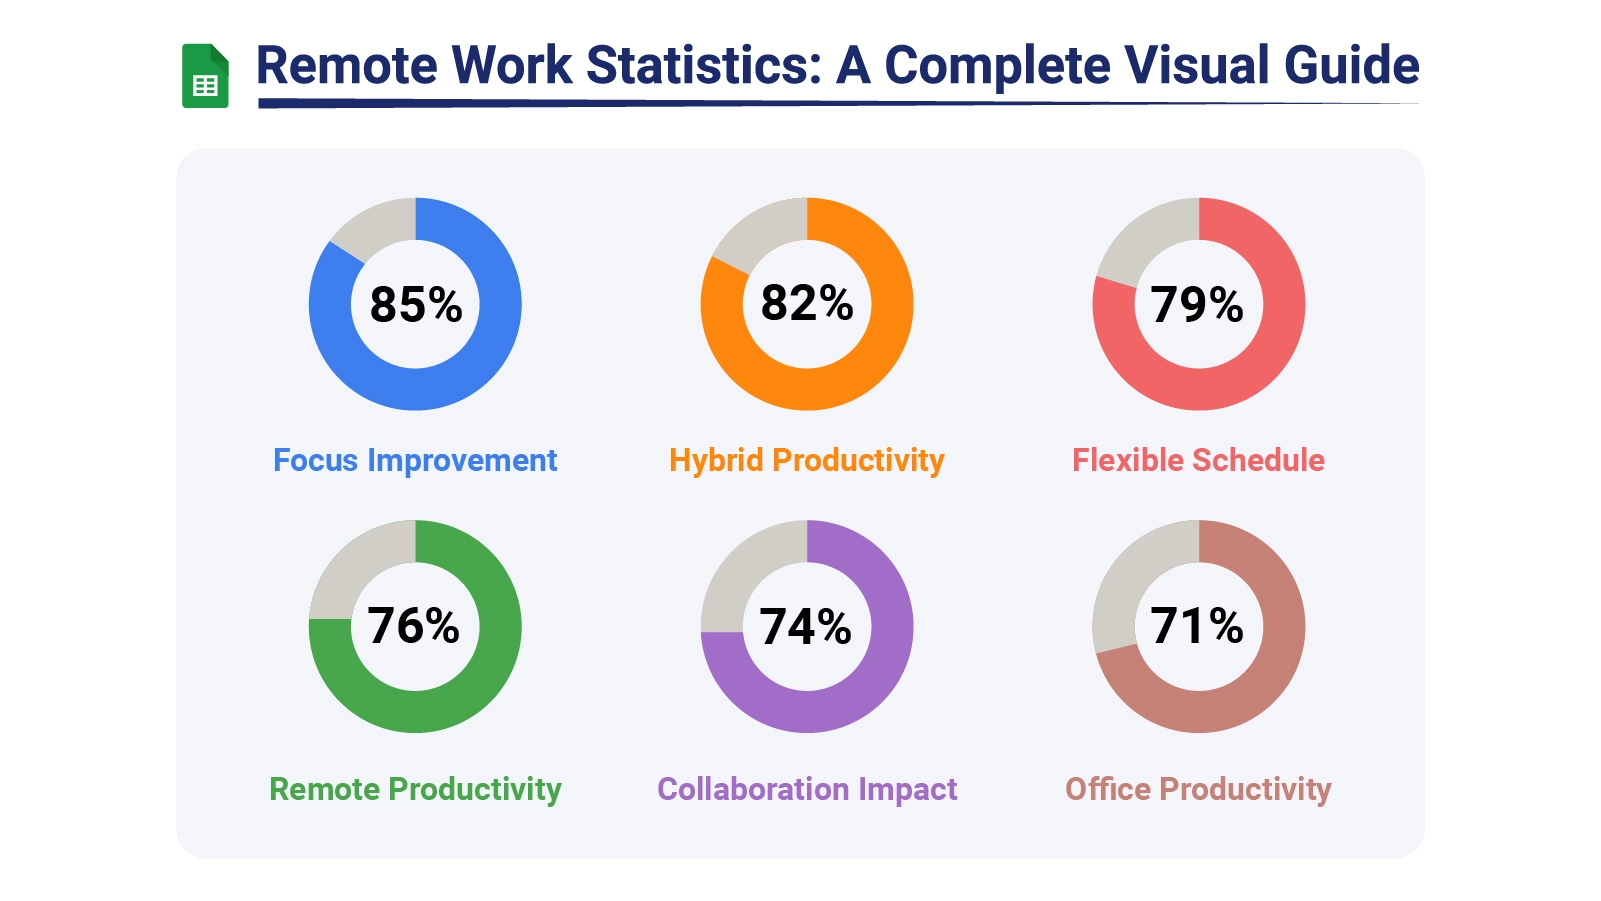
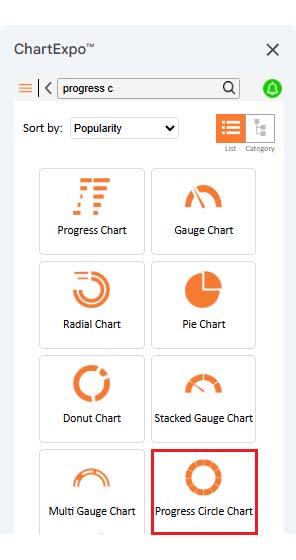
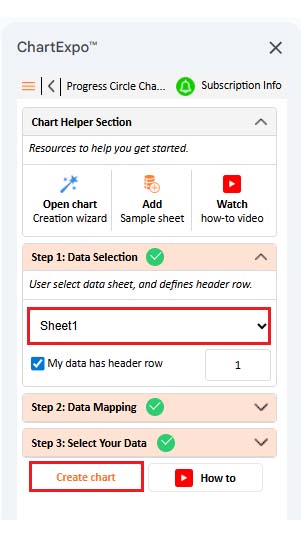
Consider the following data for the Progress Circle Chart.
| Productivity Metric | Performance (%) |
| Remote Productivity | 76 |
| Hybrid Productivity | 82 |
| Office Productivity | 71 |
| Flexible Schedule Efficiency | 79 |
| Collaboration Impact | 74 |
| Focus Improvement | 85 |
Organizations that track these metrics regularly gain concrete, measurable advantages. Evidence-based monitoring supports stronger planning, sharper management decisions, and more reliable performance evaluation.
Even accurate remote work statistics lose their impact when presented carelessly. Clear communication of findings improves comprehension and speeds up the adoption of data-based decisions.
Hybrid and flexible arrangements remain prevalent across industries, with organizations continuing to balance efficiency targets, collaboration demands, and individual employee preferences.
Research into distributed work shows that productivity outcomes depend more on management approach, digital tool quality, and role type than on physical location.
Remote work stats show that technology, finance, marketing, and administrative sectors rely most heavily on distributed performance tracking to guide operational decisions.
Fluency with remote work statistics gives organizations a clear edge in workforce planning, policy design, and day-to-day management. The ability to move from raw data to structured insight separates reactive operations from those driven by deliberate strategy. Consistent tracking builds the foundation for sound decisions at every level.
Visualization tools make that translation faster and more accessible. Converting distributed workforce data into clear, interactive charts reduces interpretation time and allows every stakeholder to engage more meaningfully with the findings. With sound analytical habits in place, workforce data becomes a genuine strategic asset rather than a routine reporting burden.
How much did you enjoy this article?


Calculate accounts receivable turnover ratio to measure credit collection speed, improve cash flow, and strengthen your financial strategy. Read on!

Change Management KPIs are the key to tracking adoption, performance, and ROI during transitions. Find out which metrics matter. Read on!

Data collection methods and techniques determine the quality of every insight you act on. Explore key approaches for gathering reliable data. Read on!


