• Home
  • Tools dropdown img
    • Spreadsheet Charts

      • ChartExpo for Google Sheets
      • ChartExpo for Microsoft Excel
    • Power BI Charts

      • Power BI Custom Visuals by ChartExpo
    • Word Cloud

  • Charts dropdown img
    • Chart Category

      • Bar Charts
      • Circle Graphs
      • Column Charts
      • Combo Charts
      • Comparison Charts
      • Line Graphs
      • PPC Charts
      • Sentiment Analysis Charts
      • Survey Charts
    • Chart Type

      • Box and Whisker Plot
      • Clustered Bar Chart
      • Clustered Column Chart
      • Comparison Bar Chart
      • Control Chart
      • CSAT Survey Bar Chart
      • CSAT Survey Chart
      • Dot Plot Chart
      • Double Bar Graph
      • Funnel Chart
      • Gauge Chart
      • Likert Scale Chart
      • Matrix Chart
      • Multi Axis Line Chart
      • Overlapping Bar Chart
      • Pareto Chart
      • Radar Chart
      • Radial Bar Chart
      • Sankey Diagram
      • Scatter Plot Chart
      • Slope Chart
      • Sunburst Chart
      • Tornado Chart
      • Waterfall Chart
      • Word Cloud
    • Google Sheets
      Microsoft Excel
  • Services
  • Pricing
  • Contact us
  • Blog
  • Support dropdown img
      • Gallery
      • Videos
      • Contact us
      • FAQs
      • Resources
    • Please feel free to contact us

      atsupport@chartexpo.com

Categories
All Data Visualizations Data Analytics Surveys
Add-ons/
  • Google Sheets
  • Microsoft Excel
  • Power BI
All Data Visualizations Data Analytics Surveys
Add-ons
  • Google Sheets
  • Microsoft Excel
  • Power BI

We use cookies

This website uses cookies to provide better user experience and user's session management.
By continuing visiting this website you consent the use of these cookies.

Ok

ChartExpo Survey


Home > Blog > Data Analytics

Leveraging Big Data Analytics to Reduce Healthcare Costs

Leveraging big data analytics in healthcare helps identify cost-saving opportunities, streamline operations, and improve patient outcomes through data-driven decision-making.

Leveraging Big Data Analytics to Reduce Healthcare Costs

This guide shows you the importance of healthcare analytics and how business intelligence analytics help improve the overall healthcare experience for patients. You’ll also discover the role data analytics, healthcare data visualization, visual analytics, and embedded analytics play in the healthcare industry.

If you offer data and analytics services, you can draw some insights on how to improve your service offering by studying the prescriptive analytics and the healthcare dashboard examples in this guide.

You will also discover the top analytics tools for business and healthcare transformation.

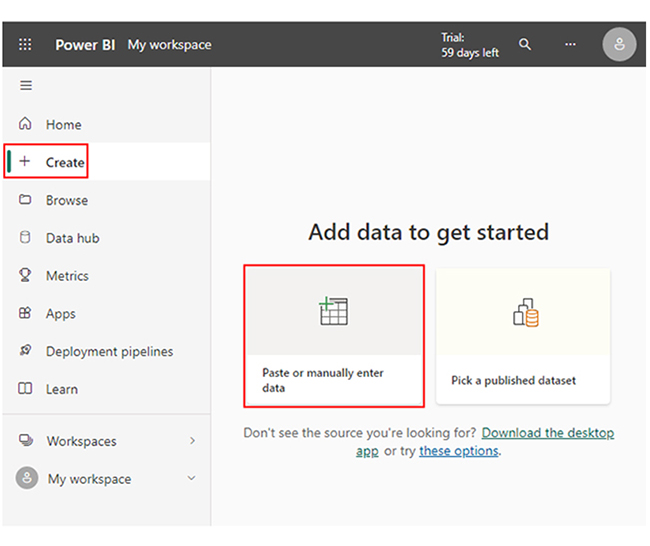
Whether you’re a newbie or a veteran in the industry, this guide will show you how to perform healthcare big data analytics in Power BI. It also shows you how to use big data analysis to reduce healthcare costs.

Table of Contents:

  1. Why Use Big Data in the Healthcare Industry?
  2. Top 10 Big Data Applications in Healthcare
  3. How to Use Big Data Analysis to Reduce Healthcare Costs?
  4. What are the Challenges in Leveraging Big Data in Healthcare?
  5. How to Perform Healthcare Big Data Analytics in Power BI?
  6. FAQs
  7. Wrap Up

Why Use Big Data in the Healthcare Industry?

  • Operational Efficiency

Clinics and Hospitals use data analytics to reduce wait times, optimize scheduling, and manage staffing levels. Insights into resource utilization and patient flow help in improving service quality and cutting operational costs.

  • Reduced Healthcare Costs

Data-driven decisions help healthcare organizations eliminate unnecessary tests, avoid treatment errors, and reduce hospital readmissions. Analyzing insurance data and billing helps in detecting fraud and ensures accurate reimbursements.

  • Real-Time Monitoring and Alerts

With IoT tools and wearable devices, real-time data collection is possible. This enables immediate intervention in critical situations and helps reduce hospital admissions and emergency visits.

  • Research and Innovation

Big data accelerates medical research. This is done by providing large datasets for analysis, leading to improved clinical trials, faster development of treatments, and better understanding of diseases.

  • Enhanced Patient Care and Outcomes

Big data gives room for healthcare providers to analyze patient histories, treatment outcomes, and genetics to offer personalized care. By identifying risk factors early, healthcare providers can prevent diseases rather than just treat them.

Top 10 Big Data Applications in Healthcare

  • Fraud Detection

It analyzes billing patterns to uncover anomalies and prevent fraudulent claims.

  • Predictive Analytics

It anticipates disease risks and patient deterioration and gives room for early intervention.

  • Operational Efficiency

It improves staffing, resource allocation, and workflow optimization in hospitals.

  • Remote Patient Monitoring

It gathers real-time data from sensors and wearables for continuous health tracking.

  • Population Health Management

It identifies health trends across groups to plan public health strategies.

  • Drug Development and Trials

It speeds up research by analyzing patient outcomes and clinical trial data.

  • Clinical Decision Support Systems

It uses data to reduce medical errors and guide treatment plans.

  • Personalized Medicine

It tailors treatments based on lifestyle, historical data, and genetics.

  • Epidemic Tracking and Management

It predicts disease outbreaks using large-scale health and location data.

  • Electronic Health Records (EHRs)

It consolidates patient data for accurate, real-time access and improved care coordination.

How to Use Big Data Analysis to Reduce Healthcare Costs?

Big data analysis plays a major role in controlling and reducing healthcare costs by offering data-driven insights. It leads to more operations, resource optimization, and better patient care.

One of the major ways to cut costs is through predictive analytics. By analyzing patient lifestyle, history, and genetic data, healthcare providers can identify high-risk individuals and intervene early. This helps prevent costly treatments or hospitalizations.

Electronic Health Records (EHRs): They help consolidate patient data in one place, which improves diagnosis accuracy and reduces duplication of prescriptions or tests. Better coordination between providers leads to cost savings.

Operational Analytics: It can improve hospital efficiency by managing inventory, optimizing staffing, and scheduling. All these reduce wait times and enhance workflow, minimizing unnecessary expenditures.

What are the Challenges in Leveraging Big Data in Healthcare?

  • Data Privacy and Security

Healthcare data is highly sensitive. It ensures compliance with regulations like HIPAA and protects data from cyberattacks or breaches. Unauthorized access could lead to loss of trust and legal liabilities.

  • Data Quality and Accuracy

Outdated, incomplete, and incorrect data can lead to poor decision-making and faulty analysis. It ensures high-quality data collection, entry, and maintenance. All these are essential for reliable analytics.

  • Skill Gaps and Training

Lots of healthcare professionals lack training in data science and analytics. It bridges the gap between medical knowledge and technical skills.

  • High Implementation Costs

Setting up big data infrastructure like analytics tools, cloud storage, and skilled personnel can be expensive.

  • Ethical and Legal Issues

If patient data is used for research (or commercial use) without clear consent, it raises ethical concerns and potential legal risks.

  • Data Integration and Standardization

Healthcare systems often operate in silos with different platforms and formats. Integrating data from multiple sources like wearables, EHRs, insurers, and labs requires significant effort to ascertain standardization and compatibility.
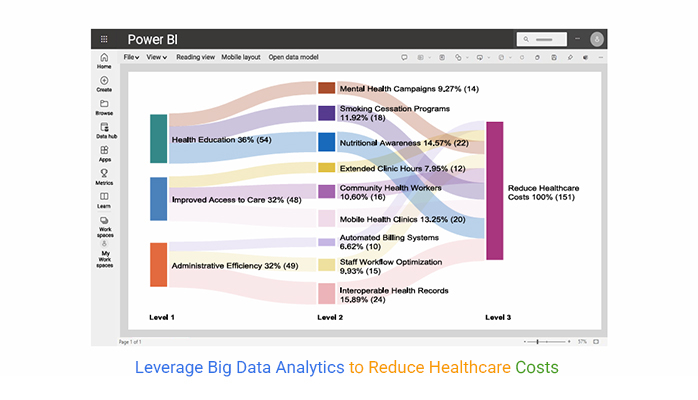
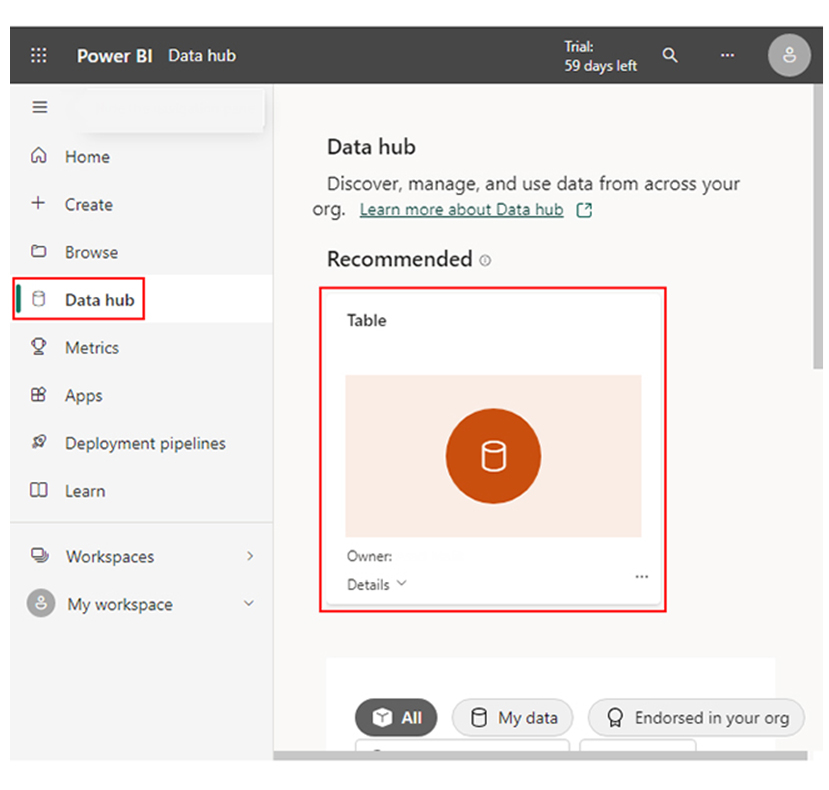
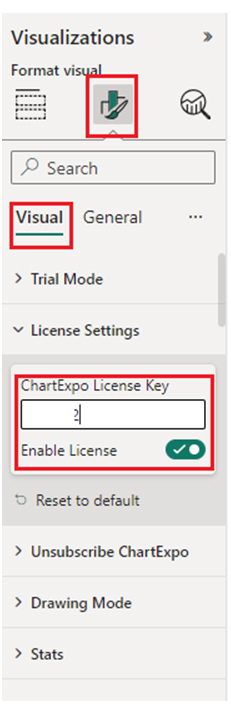
How to Perform Healthcare Big Data Analytics in Power BI?

  • Stage 1: Log in to Power BI, enter your email, and click the “Submit” button.
Leveraging Big Data Analytics to Reduce Healthcare Costs
  • You’ll be redirected to a Microsoft account. Enter your password, and click “Sign in.”
Leveraging Big Data Analytics to Reduce Healthcare Costs
  • You can opt to stay signed in.
Leveraging Big Data Analytics to Reduce Healthcare Costs
  • Stage 2: Create a Data Set and Select the Data Set to Use in the Sankey Diagram.
  • Navigate to the left-side menu, and click on the “Create” option. At this point, select “Paste or manually enter data.”
Leveraging Big Data Analytics to Reduce Healthcare Costs
  • The following is an illustration of healthcare big data analytics.
Leveraging Big Data Analytics to Reduce Healthcare Costs
  • Paste the data table above into the “Power Query” window. After that, select the third “Create” option. Navigate to the left-side menu, and click on the “Data Hub” option.
  • Power BI will populate the data set list. If no data set has been created, you’ll get an error message.
Leveraging Big Data Analytics to Reduce Healthcare Costs
  • Click on the “Create a blank report” dropdown.
Leveraging Big Data Analytics to Reduce Healthcare Costs
  • To add the Power BI Sankey Diagram Extension by ChartExpo, you’ll need an add-in or Power BI visual from AppSource. To do so, navigate to the right side of the Power BI dashboard.
  • Open the Power BI Visualizations panel, and click on the ellipsis symbol (…) to import the Power BI Sankey Diagram extension by ChartExpo. At this point, select the “Get more visuals” option.
Leveraging Big Data Analytics to Reduce Healthcare Costs
  • Enter “ChartExpo” in the highlighted search box. You’ll see the “Sankey Diagram for Power BI by ChartExpo.”
Leveraging Big Data Analytics to Reduce Healthcare Costs
  • After that, click on the Sankey Diagram and also click the highlighted “Add” button.
Leveraging Big Data Analytics to Reduce Healthcare Costs
  • Power BI will add the “Sankey Diagram for Power BI by ChartExpo” icon in the visualization panel. To draw a Sankey Diagram with ChartExpo’s Power BI extension, select the “Sankey Diagram for Power BI by ChartExpo” icon in the visualization panel.
  • You’ll have to provide your email address or a ChartExpo license key. Add the key under the visual section to see your Sankey Chart.
Leveraging Big Data Analytics to Reduce Healthcare Costs
  • After adding the key, you’ll see the chart.
Leveraging Big Data Analytics to Reduce Healthcare Costs
  • You can add the top header text in the chart under the General section.
Leveraging Big Data Analytics to Reduce Healthcare Costs
  • You can disable the percentage value as follows.
Leveraging Big Data Analytics to Reduce Healthcare Costs
  • You can change the chart as shown below.
Leveraging Big Data Analytics to Reduce Healthcare Costs
  • Set the Prefix value ($) as follows.
Leveraging Big Data Analytics to Reduce Healthcare Costs
  • After this, change your chart as shown below:
Leveraging Big Data Analytics to Reduce Healthcare Costs
  • You can add the color of all Nodes.
Leveraging Big Data Analytics to Reduce Healthcare Costs
  • After this, change the chart as shown below.
Leveraging Big Data Analytics to Reduce Healthcare Costs
  • Here’s the final look at the Sankey Chart.
Leveraging Big Data Analytics to Reduce Healthcare Costs

Insights

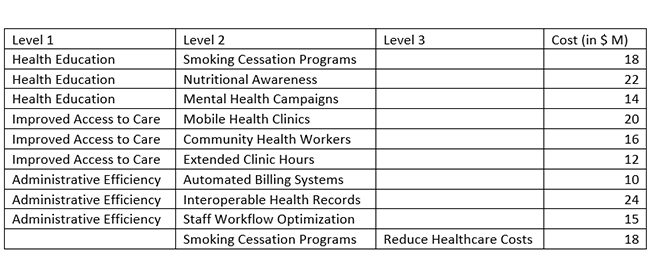
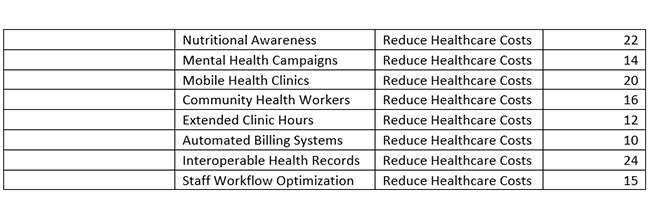
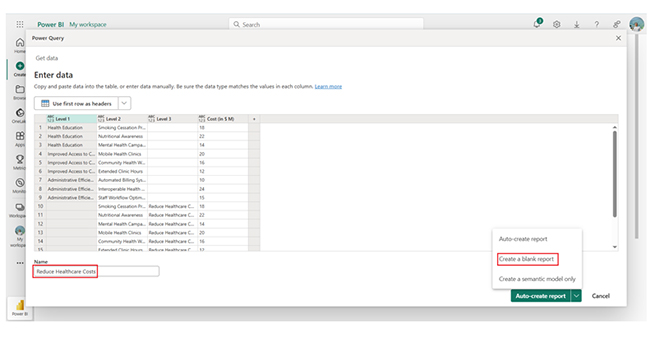
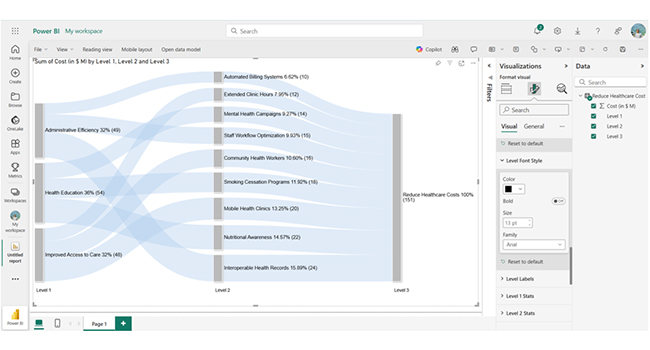
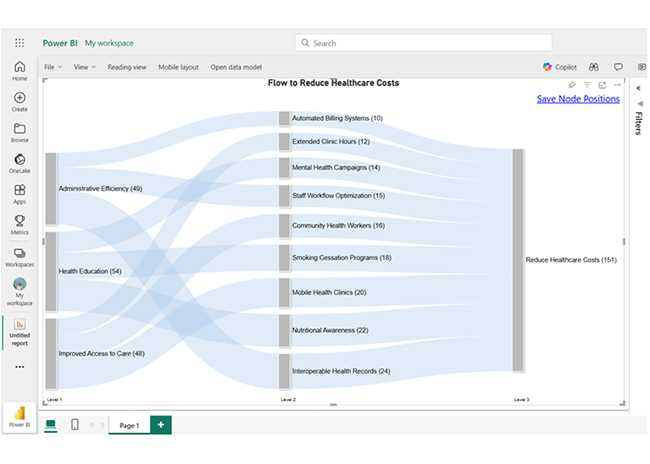
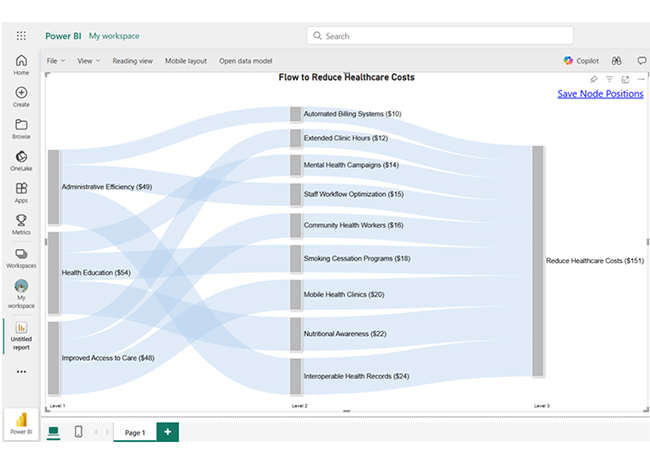
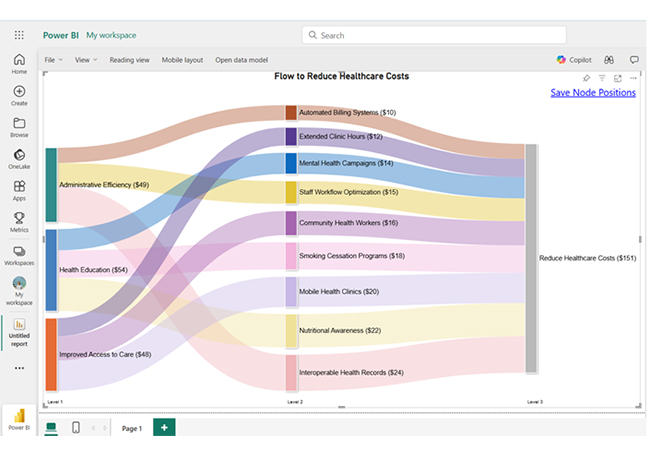
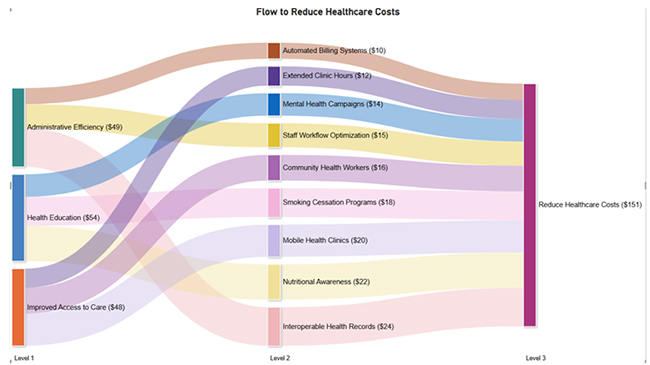
The data shows key healthcare investments: Access to Care, Health Education, and Administrative Efficiency all contribute to reducing costs. The highest spend is on Nutritional Awareness ($22M), while Interoperable Health Records also play a major efficiency role ($24M).

FAQs

How is big data analytics used in healthcare?

Big data analytics in healthcare is used to predict diseases, improve patient outcomes, personalize treatments, optimize operations, and reduce costs. It also supports real-time monitoring through the analysis of vast and diverse health-related data.

What are the problems with big data in healthcare?

Big data in healthcare faces challenges like integration issues, data privacy concerns, high costs, limited analytical skills, and inconsistent quality. It also faces challenges like a lack of standardization and ethical concerns over data usage and patient consent.

Wrap Up

Leveraging big data analytics in healthcare helps reduce costs by predicting risks, optimizing operations, and improving patient outcomes. It also enables data-driven decisions for preventive care, efficient service delivery, and resource management.

Some of the top big data applications in healthcare are electronic health records and clinical decision support systems. It consolidates patient data for accurate, real-time access and improved care coordination.

Big data is used to guide treatment plans and reduce medical errors. It also plays a major role in remote patient monitoring. That is, it helps gather real-time data from sensors and wearables for continuous health tracking.

When it comes to fraud detection, big data helps analyze billing patterns to prevent fraudulent claims and uncover anomalies.

Now you know how to leverage big data analytics in healthcare, how will you use it to reduce costs in your healthcare organization?

How much did you enjoy this article?

PBIAd1
Start Free Trial!
155263

Related articles

next previous
Data Analytics9 min read

Bank Dashboard: Enhancing Insights Through Data

Here is all you need to know about bank dashboards. You'll discover key features of an effective bank dashboard and how to analyze a banking dashboard.

Data Analytics8 min read

Metrics vs. Measures: Understanding the Key Differences

Metrics vs. measures track the right data and explain performance. This blog shows how to use both effectively with examples and visualization tips.

Data Analytics10 min read

DevOps Performance Metrics for Chart-Based Insights

DevOps performance metrics track efficiency in software delivery. This blog shows you how to use them to boost performance and streamline workflows.

Data Analytics8 min read

Social Media Dashboard to Improve Marketing Insights

This guide delves into what a social media dashboard is and how to create one. You'll also discover how to use a social media dashboard and more.

Data Analytics10 min read

Consulting Report Template for Better Decision Insights

A consulting report template organizes insights and data for clients. Click here to learn how to write, analyze, and enhance reports with charts and examples.

ChartExpo logo

Turn Data into Visual
Stories

CHARTEXPO

  • Home
  • Gallery
  • Videos
  • Services
  • Pricing
  • Contact us
  • FAQs
  • Privacy policy
  • Terms of Service
  • Sitemap

TOOLS

  • ChartExpo for Google Sheets
  • ChartExpo for Microsoft Excel
  • Power BI Custom Visuals by ChartExpo
  • Word Cloud

CATEGORIES

  • Bar Charts
  • Circle Graphs
  • Column Charts
  • Combo Charts
  • Comparison Charts
  • Line Graphs
  • PPC Charts
  • Sentiment Analysis Charts
  • Survey Charts

TOP CHARTS

  • Sankey Diagram
  • Likert Scale Chart
  • Comparison Bar Chart
  • Pareto Chart
  • Funnel Chart
  • Gauge Chart
  • Radar Chart
  • Radial Bar Chart
  • Sunburst Chart
  • see more
  • Scatter Plot Chart
  • CSAT Survey Bar Chart
  • CSAT Survey Chart
  • Dot Plot Chart
  • Double Bar Graph
  • Matrix Chart
  • Multi Axis Line Chart
  • Overlapping Bar Chart
  • Control Chart
  • Slope Chart
  • Clustered Bar Chart
  • Clustered Column Chart
  • Box and Whisker Plot
  • Tornado Chart
  • Waterfall Chart
  • Word Cloud
  • see less

RESOURCES

  • Blog
  • Resources
  • YouTube
SIGN UP FOR UPDATES

We wouldn't dream of spamming you or selling your info.

© 2025 ChartExpo, all rights reserved.