Categories
Why use a construction budget spreadsheet? Because without one, costs can spiral out of control. Materials, labor, permits—expenses pile up fast.
A missing zero in a material estimate can throw everything off. A spreadsheet keeps everything organized, so surprises don’t derail the project. It tracks every expense, helping contractors, project managers, and business owners stay within budget. With chart elements in Excel, teams can visualize cost trends, quickly spot issues, and adjust spending efficiently.


A construction budget spreadsheet helps prevent financial miscalculations that lead to work stoppages. When all costs are visible in one place, adjustments can be made before problems arise. Multivariate analysis enhances budget planning by simultaneously comparing multiple cost factors.
Tracking expenses manually? That takes hours. A well-structured spreadsheet saves time and reduces human error. It automates calculations, ensuring estimates align with actual costs.
Unexpected expenses always come up. Equipment breaks down, prices change, and labor shortages slow progress. A construction budget spreadsheet makes it easier to plan for these setbacks by keeping everything accounted for. Win-loss analysis helps assess past project budgets to improve future cost management.
A well-managed budget ensures work stays on track, payments go out on time, and profits remain intact. Without a system to monitor costs, financial chaos follows. Competent construction professionals use tools that give them control.
A spreadsheet isn’t an extra—it’s essential. Let me show you how…
Definition: A construction budget spreadsheet is a tool for tracking project expenses. It organizes costs for materials, labor, permits, and equipment, accounting for every dollar in one place. This helps prevent overspending and costly mistakes.
Contractors and project managers use it to stay within budget. It also tracks changes and unexpected costs. Automated calculations reduce errors, and precise financial planning keeps projects on schedule.
Combining this spreadsheet with a market research report template helps to analyze trends and adjust costs. Without it, budgets can quickly fall apart.
Are you managing a construction project? A construction budget worksheet is your best friend. It keeps everything organized and helps prevent surprises. Insights from a market intelligence report can also help refine budget estimates by analyzing industry trends and cost fluctuations. Here’s why this spreadsheet is essential:
A construction budget sheet isn’t just a document—it’s your financial roadmap. Knowing when to use it can save you from costly mistakes. Pairing it with an expense report template in Excel ensures every cost is tracked, making budgeting more precise and efficient. Here’s when it’s most valuable:
Managing a construction budget without a transparent system is risky. Costs can escalate, and minor errors cause significant setbacks. An Excel budget template organizes expenses, tracks payments, and compares estimates with actual spending. Here’s what it includes:
Are you building a construction budget in Excel? Let’s make it easy and efficient. A construction project budget template helps you plan costs, track spending, and stay on budget. Effective questionnaire design can also help gather input from stakeholders to create a more accurate budget plan. Here’s how to make one:
Budgets can make or break a construction project. Tracking costs with scattered notes or outdated spreadsheets leads to chaos. A construction budget spreadsheet keeps everything organized, but Excel alone has its limits.
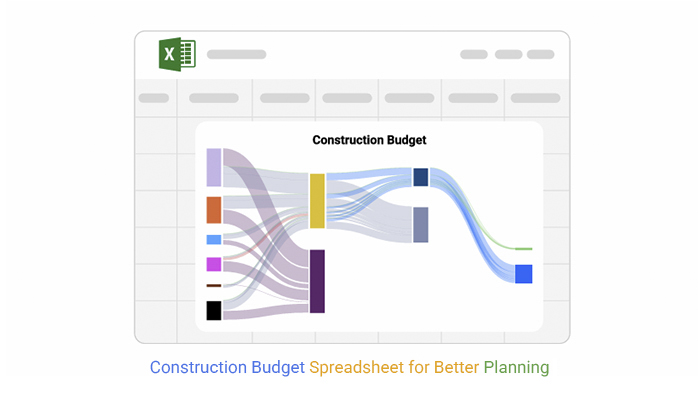
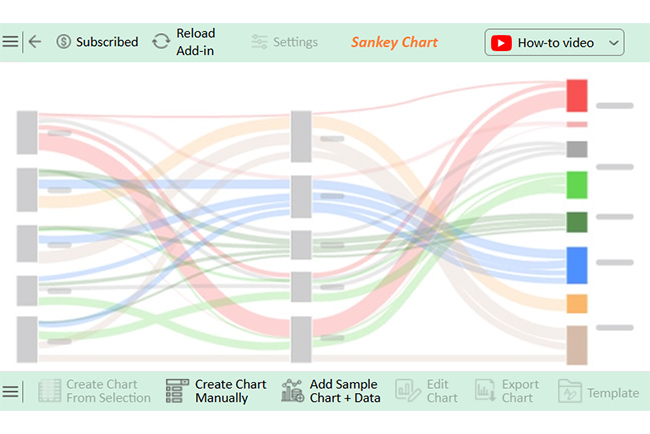
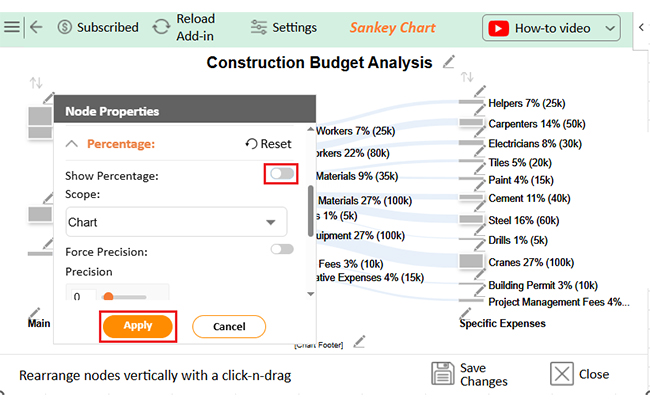
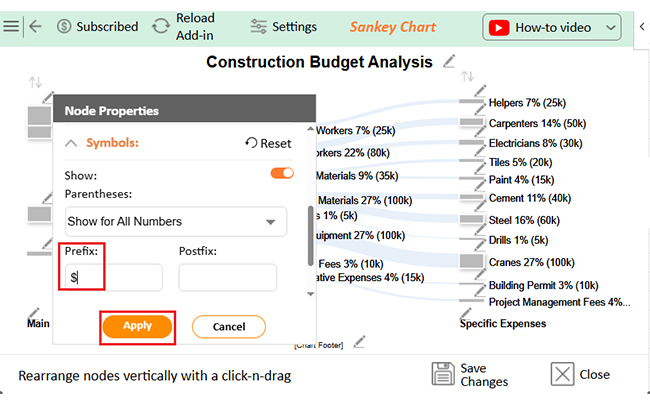
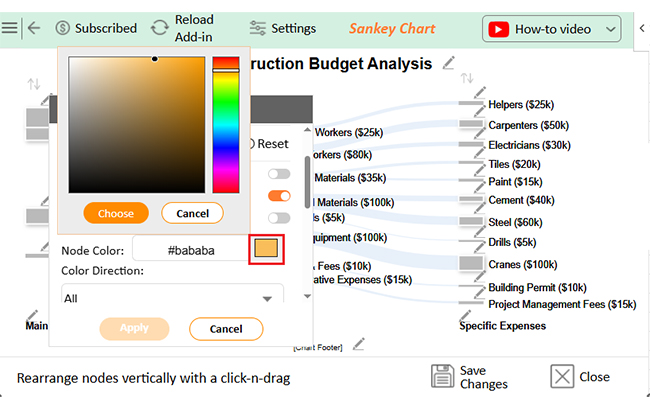
Data visualization is key to spotting cost trends and overruns. Yet, Excel’s built-in charts often fall short, making analysis frustrating. That’s where ChartExpo comes in. It transforms dull spreadsheets into clear, insightful visuals. With tools like a Sankey diagram generator, you can track expenses, compare budgets, and make smarter decisions.
Let’s explore how a structured budget spreadsheet—and the right visual tools—are essential for success.
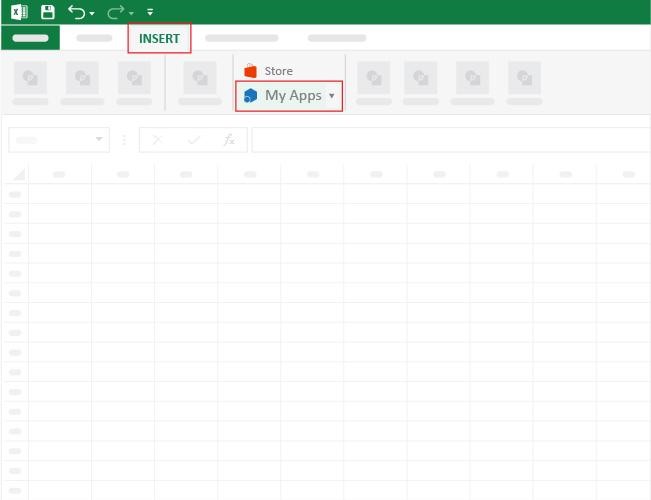
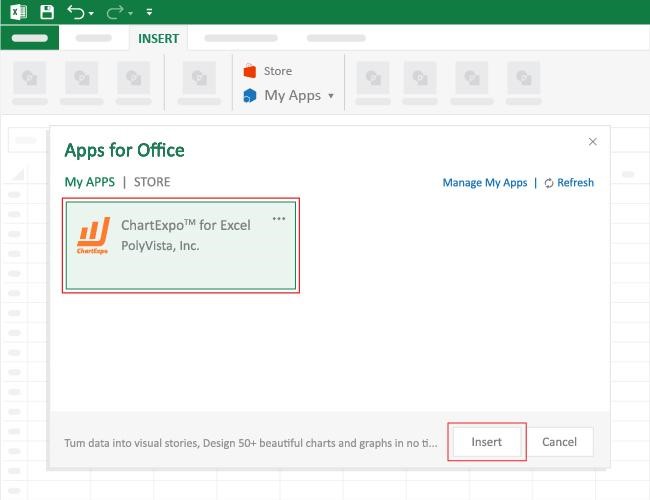
How to Install ChartExpo in Excel?
ChartExpo charts are available both in Google Sheets and Microsoft Excel. Please use the following CTAs to install the tool of your choice and create beautiful visualizations with a few clicks in your favorite tool.
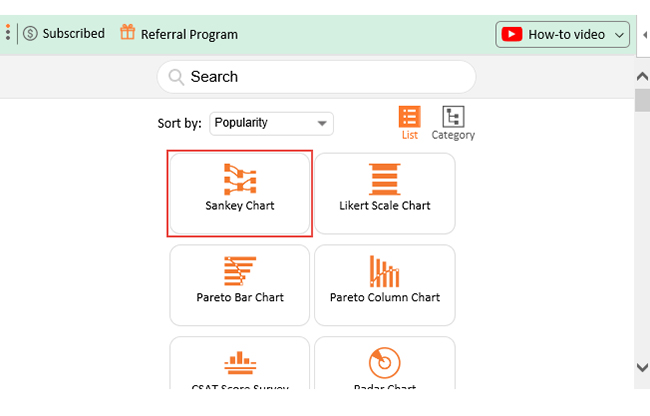
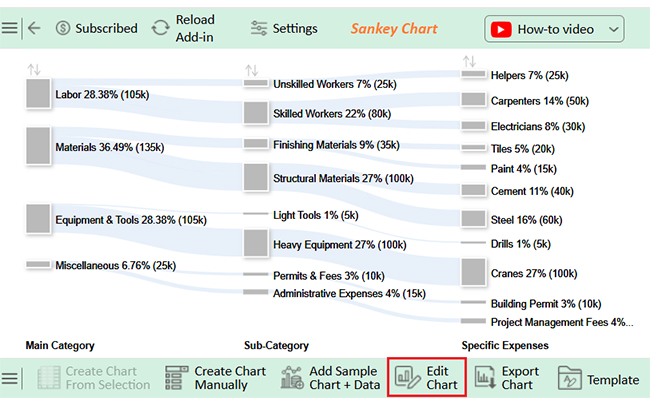
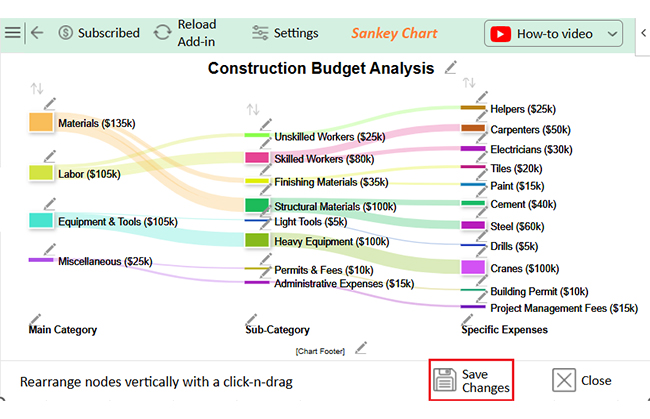
Let’s learn how to transpose data in Excel and analyze it using ChartExpo, while also discovering how a Sankey chart Excel visualization can help present the transformed data more effectively.
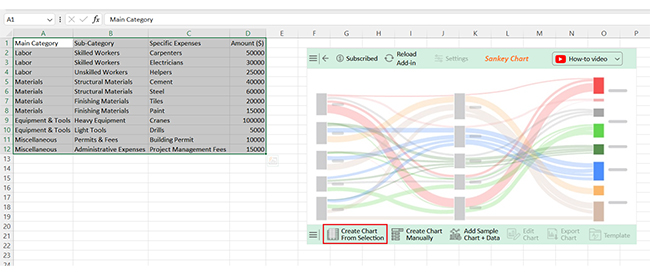
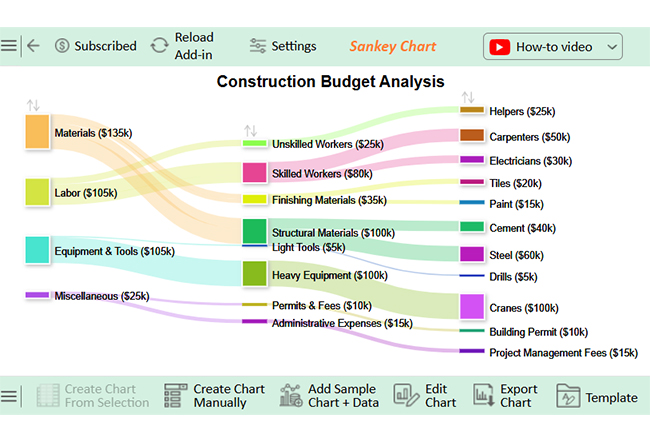
| Main Category | Sub-Category | Specific Expenses | Amount ($) |
| Labor | Skilled Workers | Carpenters | 50000 |
| Labor | Skilled Workers | Electricians | 30000 |
| Labor | Unskilled Workers | Helpers | 25000 |
| Materials | Structural Materials | Cement | 40000 |
| Materials | Structural Materials | Steel | 60000 |
| Materials | Finishing Materials | Tiles | 20000 |
| Materials | Finishing Materials | Paint | 15000 |
| Equipment & Tools | Heavy Equipment | Cranes | 100000 |
| Equipment & Tools | Light Tools | Drills | 5000 |
| Miscellaneous | Permits & Fees | Building Permit | 10000 |
| Miscellaneous | Administrative Expenses | Project Management Fees | 15000 |
Managing construction costs without a transparent system can lead to overspending and delays. A construction budget spreadsheet organizes finances and tracks every dollar. Here’s how to use it effectively:
Keeping construction costs in check can be challenging. A construction budget spreadsheet simplifies financial management and helps avoid costly mistakes. Using data analysis in Excel allows teams to identify spending patterns and make informed budget adjustments. Here’s why it’s essential:
Creating a precise construction budget spreadsheet in Excel ensures better cost control and smoother project execution. A few innovative strategies can make a big difference. Here’s how to get it right:
A construction budget spreadsheet keeps finances organized and projects on track. It helps manage costs, prevent overspending, and improve decision-making. Without a clear budget, expenses can quickly spiral out of control.
Tracking costs in Excel provides accuracy and transparency. Every expense is recorded, making it easy to monitor spending. It ensures the project stays within budget and avoids financial surprises. Using data modeling in Excel allows teams to predict future costs based on historical data, improving financial forecasting.
A structured spreadsheet simplifies financial planning. It breaks down costs into categories like labor, materials, and equipment. Comparing budgeted and actual expenses helps teams stay in control. Effective budgeting also supports customer service KPI tracking by ensuring timely payments and smooth project execution, keeping clients satisfied.
Using Excel formulas automates calculations and reduces errors. Conditional formatting highlights budget overruns. Visual tools like charts make data easier to analyze. You can also integrate risk tolerance questionnaires into budget planning to assess how much financial risk a project can handle before adjustments are needed.
A well-maintained spreadsheet improves accountability. Teams can track payments, manage contingency funds, and adjust costs as needed. Clear records make reporting simple and efficient.
Conclusively, managing construction costs doesn’t have to be stressful. A construction budget spreadsheet ensures better planning, smarter spending, and smoother execution. It’s an essential tool for staying organized and in control. To enhance data visualization and insights. Install ChartExpo for advanced charting options in Excel.
How much did you enjoy this article?


Learn how to use sparklines in Excel to quickly visualize trends inside cells. Discover types, creation steps, customization, use cases, benefits, and best practices.

Learn what a confidence interval graph is, how to create it in Excel, and how to interpret results to make more reliable, data-driven decisions.

A correlation matrix in Excel helps identify relationships between variables. Learn how to create, read, and use it for effective data analysis.


