Categories
Comparing house prices by area helps you to identify regional trends, and highlight variations in market value. It offers valuable insights into affordability, demand, and investment potential. This will aid buyers, investors, and sellers in making the right decision.


This guide shows you how to compare house prices by area. It also shows you how to perform house price comparison by city, and how to analyze home price comparison by city in Power BI. Speaking of Power BI, you’ll discover how to perform market analysis, and easy ways of creating a hierarchy in Power BI.
Since Power BI will be used as one of the data visualization tools, you’ll be introduced to some Power BI advanced features, and how the Power BI deployment pipeline works.
Finally, this guide outlines the best practices of house price area comparison and the benefits of comparing house prices by area.
To understand comparable home prices by area, you have to analyze the prices of similar homes in different locations. This will help you identify trends and value differences. It also helps in assessing the affordability and investment potential of specific areas.
To analyze local market trends, you should consider using tools like Power BI. You’ll learn how to incorporate Power BI calculated tables and Power BI number format during this analysis.
Analyzing Compare House Prices by Area in Microsoft Excel using Comparison Bar Chart
Analyzing Compare House Prices by Area in Google Sheets using Comparison Bar Chart
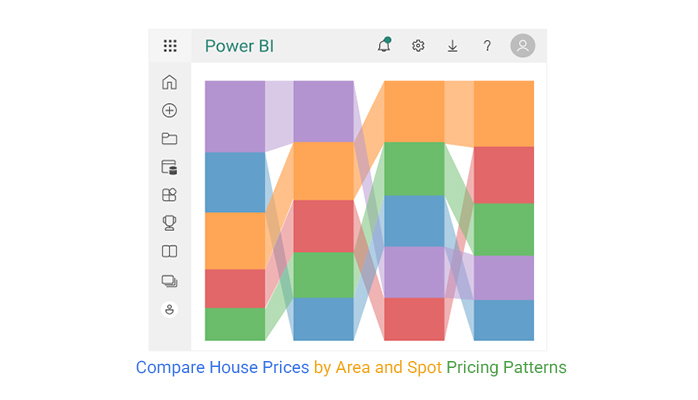
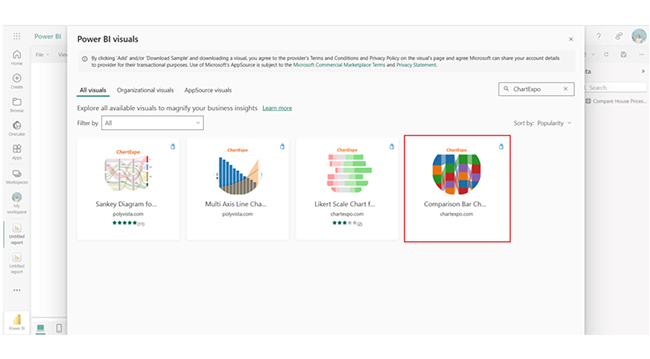
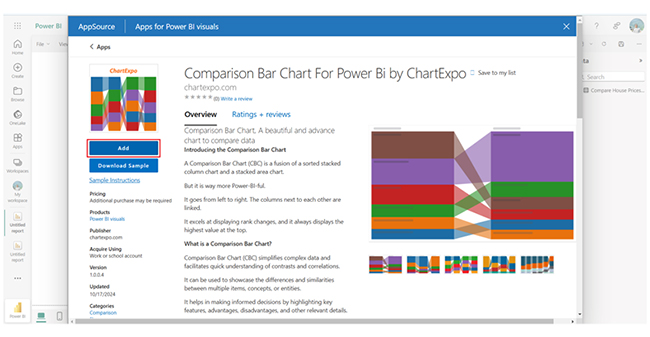
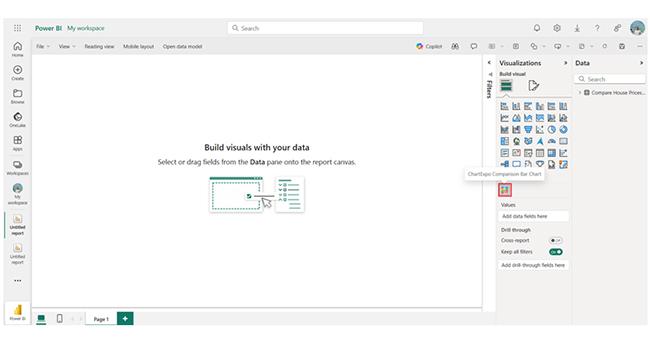
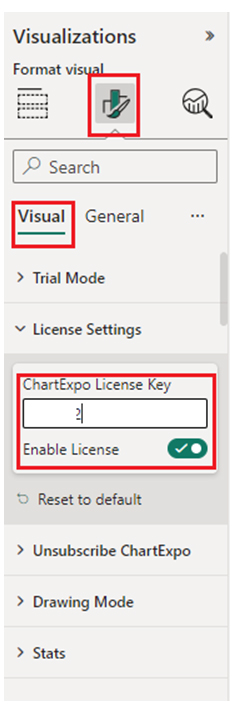
Analyzing Compare House Prices by Area in Power BI using Comparison Bar Chart
You have to collect data on homes with similar characteristics (size, type, condition, age, and amenities) across different cities. You can use local listings, real estate websites, or property databases to gather this information. To make your comparison more accurate, you have to compare a good number of homes.
To evaluate the impact of location on home prices, you have to consider factors like:
Identify the median home price for each city. This will give you a better understanding of the typical market value than the average price (which may be skewed by extremely low or high values). This enables you to compare cities on a more even footing.
A close look at historical data helps you understand how house prices have changed over the past few years in the city. This will help you figure out if the city’s real estate is appreciating or depreciating, and that comes in handy when making investment decisions.
This section dives down into the Power BI report builder, and how slicers in Power BI work. You’ll also see some Power BI dashboard designs, a Power BI sales dashboard, and a digital dashboard.
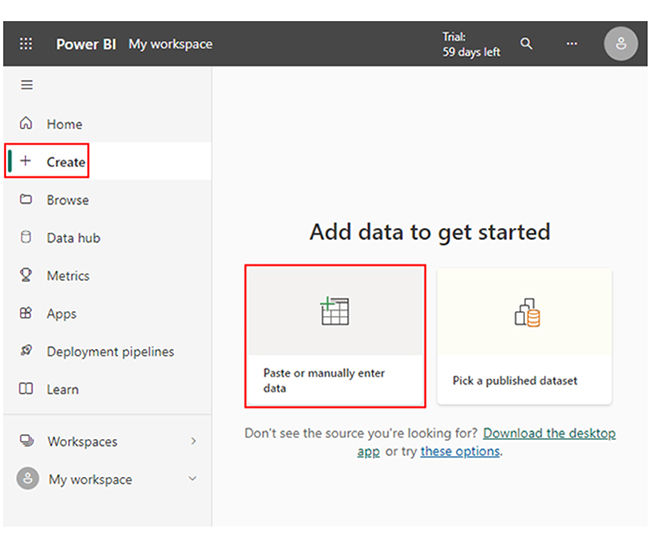
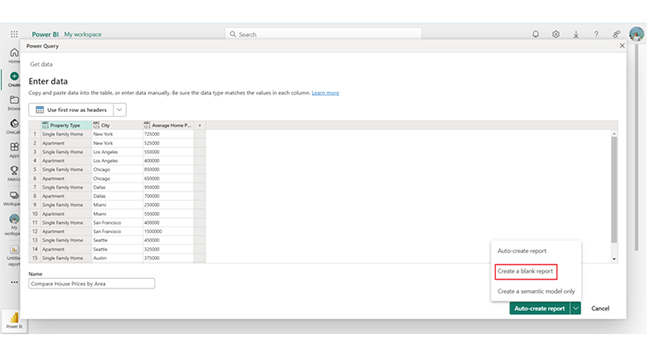
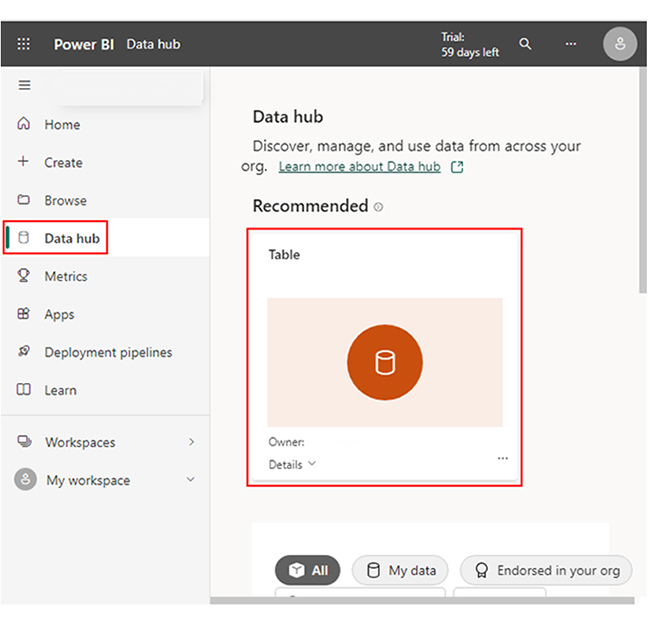
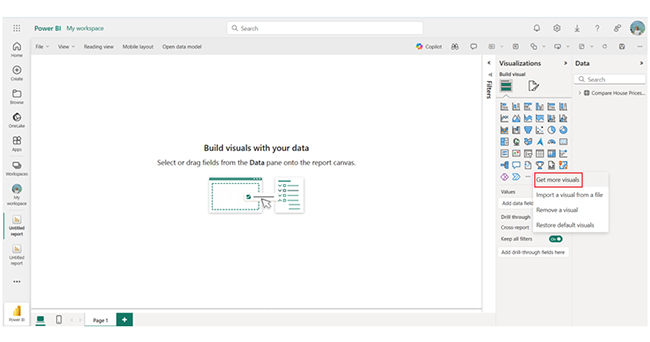
Here are the stages to follow when analyzing home price comparison by city in Power BI.
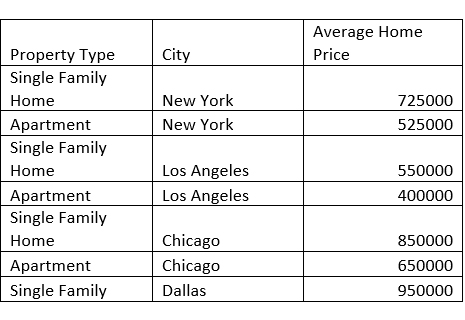
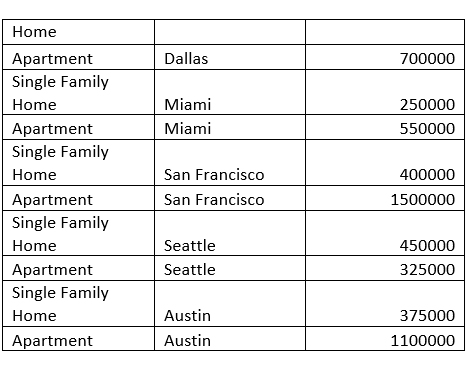
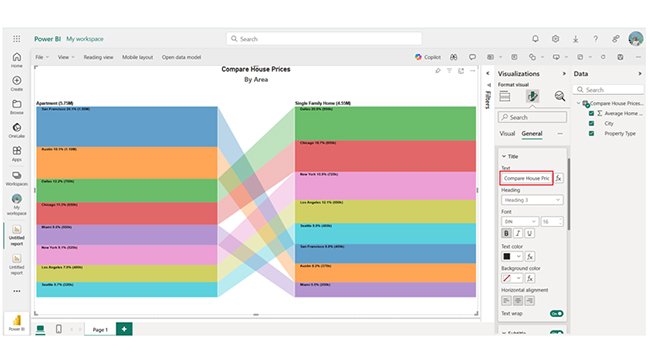
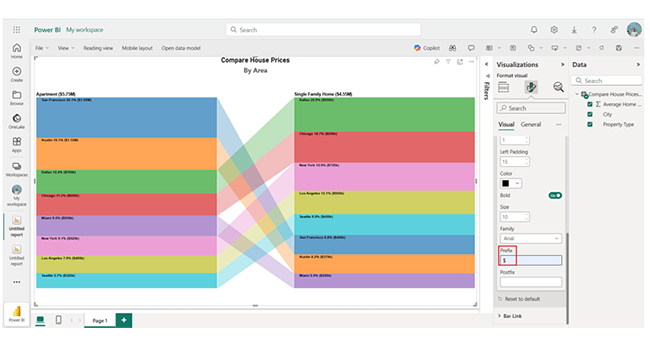
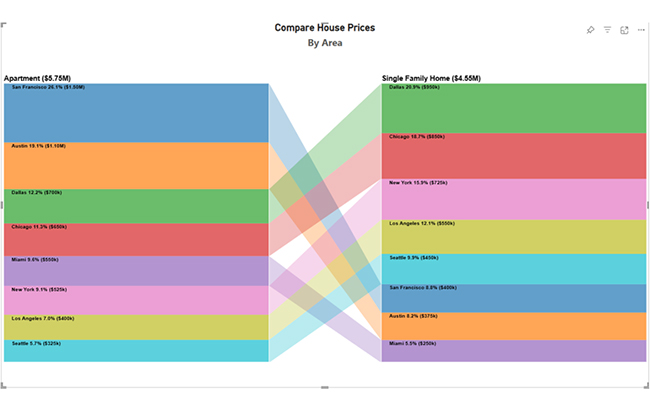
Single-family homes are the most expensive in Dallas and Chicago, while apartments are the most expensive in Austin and San Francisco. Miami offers affordable single-family homes, and that contrasts with high apartment prices.
You have to ascertain that the properties being compared are as similar as possible in terms of type (detached, semi-detached, apartment), size, condition, and age. The closer the properties are in these aspects, the more accurate the comparison will be.
You should also pay attention to details like the number of bathrooms, bedrooms, and parking spaces.
Examine how house prices in the area have changed over time. Historical price trends offer insights into whether an area is appreciating (or depreciating). By comparing the historical growth rates of home values, you’ll be able to figure out if the current prices are reflective of the city’s long-term trajectory.
Market conditions like local economic factors, interest rates, and housing supply and demand play a role in setting prices. For instance, a seller’s market will see higher prices due to limited inventory, while a buyer’s market will lead to more negotiable prices.
When comparing homes by area, you have to consider property taxes, homeowner’s association fees, and other location-based costs. All these costs vary, and they may affect the long-term affordability of a home.
By analyzing house prices across various areas, buyers can make better buying decisions, and that will help them get the best value for their money. It also helps sellers to figure out if their properties are priced competitively within the local market.
Comparing prices helps buyers find affordable options in areas with similar amenities. It provides a clearer picture of what to expect in terms of price per square foot. It also helps buyers set realistic expectations within their budget.
Price comparisons allow for the identification of falling or rising markets. This insight helps in predicting future price movements and knowing when to buy (or sell) to maximize returns.
Understanding what you get for the price in different areas allows for a better judgment of property value. It helps you see whether certain areas offer better returns on investment or more desirable features.
To compare property prices, you have to analyze location, property type, size, and amenities. Evaluate market trends, historical data, and price per square foot for similar properties. This ensures accurate and informed comparisons.
Evaluate comparable properties in the area, analyze recent sales, and keep a close eye on the property features and condition. You should also assess market trends, and consult local real estate experts to determine an accurate residential property list price.
To compare house prices by area, you have to consider factors like the similarity of the properties in terms of size, type, age, and condition. Having a good grasp of comparable home prices by area helps you assess property value, market trends, and affordability.
By comparing house prices by area, you’ll be able to make informed decisions, gain investment insights, and identify areas of growth.
To get the most out of the house price area comparison process, you have to assess market trends and historical data. You have to examine how house prices in the area have changed over time. Historical price trends offer insights into whether an area is appreciating or depreciating.
By following the steps in this guide, you’ll be able to compare house prices using visualizations like the comparison bar chart.
Now you know how to compare house prices by area, what things will you consider when comparing house prices within a region?
How much did you enjoy this article?


Discover diverse and high-quality Power BI report examples for inspiration and insights. Elevate your reporting with strategic visualization techniques.

A Customer Relationship Management Dashboard centralizes data, tracks key metrics, and drives smarter business decisions. Discover now!

Explore Healthcare Dashboard Examples and learn how to turn complex healthcare data into clear, actionable insights for better decision-making.


