• Home
  • Tools dropdown img
    • Spreadsheet Charts

      • ChartExpo for Google Sheets
      • ChartExpo for Microsoft Excel
    • Power BI Charts

      • Power BI Custom Visuals by ChartExpo
    • Word Cloud

  • Charts dropdown img
    • Chart Category

      • Bar Charts
      • Circle Graphs
      • Column Charts
      • Combo Charts
      • Comparison Charts
      • Line Graphs
      • PPC Charts
      • Sentiment Analysis Charts
      • Survey Charts
    • Chart Type

      • Box and Whisker Plot
      • Clustered Bar Chart
      • Clustered Column Chart
      • Comparison Bar Chart
      • Control Chart
      • CSAT Survey Bar Chart
      • CSAT Survey Chart
      • Dot Plot Chart
      • Double Bar Graph
      • Funnel Chart
      • Gauge Chart
      • Likert Scale Chart
      • Matrix Chart
      • Multi Axis Line Chart
      • Overlapping Bar Chart
      • Pareto Chart
      • Radar Chart
      • Radial Bar Chart
      • Sankey Diagram
      • Scatter Plot Chart
      • Slope Chart
      • Sunburst Chart
      • Tornado Chart
      • Waterfall Chart
      • Word Cloud
    • Google Sheets
      Microsoft Excel
  • Services
  • Pricing
  • Contact us
  • Blog
  • Support dropdown img
      • Gallery
      • Videos
      • Contact us
      • FAQs
      • Resources
    • Please feel free to contact us

      atsupport@chartexpo.com

Categories
All Data Visualizations Data Analytics Surveys
Add-ons/
  • Google Sheets
  • Microsoft Excel
  • Power BI
All Data Visualizations Data Analytics Surveys
Add-ons
  • Google Sheets
  • Microsoft Excel
  • Power BI

We use cookies

This website uses cookies to provide better user experience and user's session management.
By continuing visiting this website you consent the use of these cookies.

Ok

ChartExpo Survey


Home > Blog > Google Sheets

Google Sheets Functionality to Unlock Advanced Charting

What is Google Sheets functionality? It’s the foundation of one of the most popular spreadsheet tools. Google Sheets is essential for managing data, automating processes, and fostering online collaboration. Its functionality extends beyond basic spreadsheets, offering powerful features for individuals and businesses.

Google Sheets functionality allows real-time collaboration, making it a go-to choice for teams. Multiple users can edit the same document simultaneously, ensuring everyone stays aligned. Moreover, Google Sheets functionality integrates seamlessly with other Google apps, boosting productivity across industries.

Google Sheets Functionality

The tool provides advanced formulas and functions to simplify complex calculations, from basic sums to powerful array formulas. It includes features like conditional formatting, pivot tables, and charts to make data visualization effortless.

With cloud-based storage, your data stays secure and accessible anytime. Offline mode lets you make edits even without an internet connection. Google Sheets’ versatility has made It a favorite among students, professionals, and entrepreneurs.

Businesses often leverage Google Sheets functionality for automation. Apps Script creates custom workflows and saves hours of manual effort, making it an indispensable tool for efficient operations.

In this blog, we’ll explore Google Sheets’ key features.

Table of Content:

  1. What is a Google Sheets Functionality?
  2. Why Do We Need Google Sheets Functionality?
  3. Features of Google Sheets
  4. Top 10 Functions List For Google Sheets With Application
  5. How We Can Use Google Sheets Functionality For Data Evaluation?
  6. Benefits of Using Google Sheet Functionality
  7. Tips and Tricks for Maximizing Google Sheets Functionality
  8. Google Sheets Functions FAQs
  9. Wrap Up

First…

What is a Google Sheets Functionality?

Definition: Google Sheets offers real-time collaboration, letting multiple users edit files simultaneously. It includes advanced formulas and supports data visualization through charts and pivot tables.

  • Conditional formatting helps highlight important information.
  • Integration with Google Workspace ensures seamless workflows through Google Spreadsheet integration, making data management and collaboration more efficient across platforms.
  • Cloud-based storage makes data accessible anywhere, with offline mode for flexibility.
  • Automation tools like Apps Script save time on repetitive tasks.

These functions make Google Sheets a versatile tool for analyzing and interpreting data efficiently, allowing users to manage and derive meaningful insights from their datasets.

Why Do We Need Google Sheets Functionality?

Google Sheets functionality is essential for efficient data management, collaboration, and automation. It allows users to analyze, organize, and visualize data in real time. With built-in formulas, functions, and integrations, Google Sheets enhances productivity, making it a powerful tool for businesses, researchers, and individuals. Its cloud-based nature ensures accessibility from anywhere, fostering seamless teamwork and data sharing.

Features of Google Sheets

1. Cloud-Based Access

Google Sheets allows you to work from anywhere, with automatic real-time syncing across devices. This ensures you never lose your work, even if your internet connection drops.

2. Collaboration & Sharing

Multiple users can edit, comment, and collaborate on the same spreadsheet simultaneously. You can control permissions, allowing users to view, comment, or edit as needed.

3. Built-in Functions & Formulas

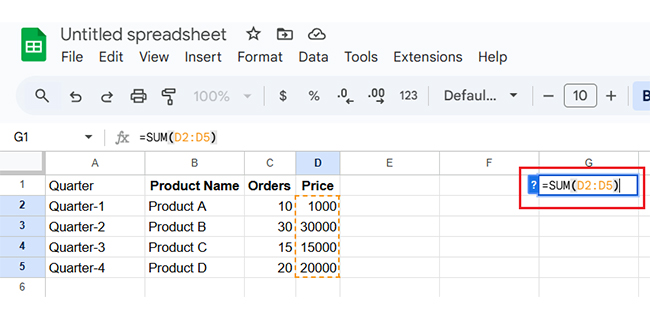
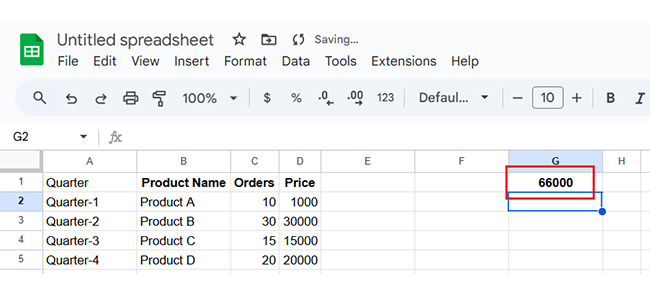
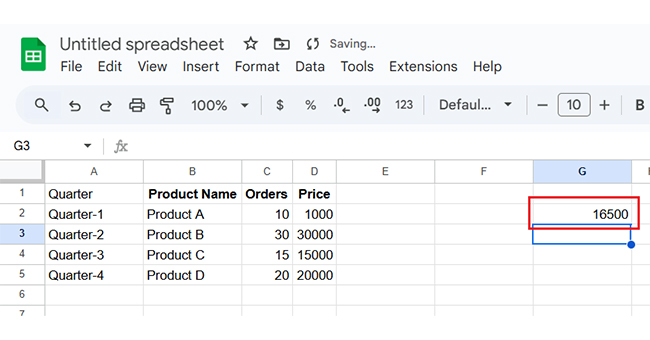
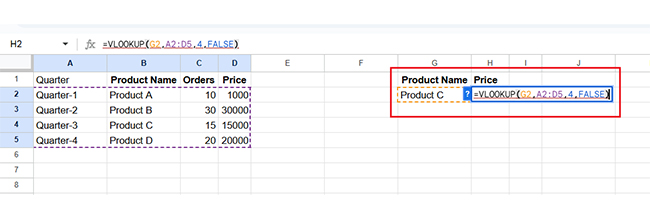
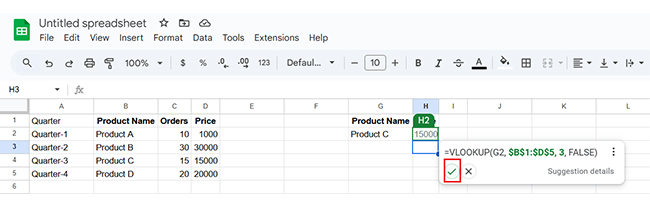
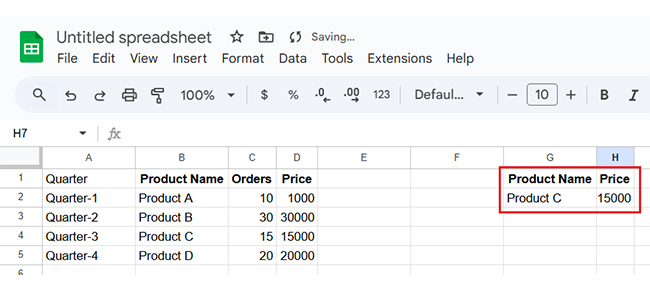
Google Sheets offers a vast library of built-in functions, including SUM, VLOOKUP, IF, and ARRAYFORMULA, making complex calculations easy. These functions help automate data analysis without manual intervention.
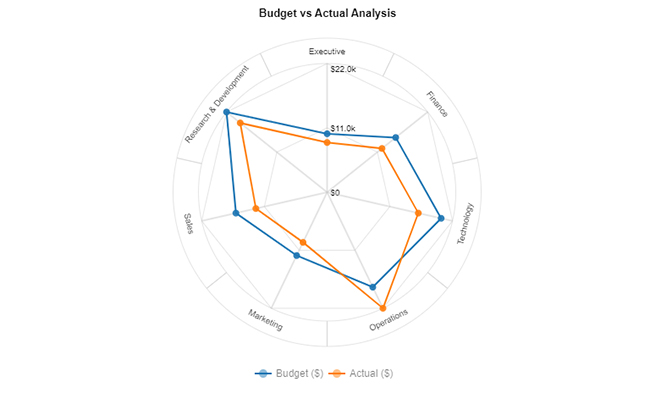
4. Data Visualization

Create various charts, graphs, and pivot tables to transform raw data into meaningful insights. The customization options allow you to highlight trends and patterns effectively.

5. Automation with Macros & Scripts

Google Sheets supports automation through Macros and Google Apps Script, enabling users to create custom workflows and automate repetitive tasks like data entry and report generation.

6. Integration with Google & Third-Party Apps

Seamlessly integrate Google Sheets with other Google services like Google Drive, Forms, and Docs. It also connects with third-party tools such as Zapier, Tableau, and Data Studio for extended functionality.

7. Conditional Formatting

Highlight key insights by applying custom formatting rules. Use color coding, data bars, and icon sets to make important data stand out at a glance.

8. Offline Mode

Even without an internet connection, you can work on your spreadsheets. Changes are automatically synced when you’re back online, ensuring uninterrupted workflow.

9. Version History

Track and restore previous versions of your spreadsheet without losing any data. You can see who made changes and revert to an earlier version if needed.

10. Data Validation & Protection

Set rules for data entry, such as drop-down lists and number limits, to maintain data accuracy. Additionally, you can protect specific sheets or ranges to restrict editing access.

Top 10 Functions List For Google Sheets With Application

Google Sheets functions simplify data tasks and improve efficiency. From simple calculations to complex data analysis, they are indispensable tools for effectively managing spreadsheets. Here are the top 10 functions to transform your workflow.

  1. SUM: Quickly adds up a range of numbers, perfect for budgets or sales data.
Adds Up Range of Numbers for Learning Google Sheets Functionality
    • After applying, it appears as follows:
Apply SUM Formula for Learning Google Sheets Functionality
  1. AVERAGE: Finds the mean of selected values, helping you analyze trends.
Finds Mean of Selected Values for Learning Google Sheets Functionality
    • After applying, it appears as follows:
Apply Average Formula for Learning Google Sheets Functionality
  1. VLOOKUP: VLOOKUP for Google Sheets searches for data in a table and returns a matching value, helping users quickly find and retrieve specific information within large datasets.
Searches for Data in Table Apply SUM Formula for Learning Google Sheets Functionality
    • Click on “Tick” as follows:
Click on Tick Apply SUM Formula for Learning Google Sheets Functionality
    • After applying, it appears as follows:
Apply VLOOKUP Formula for Learning Google Sheets Functionality
  1. IF: Creates conditional statements to make decisions within your sheet.
  2. INDEX: Retrieves specific data from a range based on its position.
  3. MATCH: Finds the relative position of a value in a range.
  4. COUNTIF: Counts cells that meet specific criteria, ideal for tracking categories.
  5. SUMIF: Adds values that meet certain conditions for targeted calculations.
  6. CONCATENATE: Combines text from multiple cells into one for streamlined data.
  7. ARRAY FORMULA: Applies a formula to an entire range, saving time with bulk operations.

How We Can Use Google Sheets Functionality For Data Evaluation?

Analyzing data can feel like solving a puzzle without a picture. Google Sheets makes it easier to bring data to life with basic charts. They reveal trends, patterns, and insights instantly.

Google Sheets’ charts try but sometimes disappoint. Enter ChartExpo a game-changer for data visualization. It transforms Google Sheets into a powerhouse of clear, impactful visuals.

ChartExpo makes data simple and creates insightful, appealing charts in minutes – no coding or design skills are needed. Moreover, it works seamlessly with Google Sheets, saving time and boosting insights.

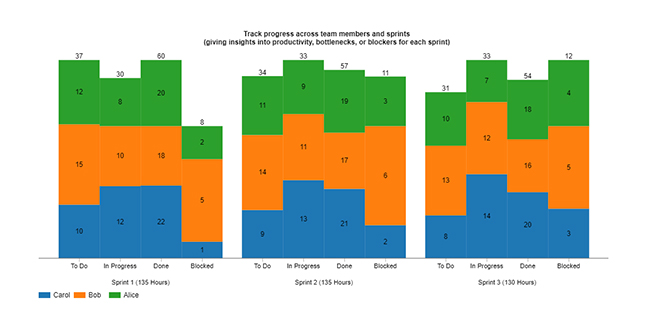
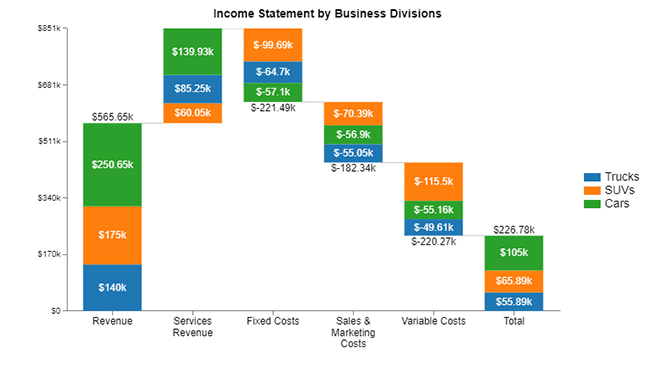
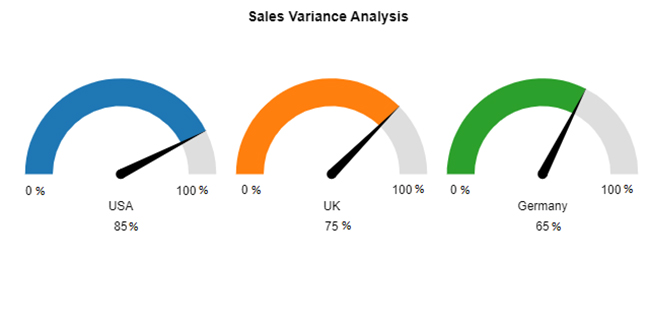
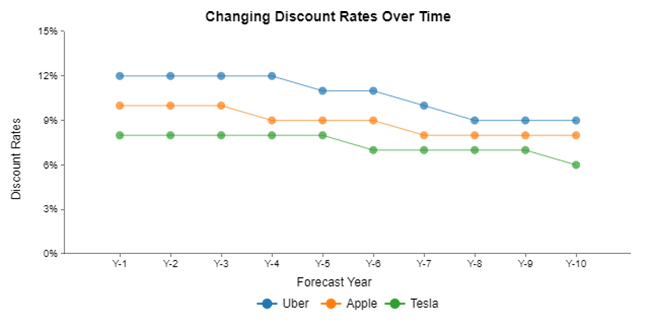
Below are the top 10 charts and graphs created in Google Sheets using ChartExpo:

Clustered Stacked Bar Chart

Clustered Stacked Bar Chart After Learning Google Sheets Functionality

Waterfall Chart

Waterfall Chart After Learning Google Sheets Functionality

Gauge Chart

Gauge Chart After Learning Google Sheets Functionality

Multi Series Line Chart

Multi Series Line Chart After Learning Google Sheets Functionality

Multi-Axis Line Chart

Multi Axis Line Chart After Learning Google Sheets Functionality

Horizontal Waterfall Chart

Horizontal Waterfall Chart After Learning Google Sheets Functionality

Comparison Bar Chart

Comparison Bar Chart After Learning Google Sheets Functionality

Likert Scale Chart

Likert Scale Chart After Learning Google Sheets Functionality

Circular Org Chart

Circular Org Chart After Learning Google Sheets Functionality

Sankey Chart

Sankey Chart After Learning Google Sheets Functionality

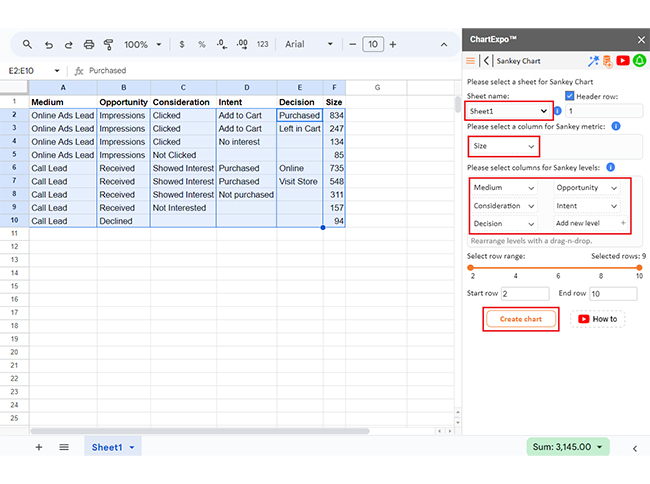
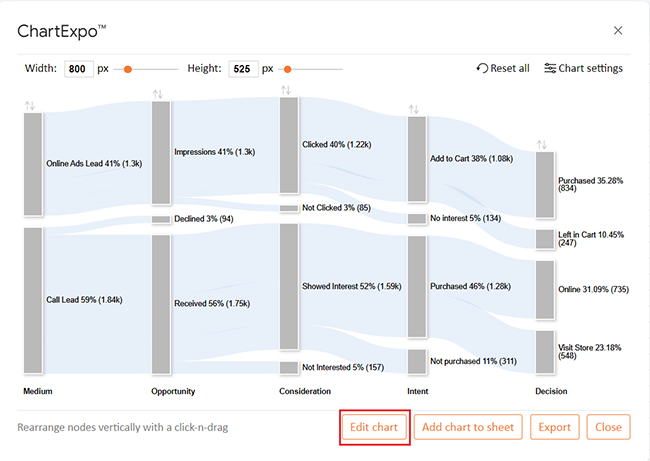
Let’s learn how to install ChartExpo in Google Sheets.

  1. To start using ChartExpo, download it directly from the Google Sheets program. To do this, select Extensions from the top toolbar.
  2. A menu will appear. Click the Get add-ons option.
  3. Search for ChartExpo, and click on Charts, Graphs & Visualizations by ChartExpo when it appears in the results.
  4. Click the Install button. You will have to confirm your Google account and accept some permissions.

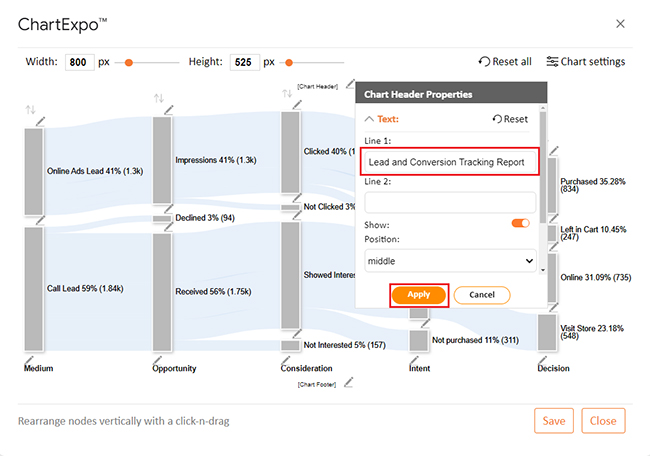
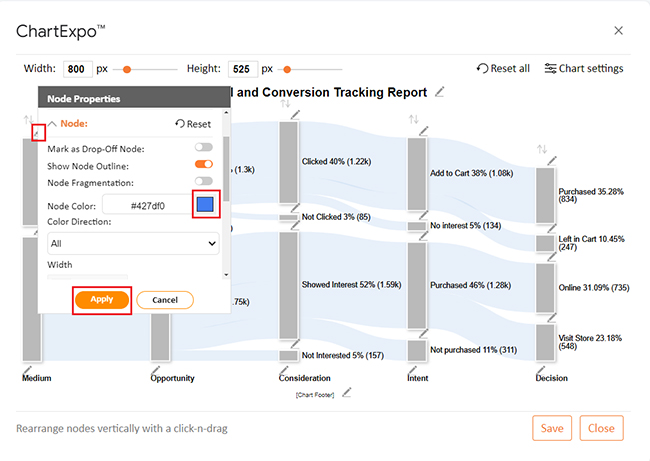
ChartExpo charts are available both in Google Sheets and Microsoft Excel. Please use the following CTAs to install the tool of your choice and create beautiful visualizations in a few clicks in your favorite tool.

Example

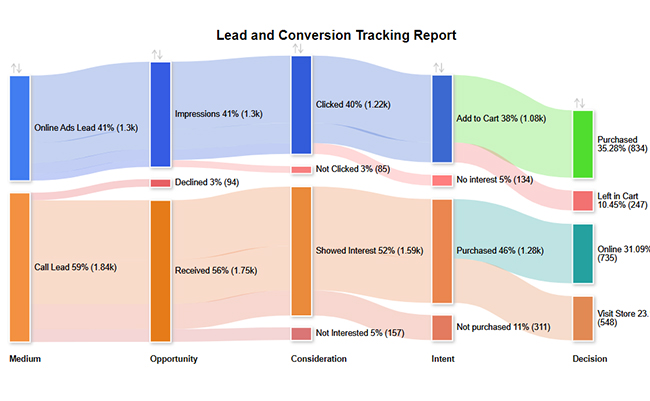
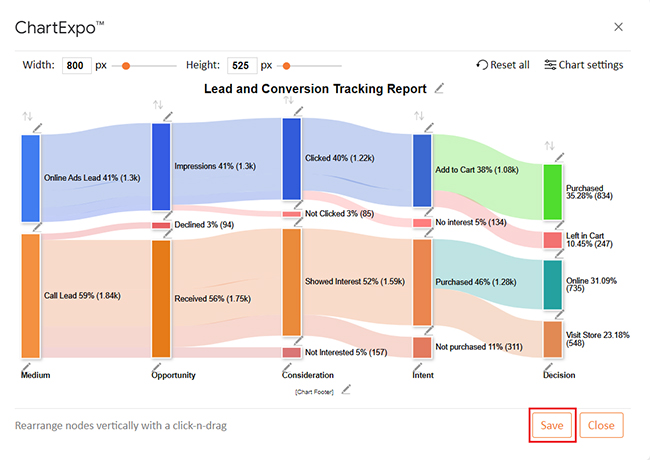
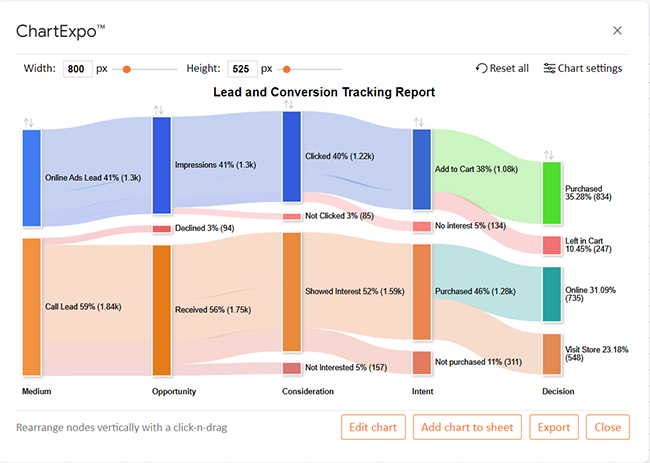
Let’s visualize this sample data in Google Sheets using ChartExpo and glean valuable insights.

Medium Opportunity Consideration Intent Decision Size
Online Ads Lead Impressions Clicked Add to Cart Purchased 834
Online Ads Lead Impressions Clicked Add to Cart Left in Cart 247
Online Ads Lead Impressions Clicked No interest 134
Online Ads Lead Impressions Not Clicked 85
Call Lead Received Showed Interest Purchased Online 735
Call Lead Received Showed Interest Purchased Visit Store 548
Call Lead Received Showed Interest Not purchased 311
Call Lead Received Not Interested 157
Call Lead Declined 94
  • To get started with ChartExpo, install ChartExpo in Google Sheets.
  • Go to Extensions > Charts, Graphs & Visualizations by ChartExpo > Open.
open chartexpo in google sheets
  • To access the charts library, click the Add new chart button.
add new chart in google sheets
  • Once ChartExpo is loaded. Click on “Sankey Chart”.
search sankey chart in google sheets
  • Select the sheet that contains your data.
  • Click the Create chart button to complete the process. ChartExpo will generate the visualization below for you.
Click Create Chart After Learning Google Sheets Functionality
  • Click the Edit chart button to make custom changes.
Click Edit Chart After Learning Google Sheets Functionality
  • To change the chart’s title, click the pencil icon next to the Chart Header.
  • It will open the properties dialog. Under the Text section, you can add a heading in Line 1 and enable the Show option. Give the appropriate title of your chart and click the Apply button.
Add Chart Header After Learning Google Sheets Functionality
  • You can change the colors of all Nodes as follows:
Change Colors of All Nodes After Learning Google Sheets Functionality
  • Click the “Save” button:
Click Save Button After Learning Google Sheets Functionality
  • Your final chart will appear as shown below.
Final Google Sheets Functionality

Insights

  • The data shows customer actions from online ads and call leads.
  • Online ads and interested call leads led to most purchases.
  • Some call leads were declined or resulted in no purchase.
  • Cart abandonment was observed in online ad interactions.

Benefits of Using Google Sheet Functionality

1. Real-Time Collaboration

Google Sheets allows multiple users to work on the same document simultaneously. Changes are reflected instantly, making it an ideal tool for teamwork and remote collaboration.

2. Cloud-Based Access

Since Google Sheets is cloud-based, you can access your spreadsheets from any device with an internet connection. This eliminates the need for manual file transfers and ensures your data is always up to date.

3. Automated Calculations & Advanced Formulas

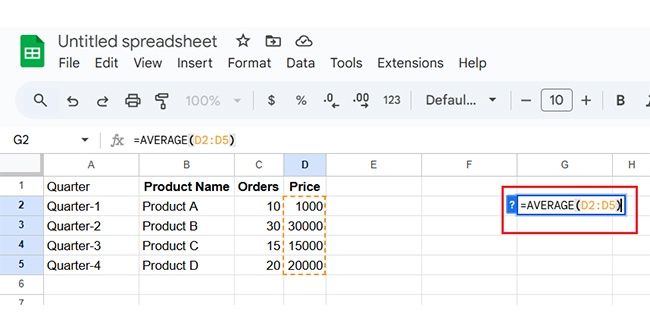
Google Sheets offers a wide range of built-in functions, including SUM, AVERAGE, VLOOKUP, and IF statements. These powerful formulas help automate calculations and streamline data analysis, saving time and reducing errors.

4. Seamless Integration with Other Tools

Google Sheets integrates effortlessly with other Google apps like Google Drive, Google Forms, and Google Analytics. Additionally, it supports third-party add-ons and APIs, allowing for enhanced functionality and automation.

5. Version History & Data Recovery

With automatic version tracking, Google Sheets allows users to view and restore previous versions of a file. This ensures data integrity, prevents accidental loss, and provides a reliable way to track changes over time.

Tips and Tricks for Maximizing Google Sheets Functionality

Google Sheets is packed with tools to simplify your work. With a few tips, you can save time, stay organized, and make your data work harder for you. Here are some of the ways to maximize its functionality.

  1. Use shortcuts and smart formatting: A few simple key combinations, from copy-pasting to formatting, can save your working hours. Combine this with conditional formatting to highlight key trends or flag errors automatically.
  2. Organize and streamline data entry: Data validation ensures clean, accurate inputs. Set rules for cells to accept only dates, specific values, or ranges. It reduces mistakes and keeps your data consistent.
  3. Analyze data with powerful tools: Pivot Tables and Array Formulas are best for analysis. Pivot Tables summarize large datasets in seconds, while Array Formulas let you perform calculations across multiple rows without repeating formulas.
  4. Expand features with add-ons: Add-ons bring extra power to your spreadsheets. Tools for analytics, project management, or even design integrations can simplify complex tasks.
  5. Collaborate and protect your work: It’s perfect for teams managing interconnected projects. For sensitive data, use the “Protect Sheet” feature to lock certain cells or restrict edits.

Google Sheets Functions FAQs

What are the basic functions available in Google Sheets for data analytics?

Google Sheets offers basic functions for data analytics, including SUM, AVERAGE, COUNT, IF, and VLOOKUP. These tools simplify calculations, analyze trends, and manage datasets effectively, making them essential for beginners and professionals working with data.

Does Google Sheets have functions like Excel?

Yes, it supports SUM, IF, VLOOKUP, and others. Excel offers advanced tools, and Google Sheets provides robust calculations, analysis, and automation features, making it a competitive alternative.

Wrap Up

Google Sheets’ functionality is versatile and user-friendly. It offers tools for basic calculations, advanced analysis, and seamless collaboration, making it a valuable asset for professionals and students.

From real-time editing to data visualization, Google Sheets simplifies complex tasks. Its formulas and functions help you to manage data efficiently. Whether you’re working on a budget or a large project, it adapts to your needs.

Collaboration is a standout feature. Multiple users can work together, no matter where they are, boosting productivity and keeping everyone aligned.

Automation options like Apps Script save time. Custom workflows can streamline repetitive tasks, allowing you to focus on more important goals.

Offline access adds flexibility. You can work without an internet connection and sync updates later, ensuring continuous productivity in any situation.

Conclusively, Google Sheets functionality transforms the way you manage data. Its range of features simplifies work and helps you achieve better results.

Do not hesitate.

Start using Google Sheets functionality with ChartExpo today and transform how you work with data.

How much did you enjoy this article?

GSAd2
Start Free Trial!
145519

Related articles

next previous
Google Sheets10 min read

Google Workspace for Education for Better Insights

Google Workspace for Education boosts collaboration and remote learning. Explore its features, benefits, and how ChartExpo enhances data analysis.

Google Sheets9 min read

Google Workspace Marketplace for Boosting Insights

Google Workspace Marketplace provides apps to enhance Gmail, Drive, and Docs. Learn about this tool and how to improve data visualization and analysis.

Google Sheets12 min read

Google Sheets CRM Templates for Insightful Decisions

Google Sheets CRM templates help businesses track contacts, sales, and customer data. Learn their benefits, setup steps, and expert tips to boost efficiency.

Google Sheets10 min read

Histogram Chart in Google Sheets: A Quick Walkthrough

A Google Sheets Histogram makes data visualization simple by revealing patterns. Learn how to create, customize, and optimize histograms for better insight.

Google Sheets10 min read

Google Sheets Amortization Schedule with Clear Visuals

A Google Sheets Amortization Schedule tracks loan payments, interest, and balances. Learn how to create your schedule for better loan management.

ChartExpo logo

Turn Data into Visual
Stories

CHARTEXPO

  • Home
  • Gallery
  • Videos
  • Services
  • Pricing
  • Contact us
  • FAQs
  • Privacy policy
  • Terms of Service
  • Sitemap

TOOLS

  • ChartExpo for Google Sheets
  • ChartExpo for Microsoft Excel
  • Power BI Custom Visuals by ChartExpo
  • Word Cloud

CATEGORIES

  • Bar Charts
  • Circle Graphs
  • Column Charts
  • Combo Charts
  • Comparison Charts
  • Line Graphs
  • PPC Charts
  • Sentiment Analysis Charts
  • Survey Charts

TOP CHARTS

  • Sankey Diagram
  • Likert Scale Chart
  • Comparison Bar Chart
  • Pareto Chart
  • Funnel Chart
  • Gauge Chart
  • Radar Chart
  • Radial Bar Chart
  • Sunburst Chart
  • see more
  • Scatter Plot Chart
  • CSAT Survey Bar Chart
  • CSAT Survey Chart
  • Dot Plot Chart
  • Double Bar Graph
  • Matrix Chart
  • Multi Axis Line Chart
  • Overlapping Bar Chart
  • Control Chart
  • Slope Chart
  • Clustered Bar Chart
  • Clustered Column Chart
  • Box and Whisker Plot
  • Tornado Chart
  • Waterfall Chart
  • Word Cloud
  • see less

RESOURCES

  • Blog
  • Resources
  • YouTube
SIGN UP FOR UPDATES

We wouldn't dream of spamming you or selling your info.

© 2025 ChartExpo, all rights reserved.