• Home
  • Tools dropdown img
    • Spreadsheet Charts

      • ChartExpo for Google Sheets
      • ChartExpo for Microsoft Excel
    • Power BI Charts

      • Power BI Custom Visuals by ChartExpo
    • Word Cloud

  • Charts dropdown img
    • Chart Category

      • Bar Charts
      • Circle Graphs
      • Column Charts
      • Combo Charts
      • Comparison Charts
      • Line Graphs
      • PPC Charts
      • Sentiment Analysis Charts
      • Survey Charts
    • Chart Type

      • Box and Whisker Plot
      • Clustered Bar Chart
      • Clustered Column Chart
      • Comparison Bar Chart
      • Control Chart
      • CSAT Survey Bar Chart
      • CSAT Survey Chart
      • Dot Plot Chart
      • Double Bar Graph
      • Funnel Chart
      • Gauge Chart
      • Likert Scale Chart
      • Matrix Chart
      • Multi Axis Line Chart
      • Overlapping Bar Chart
      • Pareto Chart
      • Radar Chart
      • Radial Bar Chart
      • Sankey Diagram
      • Scatter Plot Chart
      • Slope Chart
      • Sunburst Chart
      • Tornado Chart
      • Waterfall Chart
      • Word Cloud
    • Google Sheets
      Microsoft Excel
  • Services
  • Pricing
  • Contact us
  • Blog
  • Support dropdown img
      • Gallery
      • Videos
      • Contact us
      • FAQs
      • Resources
    • Please feel free to contact us

      atsupport@chartexpo.com

Categories
All Data Visualizations Data Analytics Surveys
Add-ons/
  • Google Sheets
  • Microsoft Excel
  • Power BI
All Data Visualizations Data Analytics Surveys
Add-ons
  • Google Sheets
  • Microsoft Excel
  • Power BI

We use cookies

This website uses cookies to provide better user experience and user's session management.
By continuing visiting this website you consent the use of these cookies.

Ok

ChartExpo Survey


Home > Blog > Google Sheets

Google Spreadsheet Integration for Effective Visuals

What does Google Spreadsheet integration mean to you? It’s a powerful tool for streamlining data management and improving productivity. In today’s fast-paced business landscape, staying ahead depends on how efficiently you handle and analyze data. This integration offers the flexibility to connect, automate, and simplify workflows, saving time and effort.

Google Spreadsheet Integration

Google Sheets has become a go-to platform for data collaboration. Its cloud-based accessibility makes it a favorite among teams working remotely or across multiple locations. Yet, the true power lies in its ability to integrate with various apps and tools. This integration transforms basic spreadsheets into dynamic, automated systems that work for you.

Imagine directly syncing your CRM, marketing tools, or analytics platforms with Google Sheets. It eliminates manual data entry and ensures consistency across platforms. This seamless flow of information can improve decision-making and reduce errors. For instance, sales teams using real-time integrations can track leads effortlessly, while marketers can monitor campaign performance at a glance.

Whether you’re managing financial data, tracking project milestones, or analyzing customer trends, integration can simplify your tasks. It lets you focus on insights rather than the process, enabling smarter and faster decisions. Finding effective tools like Google Spreadsheet integration is key to staying competitive in a data-driven world.

Table of Contents:

  1. What Does It Mean by Google Spreadsheet Integration?
  2. Why Integrate with Google Sheets?
  3. How Do You Integrate Data in Google Sheets?
  4. How to Connect Google Sheets with ChartExpo?
  5. What are the Limitations of Google Spreadsheet Integration?
  6. Wrap Up

First…

What Does It Mean by Google Spreadsheet Integration?

Definition: Google Spreadsheet integration connects Google Sheets with other apps or systems, enabling seamless data flow between platforms. By visualizing this process through data flow diagrams, you can better understand how integrations fetch, update, or analyze data in real-time, eliminating manual entry and streamlining operations.

Popular uses of Google Spreadsheet integration include syncing data from CRM analytics, project management tools, or APIs. These integrations enhance efficiency and accuracy by automating workflows. Tools like Zapier or APIs facilitate such connections, ensuring seamless data management.

Integration makes Google Sheets a powerful tool for managing and sharing data effectively.

Why Integrate with Google Sheets?

Google Sheets saves time, reduces errors, and keeps everyone on the same page. That’s the magic of integration. It transforms a simple spreadsheet into a powerhouse for your team.

How?

  • Streamline workflows: No more jumping between platforms. The integration connects your tools so data flows seamlessly.
  • Enhanced collaboration: Share updates instantly. Teams can work together, in real-time, from anywhere.
  • Centralized data management: Keep all your information in one place. Say goodbye to scattered files and confusion.
  • Improved decision-making: Access real-time insights with enhanced data quality, empowering you to make smarter, faster, and more informed decisions.
  • Boost productivity with automation: Automate repetitive tasks. Spend less time on admin and more on what matters.
  • Enhance scalability: As you grow, so does your system. Integration ensures your tools keep up with your needs.

How Do You Integrate Data in Google Sheets?

Whether you’re managing projects, tracking sales, or analyzing trends, Google Sheets offers seamless integration with various platforms, making it a versatile tool for all data tasks. By utilizing its capabilities, you can streamline workflows, boost productivity, and even create tailored solutions like a project status reports template. Here’s how you can bring it all together effectively:

  • Use built-in functions: Google Sheets offers powerful tools such as IMPORTRANGE, IMPORT DATA, and GOOGLEFINANCE. These functions enable you to pull real-time data from other spreadsheets, websites, or stock markets. They simplify data consolidation and keep your sheets automatically updated.
  • Leverage APIs: APIs allow seamless connections between apps and Google Sheets. With some basic scripting using Apps Script or other tools, you can fetch real-time data from almost any source. It is useful for tracking metrics, KPIs, automating data updates, or integrating with external databases.
  • Import or export files: Google Sheets makes uploading CSV or Excel files simple, ensuring you can work with data from various sources. You can export your data to other formats, allowing easy sharing or use in different platforms and systems.
  • Utilize third-party tools: Apps like Zapier and Make take integrations to another level. They help automate syncing between Google Sheets and hundreds of other tools, eliminating manual data entry and improving efficiency.

How to Connect Google Sheets with ChartExpo?

In the world of data analysis, Google Spreadsheet integration is a game-changer. It seamlessly connects your data workflows, enabling smarter insights. While Excel is a trusted tool, it often needs to improve regarding advanced data visualization. Creating impactful visuals can be tedious and limiting. Enter ChartExpo—a powerful solution that effortlessly transforms raw data into stunning, interactive visuals. Let’s explore how this integration redefines data visualization and boosts your analysis game.

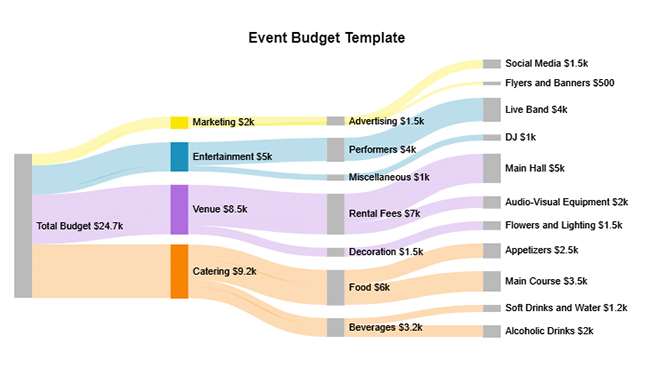
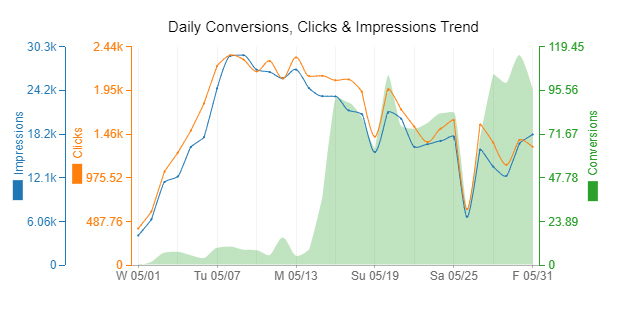
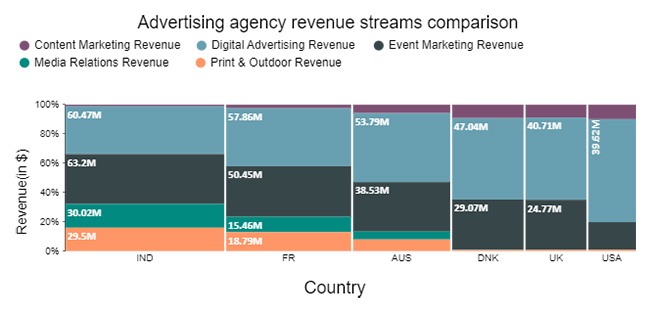
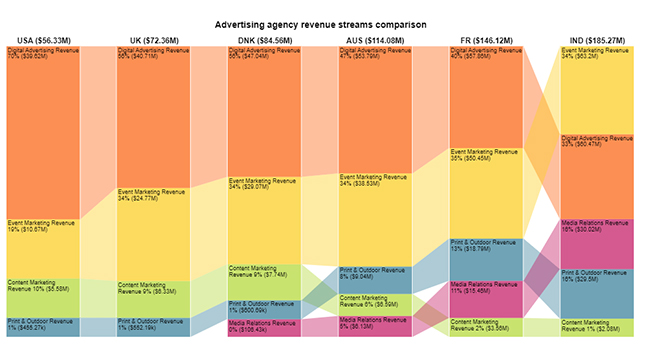
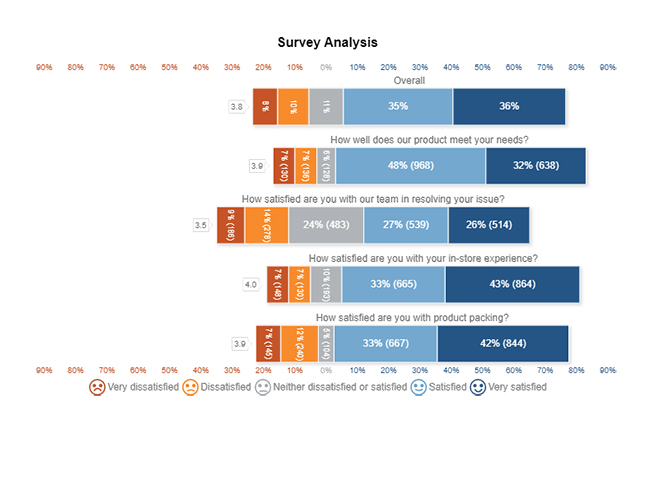
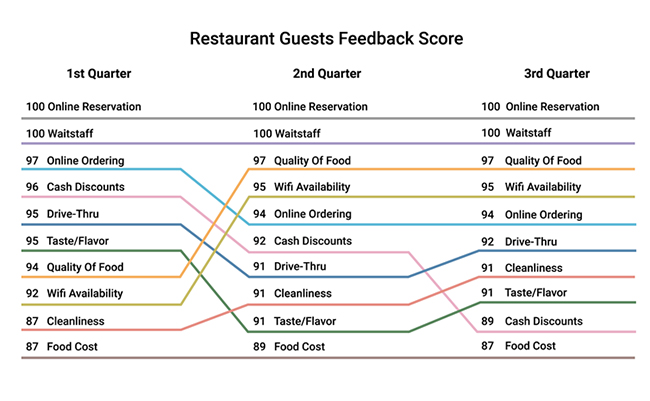
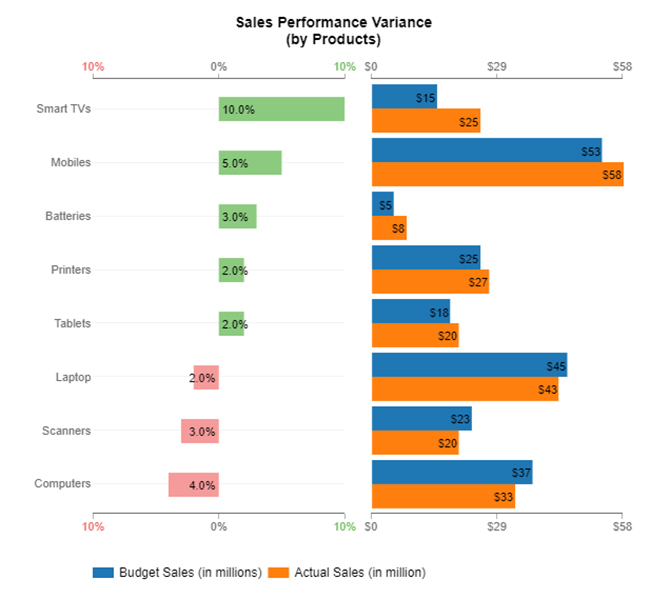
Below are the top 10 charts and graphs created in Google Sheets using ChartExpo:
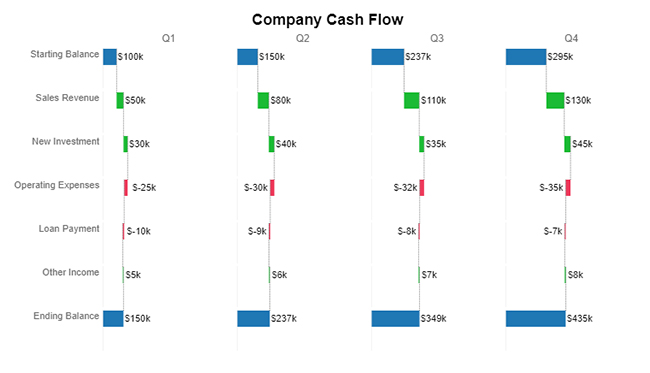
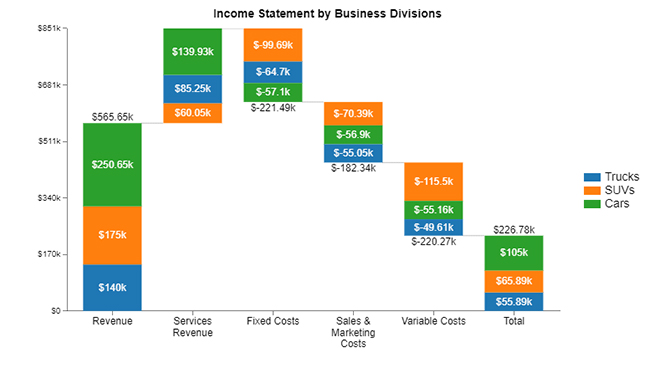
Sankey Chart

Sankey Chart After Doing Google Spreadsheet Integration

Multi Axis Line Chart

Multi Axis Line Chart After Doing Google Spreadsheet Integration

Mosaic Plot (aka Mekko)

Mosaic Plot After Doing Google Spreadsheet Integration

Horizontal Waterfall Chart

Horizontal Waterfall Chart After Doing Google Spreadsheet Integration

Comparison Bar Chart

Comparison Bar Chart After Doing Google Spreadsheet Integration

Likert Scale Chart

Likert Scale Chart After Doing Google Spreadsheet Integration

Slope Chart

Slope Chart After Doing Google Spreadsheet Integration

Progress Chart

Progress Chart After Doing Google Spreadsheet Integration

Waterfall Chart

Waterfall Chart After Doing Google Spreadsheet Integration

Funnel Chart (aka Pyramid Chart)

Funnel Chart After Doing Google Spreadsheet Integration

Let’s learn how to install ChartExpo in Google Sheets.

  1. To start using ChartExpo, download it directly from the Google Sheets program. To do this, select Extensions from the top toolbar.
  2. A menu will appear. Click the Get add-ons option.
  3. Search for ChartExpo, and click on Charts, Graphs & Visualizations by ChartExpo when it appears in the results.
  4. Click the Install button. You will have to confirm your Google account and accept some permissions.

ChartExpo charts are available both in Google Sheets and Microsoft Excel. Please use the following CTAs to install the tool of your choice and create beautiful visualizations in a few clicks in your favorite tool.

Example

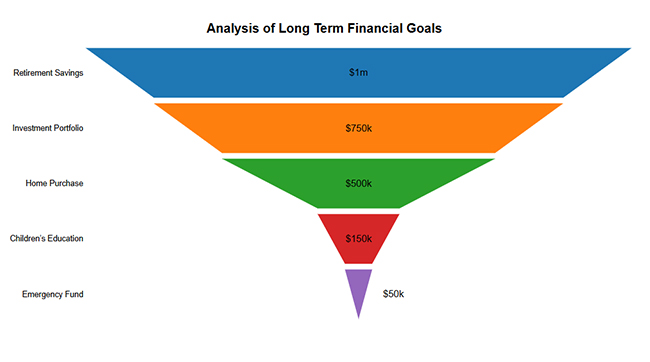
Let’s dive into analyzing and interpreting data in this sample using Google Sheets and ChartExpo.

Financial Goals Target Amount ($)
Children’s Education 150000
Emergency Fund 50000
Home Purchase 500000
Investment Portfolio 750000
Retirement Savings 1000000
  • To get started with ChartExpo, install ChartExpo in Google Sheets.
  • Go to Extensions > Charts, Graphs & Visualizations by ChartExpo > Open.
open chartexpo in google sheets
  • To access the charts library, click the Add new chart button.
add new chart in google sheets
  • Once ChartExpo is loaded. Click on “Funnel Chart (aka Pyramid Chart)”.
search funnel chart in google sheets
  • Select the sheet holding your data and select the Metric option. Fill in the numerical number.
  • Select the Dimensions button and fill in the dimensional data
  • Click the Create Chart button, as shown below.
Click Create Chart After Doing Google Spreadsheet Integration
  • ChartExpo will create the Funnel Chart (aka Pyramid Chart) below for you:
Initial Visual After Doing Google Spreadsheet Integration
  • Click the Edit chart button to make custom changes.
  • To change the title of the chart, click the pencil icon next to the Chart Header.
  • It will open the properties dialog. Under the Text section, you can add a heading in Line 1 and enable the Show option. Give the appropriate title of your chart and click the Apply button.
Add Chart Header After Doing Google Spreadsheet Integration
  • You can add the dollar sign with values as follows:
Add Prefix After Doing Google Spreadsheet Integration
  • After making all changes, click the “Save” button.
Click Save Button After Doing Google Spreadsheet Integration
  • Your final chart will appear as below.
Final Google Spreadsheet Integration

Insights

  • Retirement: Top priority with a target of $1,000,000.
  • Investments: Significant goal of $750,000 for growth.
  • Home purchase: Major focus with a $500,000 target.
  • Education: Key short- to mid-term goal.
  • Emergency fund: Essential for financial stability.

Transform Chart Analysis with Google Spreadsheet Integration:

  1. Open your Google Sheets Application.
  2. Install ChartExpo Add-in for Google Sheets from Google Workspace Marketplace.
  3. Select Funnel Chart from the list of charts.
  4. Fill in the necessary fields.
  5. Click on the “Create Chart” button.
  6. Customize your chart properties to add header, axis, legends, and other required information.
  7. Export your chart and share it with your audience.

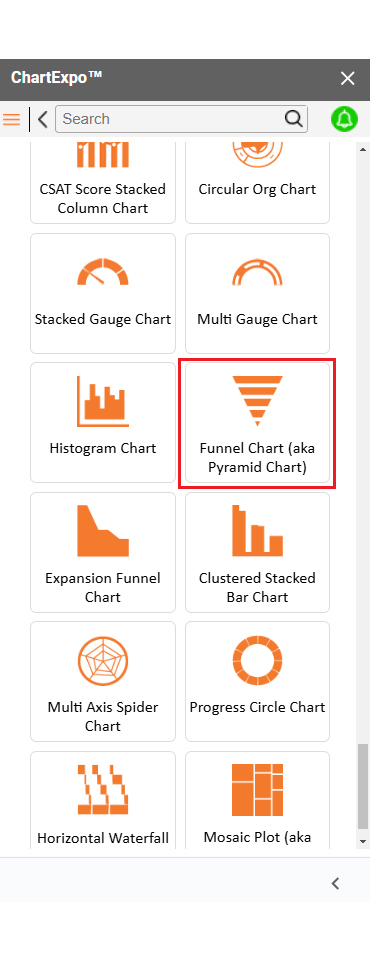
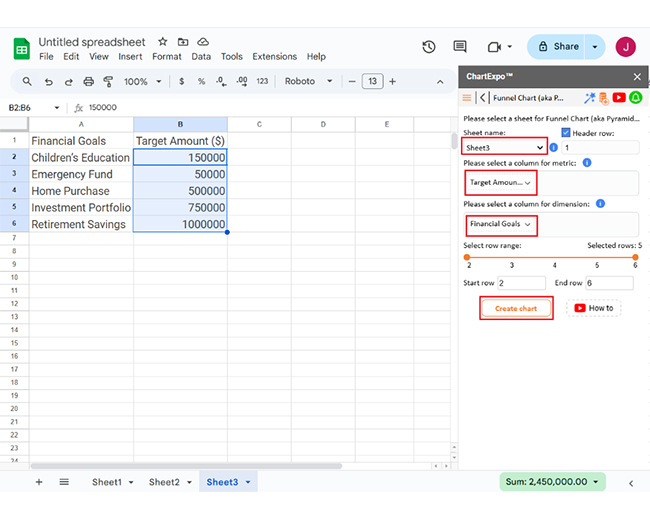
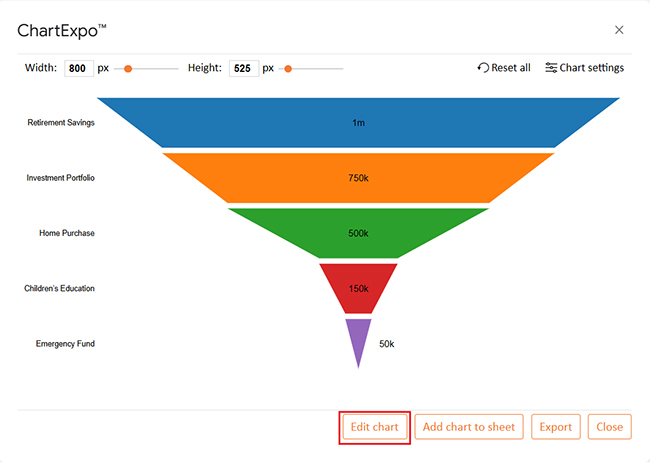
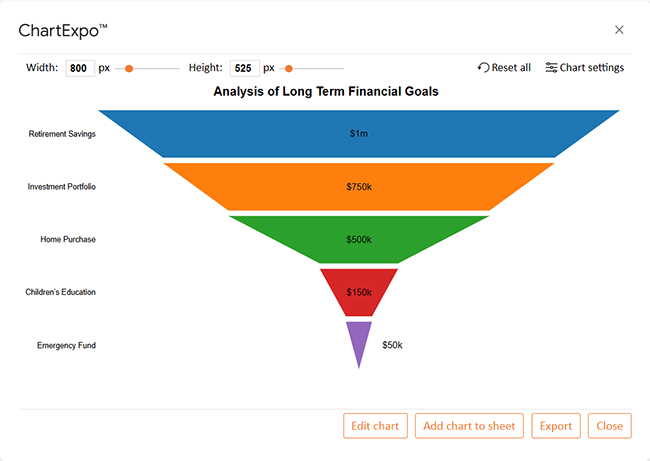
The following video will help you to create a Funnel Chart in Google Sheets.

What are the Limitations of Google Spreadsheet Integration?

Google Spreadsheet integration is a powerful tool, but it comes with challenges. While it simplifies data management and automation, certain limitations can impact performance and functionality. Let’s explore the key concerns:

  • Data size constraints: The limit of 10 million cells per sheet can be restrictive for extensive data analysis. This limitation particularly impacts businesses handling massive datasets and complex calculations.
  • API limitations: Frequent or high-volume requests can lead to errors, delays, or throttling. Developers and teams must plan carefully to avoid disruptions and ensure seamless operations.
  • Integration delays: Real-time syncing across platforms isn’t always flawless. Delays in data updates can disrupt data-driven decision-making, leading to inaccuracies and inefficiencies, particularly in time-sensitive tasks.
  • Security and privacy risks: Integrating third-party apps can expose sensitive data to vulnerabilities. Compliance with robust security standards is critical to protecting information from breaches and unauthorized access.

FAQs

Can you integrate with Google Sheets?

You can integrate with Google Sheets and connect it to other apps for seamless data sharing. Use built-in tools, APIs, or third-party apps like Zapier. Integration boosts efficiency, automates tasks, and effortlessly keeps data synchronized.

Does Google Keep integrate with Google Sheets?

Google Keep does not directly integrate with Google Sheets. However, you can manually copy notes or use tools like Google Apps Script for automation. Third-party apps like Zapier can also help bridge the gap for specific workflows.

Wrap Up

Google Spreadsheet integration is more than a convenience. It’s a way to simplify and streamline data processes. By connecting your tools, you reduce manual effort and improve efficiency.

This integration bridges gaps between platforms. It ensures data flows smoothly across systems. Real-time updates minimize errors and save time. Businesses gain better control over their workflows.

Despite its strengths, challenges remain. Data size limits and API restrictions can hinder progress, while syncing delays may impact time-sensitive tasks. Security is also a valid concern with integrations.

Even so, the benefits often outweigh the drawbacks. Teams can automate repetitive tasks and focus on strategy, and real-time data access enhances decision-making capabilities.

To get the most from it, use integrations strategically. Pair Google Sheets with tools that complement your needs and review workflows regularly for efficiency and security.

Do not hesitate.

Start using Google Spreadsheet integration with ChartExpo in your data management today. The right approach will elevate your productivity and insights.

How much did you enjoy this article?

GSAd1
Start Free Trial!
145483

Related articles

next previous
Google Sheets10 min read

Google Sheets Amortization Schedule with Clear Visuals

A Google Sheets Amortization Schedule tracks loan payments, interest, and balances. Learn how to create your schedule for better loan management.

Google Sheets11 min read

Google Sheet Profit and Loss Template for Financial Success

Google Sheet profit and loss template simplifies tracking income and expenses. Learn tips and steps for using this template for better financial management.

Google Sheets11 min read

Sales Tracking Spreadsheet for Better Insights

A Spreadsheet for Sales Tracking organizes data, tracks performance, and analyzes trends. This guide covers its benefits, templates, and visualization tips.

Google Sheets11 min read

How to Create a Chart in Google Sheets in Few Steps?

Learn step-by-step how to create a chart in Google Sheets to visualize your data clearly and effectively, even if you're a beginner.

Google Sheets14 min read

How to Use Google Spreadsheet for Insightful Results

Learn how to use Google Sheets for data management. You’ll discover tips on adding data, using formulas, creating charts, and more to streamline your work.

ChartExpo logo

Turn Data into Visual
Stories

CHARTEXPO

  • Home
  • Gallery
  • Videos
  • Services
  • Pricing
  • Contact us
  • FAQs
  • Privacy policy
  • Terms of Service
  • Sitemap

TOOLS

  • ChartExpo for Google Sheets
  • ChartExpo for Microsoft Excel
  • Power BI Custom Visuals by ChartExpo
  • Word Cloud

CATEGORIES

  • Bar Charts
  • Circle Graphs
  • Column Charts
  • Combo Charts
  • Comparison Charts
  • Line Graphs
  • PPC Charts
  • Sentiment Analysis Charts
  • Survey Charts

TOP CHARTS

  • Sankey Diagram
  • Likert Scale Chart
  • Comparison Bar Chart
  • Pareto Chart
  • Funnel Chart
  • Gauge Chart
  • Radar Chart
  • Radial Bar Chart
  • Sunburst Chart
  • see more
  • Scatter Plot Chart
  • CSAT Survey Bar Chart
  • CSAT Survey Chart
  • Dot Plot Chart
  • Double Bar Graph
  • Matrix Chart
  • Multi Axis Line Chart
  • Overlapping Bar Chart
  • Control Chart
  • Slope Chart
  • Clustered Bar Chart
  • Clustered Column Chart
  • Box and Whisker Plot
  • Tornado Chart
  • Waterfall Chart
  • Word Cloud
  • see less

RESOURCES

  • Blog
  • Resources
  • YouTube
SIGN UP FOR UPDATES

We wouldn't dream of spamming you or selling your info.

© 2025 ChartExpo, all rights reserved.