Categories
So, you’ve come across cloud-based data warehouses and would like to figure out how they operate?


You’re in the right place. We will reveal how these cloud-based data warehouses work behind the scenes.
Picture this: a virtual haven where huge amounts of information are methodically organized, analyzed, and stored with unmatched efficiency. The cloud-based data warehouse has transformed data management in a virtual setting by centralizing storage and processing. It offers unmatched scalability and flexibility.
Understanding how cloud-based data warehouses work is not only crucial for technology enthusiasts. It’s also vital for businesses striving to stay competitive in an increasingly data-driven landscape.
Why?
Cloud-based data warehouses have changed the way organizations handle their data. They empower organizations to make informed decisions, drive innovation, and gain a competitive edge in their respective industries.
So, let us demystify the cloud-based data warehouse. This way, you will appreciate how elegant and efficient these cloud marvels are.
First…
Definition: A cloud-based data warehouse is a virtual repository for storing, managing, and analyzing data in the cloud. This data warehouse operates digitally, unlike traditional data warehouses, which rely on on-premises hardware. It leverages cloud computing resources to store massive volumes of data, offering scalability and flexibility.
Data is stored in a structured manner and organized into tables and columns for efficient querying and analysis. You can access the data warehouse remotely through the internet, eliminating the need for physical infrastructure maintenance. Cloud-based data warehouses employ distributed computing techniques to process queries quickly and efficiently, regardless of the dataset size.
This modern approach to data warehousing allows businesses to adapt to changing data needs rapidly and cost-effectively. It makes it a popular choice for organizations seeking to harness the power of big data.
A data warehouse is used to centralize and store large amounts of structured data from multiple sources, allowing businesses to perform complex queries, generate reports, and conduct data analysis. It supports decision-making, business intelligence, and trend analysis by providing a unified, consistent view of the organization’s data over time.
Data in cloud-based data warehouses flows like a digital river, meticulously organized and effortlessly analyzed. Let’s delve into the inner workings of these celestial repositories.
| Category | Traditional Data Warehouse | Cloud-Based Data Warehouse |
|---|---|---|
| Infrastructure | Requires on-premise hardware | Fully hosted in the cloud |
| Scalability | Limited, costly to scale | Scalable on-demand |
| Cost | High upfront and maintenance costs | Pay-as-you-go model |
| Maintenance | In-house IT support needed | Managed by the cloud provider |
| Flexibility | Difficult and slow to upgrade | Easily adjustable and flexible |
| Performance | May degrade as data grows | Optimized with automatic scaling |
| Accessibility | Location-bound, on-premise access | Accessible from anywhere online |
A fully managed, scalable data warehouse service from AWS that allows you to run complex queries and perform big data analytics.
A serverless, highly scalable, and cost-effective data warehouse from Google Cloud, designed for running super-fast SQL queries on large datasets.
An integrated analytics service from Microsoft that combines big data and data warehousing capabilities, enabling complex queries and data analysis.
A cloud-native data platform that provides a fully managed data warehouse with capabilities for data storage, processing, and sharing.
A fully managed data warehouse solution from IBM that offers high-performance analytics and flexible deployment options.
Cloud-based data warehouse solutions offer a host of key features. Each feature empowers you to seek actionable insights and make data-driven decisions.
Why?
1. Amazon Redshift
2. Google BigQuery
3. Microsoft Azure Synapse Analytics
4. Snowflake
5. IBM Db2 Warehouse on Cloud
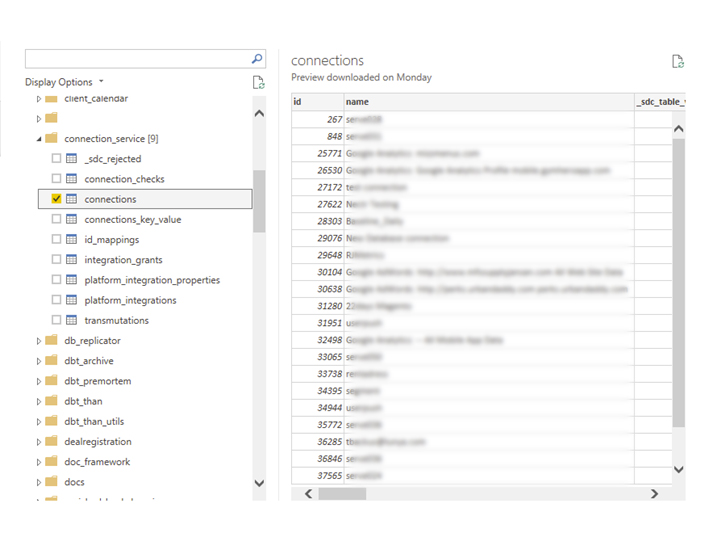
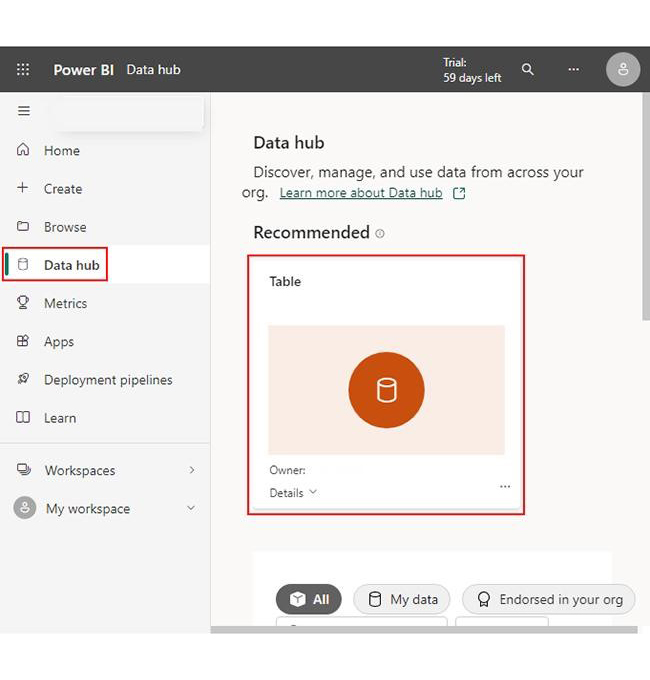
Power BI opens a Navigator window that lets you select data sources. You start with the connections table in our service schema, which records all client connections to data sources.
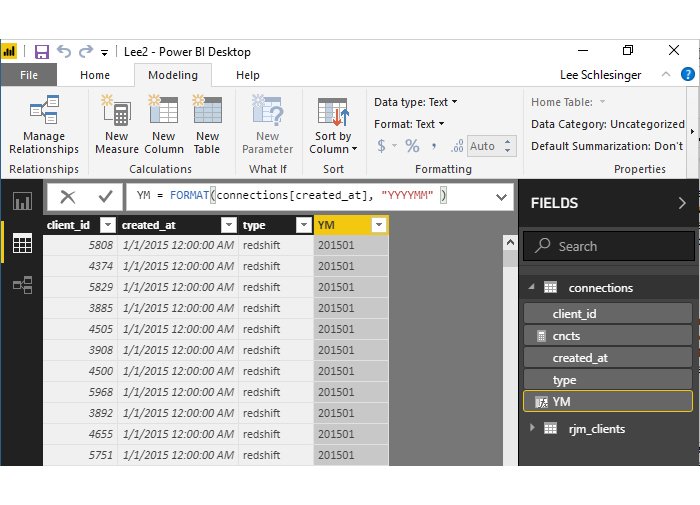
Using the Data view in Power BI Desktop’s left column, you prepare the data. Then, surplus columns are removed by right-clicking their names and selecting Delete.
A properly formatted date for sorting and a monthly display for each connection is needed. You add a new column with a formatted version of the created timestamps from the connections table. Using Power BI’s Modeling tab, _New Column is chosen and the formatting is specified using PowerBI’s Data Analytics Expression (DAX) language.
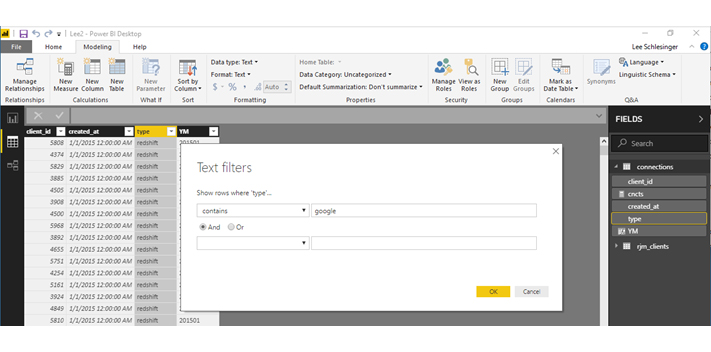
Focusing solely on connections linked to Google Analytics, a text filter on the “type” field is implemented to restrict the query to rows containing the string “google”.
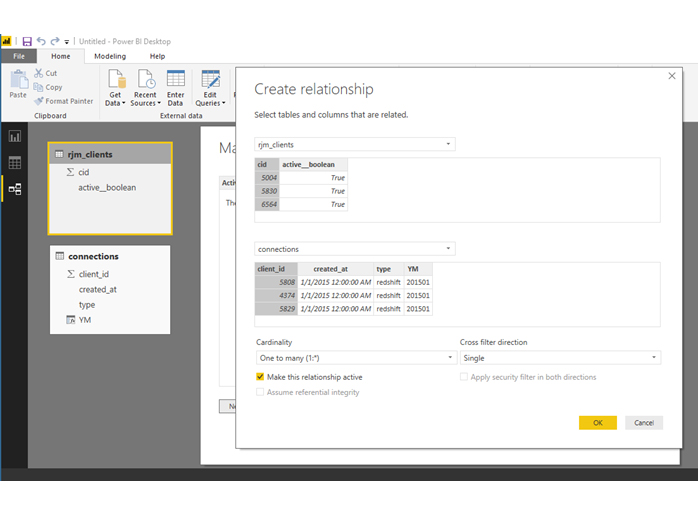
Next, you return to the Navigator and import data from another source: the rjm_clients table from our platform schema, encompassing all client information. Unnecessary columns are eliminated, retaining only the client ID and a Boolean indicator of client activity. Then, proceed to establish how Power BI should link the two tables. Click the Relationships and Manage Relationship buttons in the Home tab. This brings up the Relationships view, where foreign key relationships are configured by associating key fields across tables, specifically the client IDs.
With all desired data filtered and appropriately joined, a transition to the Report view is made.
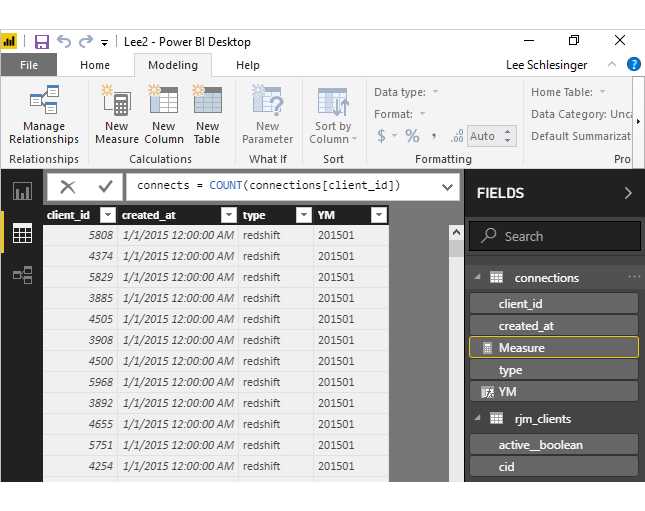
Here, a new Measure is created using a DAX function, defining “connects” with COUNT(connections[client_id]). In this syntax, connections is the table, and client_id is the field name.
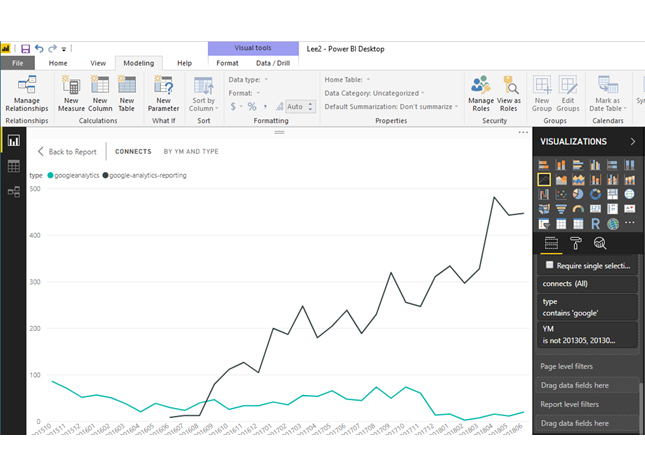
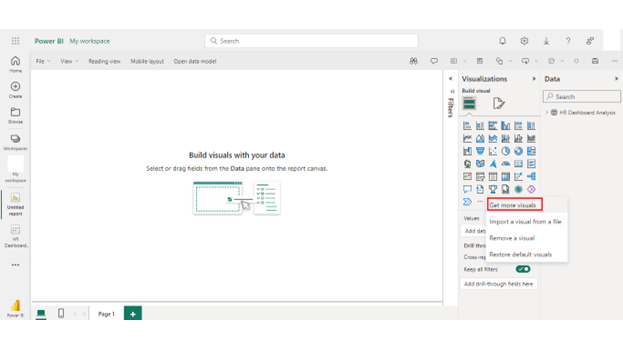
Next, the line chart icon in the visualization pane is clicked. “YM” is dragged to the Axis field, “Type” to the Legend field, and “connects” to the Values field.
Upon initial data review, it was noticed that the timeframe needs to be revised. Filters are applied in the report pane, similar to those in the data pane, to limit only the “type” field to “Google” values.
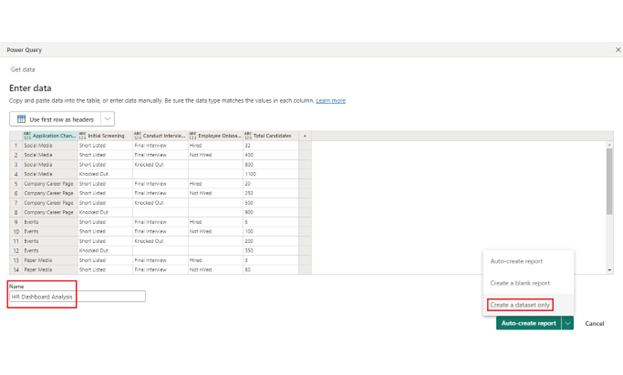
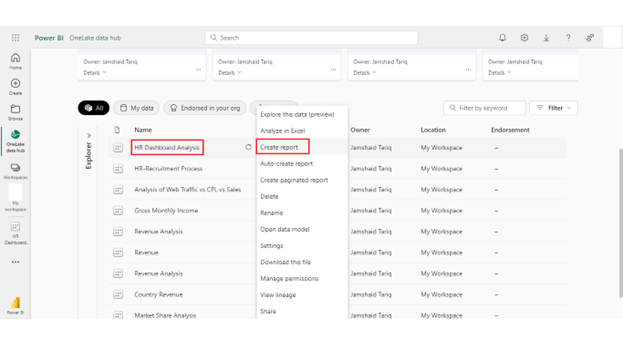
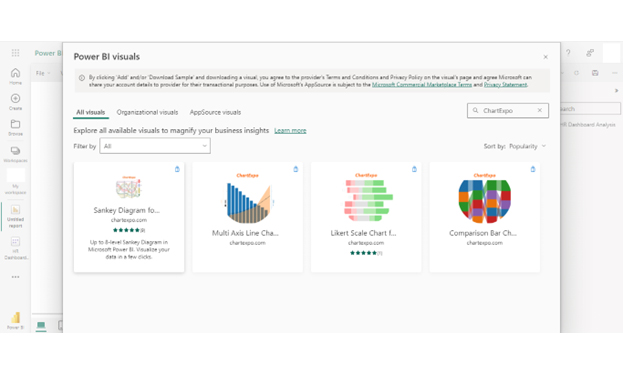
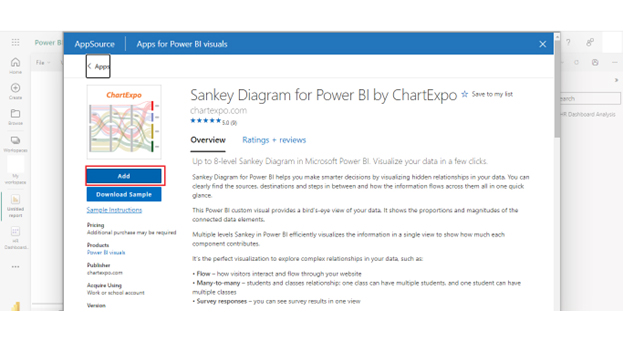
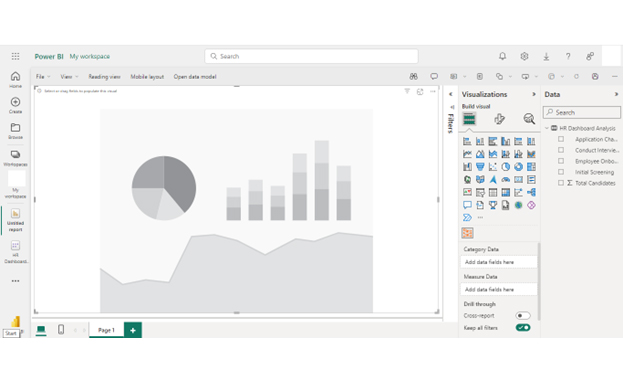
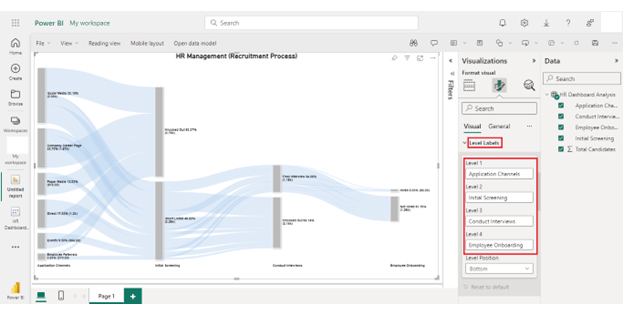
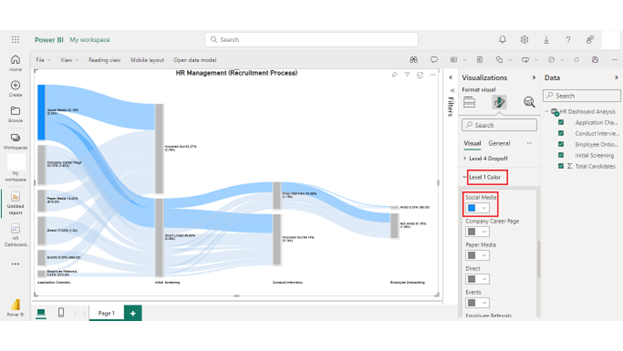
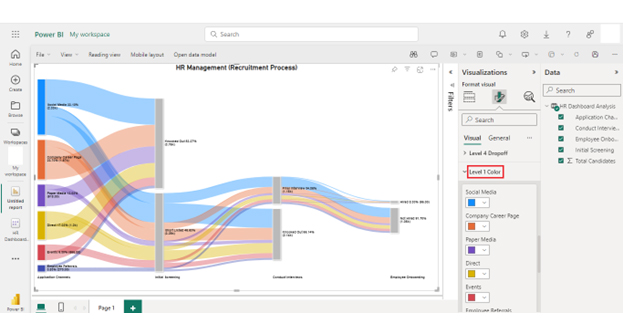
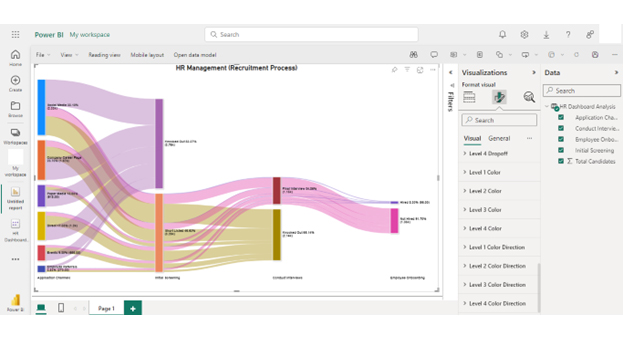
Here is a step-by-step process for creating a visualization, such as a Sankey diagram in Power BI, to illustrate complex data flows and relationships with clarity and precision using a Sankey diagram generator.


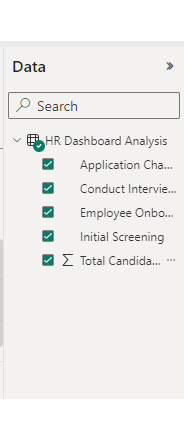
| Application Channels | Initial Screening | Conduct Interviews | Employee Onboarding | Total Candidates |
| Social Media | Short Listed | Final Interview | Hired | 32 |
| Social Media | Short Listed | Final Interview | Not Hired | 400 |
| Social Media | Short Listed | Knocked Out | 800 | |
| Social Media | Knocked Out | 1100 | ||
| Company Career Page | Short Listed | Final Interview | Hired | 20 |
| Company Career Page | Short Listed | Final Interview | Not Hired | 250 |
| Company Career Page | Short Listed | Knocked Out | 500 | |
| Company Career Page | Knocked Out | 900 | ||
| Events | Short Listed | Final Interview | Hired | 5 |
| Events | Short Listed | Final Interview | Not Hired | 100 |
| Events | Short Listed | Knocked Out | 200 | |
| Events | Knocked Out | 350 | ||
| Paper Media | Short Listed | Final Interview | Hired | 3 |
| Paper Media | Short Listed | Final Interview | Not Hired | 80 |
| Paper Media | Short Listed | Knocked Out | 135 | |
| Paper Media | Knocked Out | 700 | ||
| Employee Referrals | Short Listed | Final Interview | Hired | 10 |
| Employee Referrals | Short Listed | Final Interview | Not Hired | 70 |
| Employee Referrals | Short Listed | Knocked Out | 80 | |
| Employee Referrals | Knocked Out | 110 | ||
| Direct | Short Listed | Final Interview | Hired | 25 |
| Direct | Short Listed | Final Interview | Not Hired | 150 |
| Direct | Short Listed | Knocked Out | 425 | |
| Direct | Knocked Out | 600 |

Cloud-based systems may experience latency due to network bandwidth issues, affecting data processing and query performance.
Although cost-efficient, cloud services can become expensive with growing data volumes and increased usage if not monitored properly.
Migrating data between different cloud providers can be challenging, leading to dependency on a single vendor’s infrastructure and tools.
Organizations may face a shortage of skilled professionals to effectively manage and optimize cloud data warehouses.
Managing data ownership, quality, and accessibility in the cloud requires clear policies and governance frameworks.
Pay-as-you-go pricing reduces upfront infrastructure costs and allows for more efficient spending.
Access data from anywhere with an internet connection, enabling real-time collaboration and remote work.
Cloud data warehouses offer fast query processing and automatic resource allocation to handle large datasets efficiently.
Seamless integration with advanced analytics, AI, and BI tools enables better insights and data-driven decision-making.
Evaluate the pricing model (pay-as-you-go vs. subscription) and ensure it fits your budget and expected usage.
Assess the platform’s query speed, performance benchmarks, and ability to handle large datasets without latency.
Ensure the solution offers robust security features (encryption, access control) and complies with industry regulations (GDPR, HIPAA).
Check if the solution integrates well with your existing data sources, ETL tools, and analytics platforms.
Opt for a platform that’s user-friendly and doesn’t require extensive management, with automated maintenance features.
Consider the provider’s customer support, uptime guarantees, and service-level agreements (SLAs) for reliability.
Determining the best cloud data warehouse depends on specific needs and preferences. Popular options include Amazon Redshift, Google BigQuery, Snowflake, and Microsoft Azure Synapse Analytics. Each offers unique features and pricing structures tailored to different use cases and organizational requirements.
Cloud-based data warehouses are scalable, flexible, and cost-effective solutions for storing and analyzing large volumes of data. They offer seamless integration with various data sources, robust security measures, high performance, and ease of use.
A database is designed for transactional processing, handling real-time data interactions. In contrast, a data warehouse is optimized for analytical processing, storing, and analyzing large volumes of historical data. Data warehouses often consolidate data from multiple sources for comprehensive analysis.
In conclusion, the workings of cloud-based data warehouses are a testament to modern data management’s evolution. Through scalable infrastructure and flexible architecture, they accommodate diverse data needs with ease. These warehouses process queries swiftly by leveraging distributed computing, unleashing insights from vast datasets.
The journey begins with data ingestion, where information from various sources finds its celestial abode in the cloud. Here, it undergoes meticulous storage and organization, setting the stage for efficient processing. With the power of distributed computing, data is transformed and analyzed, paving the way for actionable insights.
Security measures safeguard sensitive information, while integration with analytics tools empowers you to extract actionable insights. The pay-as-you-go model of cloud data warehouses ensures cost-effectiveness, eliminating the need for hefty upfront investments in hardware.
From data ingestion to query execution, every step in the process is meticulously orchestrated. With a focus on scalability, flexibility, and cost-effectiveness, these warehouses offer a strategic advantage in the data-driven landscape.
In essence, the workings of cloud-based data warehouses epitomize the convergence of technology and necessity. They represent a technological evolution and a paradigm shift in how we approach data management.
How much did you enjoy this article?


Discover diverse and high-quality Power BI report examples for inspiration and insights. Elevate your reporting with strategic visualization techniques.

A Customer Relationship Management Dashboard centralizes data, tracks key metrics, and drives smarter business decisions. Discover now!

Explore Healthcare Dashboard Examples and learn how to turn complex healthcare data into clear, actionable insights for better decision-making.


