Categories
People care about their anonymity, especially online. They are happy to provide feedback, but not when their personal information is at stake.


It’s something we’re all worried about – our personally identifying information leaking to nefarious parties.
The Google Forms anonymous survey tool removes this concern from research participants. They don’t have to feel uneasy submitting their responses.
Moreover, anonymous surveys create more honest responses. People are more likely to share private sentiments when their identity is secret.
This is particularly true of employee feedback. They may not feel comfortable criticizing the company they work for. However, they’ll share their feelings openly if you give them an anonymous survey.
With Google Forms, you create anonymous questionnaires in mere minutes. The agility of Google Forms means you can receive anonymous feedback immediately.
When your anonymous surveys turn up actionable insights, you can make changes quickly. You’ll take complete advantage of every opportunity or risk in your survey data.
This discussion will explore how to create an anonymous survey in Google Forms. We’ll also explore the benefits of a Google Forms anonymous survey.
Let’s begin.
Definition: A “Google Forms Anonymous Survey” refers to a survey created using Google Forms in which the respondents’ identities or personal information are kept confidential.
In an anonymous survey, the creator of the survey does not collect any identifying information from the respondents, such as names, email addresses, or any other data that could be used to trace individual responses back to a specific person.
Google Forms is an online creator capable of sending many different types of questionnaires and documents.
For example, you can send:
Most businesses use the tool as a free online survey maker. It’s one of the best solutions for discovering new audience insights. It’s these discoveries that can lead to positive changes in your company.
A Google Forms anonymous survey is just as it sounds. You’re sending a survey that participants respond to anonymously. Alternatively, an anonymous survey may be where the respondents, are unknown.
With Google Forms, it is possible to send both types of anonymous surveys.
Anonymous surveys can be a useful tool in various situations where individuals might be hesitant to share their honest opinions or information due to fear of judgment, reprisal, or social consequences. Here are some scenarios in which anonymous surveys are commonly employed:
Before discussing how to create an anonymous survey with Google Forms, we must cover how to start using this survey maker.
Google Forms requires a Google account to use. You may already meet this requirement if you use other Google services (Gmail, YouTube, etc.).
Once signed in with your account, you can access Google Forms through any tool or site under the Google label. This includes Gmail, YouTube, Google Sheets, or even simply Google.com.
From these pages, click the grid of dots in the top right corner. This opens the menu for all Google Apps. Scroll down until you find Google Forms.

The main Google Forms page shows you a list of possible templates to use. The Customer Feedback, Event Feedback, or Order Form templates are the best for surveys.
As you get more comfortable using Google Forms, you should begin using blank forms. This allows you to build your surveys from scratch.

Google Forms offers many options when creating an anonymous survey. Here are some features you can utilize:
Before sending the form to others, we need to check a few settings. This will determine whether or not we’re creating a Google Forms anonymous survey or not.
Click the “Settings” tab at the top and then click the “Responses” field to expand it.

This will give you several options for making your Google survey anonymous. You’ll want to make sure none of these options are on.

It’s important to note the “Limit to 1 response” option. This requires participants to sign in with an email address. However, you could have the same person taking your survey multiple times. It could skew your results’ accuracy.
These options will preserve the anonymity of the survey participants. If you want to send surveys anonymously, there are some additional steps you need to take.
It will largely depend on how you choose to send your surveys. If you email it to your target audience, you lose some anonymity. Participants will see your email.
The other option is to use a direct link. Then, you can share this link through private channels. For instance, you could join a relevant Facebook group using a non-company account and post your Google survey anonymously.
Google Forms anonymous surveys generate results quickly. Again, you’re removing some people’s apprehension about submitting personal information to take a survey.
Use the “Responses” tab to access your Google Forms anonymous survey results.

This creates a dropdown menu with the option to download your responses as a .csv file.
Choose the location on your device for the file download to go. Then, open up Excel, import the .csv file, and presto! Your Google Forms data is now in Excel!
Now that your Google Forms anonymous survey results are in Excel (or Google Sheets), it’s time for analysis.
Excel is a phenomenal data tool, but only to a certain point. Spreadsheets help you collect and organize information. It can also make calculations easier.
The weakness of spreadsheets is their lack of charting options. Charts have a transformative power in analysis.
You can’t reach effective or accurate conclusions by analyzing raw data alone. Your brain doesn’t understand a huge wall of thousands of numbers. Unfortunately, that’s exactly how spreadsheets present data.
Charts, on the other hand, convert that confusing wall of data into an easy-to-digest visual. It’s about seeing your data instead of drawing conclusions from raw numbers.
The brain understands visual depictions much better. This is why we always say a picture is worth a thousand words. One chart is worth thousands of numbers!
Excel offers some charting options, but many aren’t inherently designed to visualize survey data. The best visual analysis occurs when you depict the data with a specialized survey chart. For example, there is the Likert Scale Chart or CSAT Score Chart.
To overcome the lack of survey charts in Excel, you need a tool like ChartExpo. This is an add-in that expands the charting options significantly.
Additionally, ChartExpo offers a simple, three-click chart-making system. There is no easier method for creating charts in this spreadsheet tool.
How to Install ChartExpo in Microsoft Excel?
ChartExpo charts are available both in Google Sheets and Microsoft Excel. Please use the following CTA’s to install the tool of your choice and create beautiful visualizations in a few clicks in your favorite tool.


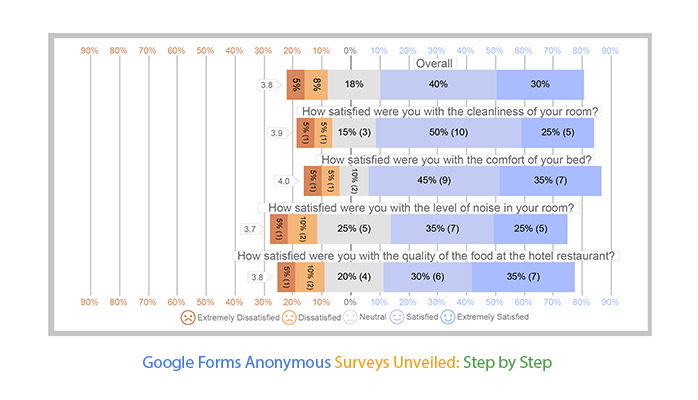
The following section will detail how to visualize anonymous survey data using this powerful data visualization tool. Likert Scale Charts are one of the best ways to analyze survey data visually.
Let’s say you want to do a hotel customer satisfaction survey. First, let’s have a look at the questions that you have asked customers:
Below are the responses (feedback) that are associated with each question:
Once your data is ready in Excel it may look like below table:
| Timestamp | How satisfied were you with the cleanliness of your room? | How satisfied were you with the comfort of your bed? | How satisfied were you with the level of noise in your room? | How satisfied were you with the quality of the food at the hotel restaurant? |
| 10-13-2023 17:47:33 | Extremely Dissatisfied | Extremely Satisfied | Dissatisfied | Extremely Satisfied |
| 10-13-2023 17:47:33 | Satisfied | Neutral | Extremely Satisfied | Neutral |
| 10-13-2023 17:47:33 | Dissatisfied | Extremely Satisfied | Neutral | Neutral |
| 10-13-2023 17:47:33 | Extremely Satisfied | Extremely Satisfied | Extremely Satisfied | Extremely Dissatisfied |
| 10-13-2023 17:47:33 | Neutral | Extremely Dissatisfied | Neutral | Neutral |
| 10-13-2023 17:47:33 | Extremely Satisfied | Extremely Satisfied | Satisfied | Extremely Satisfied |
| 10-13-2023 17:47:33 | Extremely Satisfied | Satisfied | Satisfied | Satisfied |
| 10-13-2023 17:47:33 | Satisfied | Satisfied | Neutral | Satisfied |
| 10-13-2023 17:47:33 | Satisfied | Satisfied | Satisfied | Satisfied |
| 10-13-2023 17:47:33 | Neutral | Neutral | Extremely Satisfied | Dissatisfied |
| 10-13-2023 17:47:33 | Satisfied | Extremely Satisfied | Extremely Satisfied | Extremely Satisfied |
| 10-13-2023 17:47:34 | Satisfied | Satisfied | Satisfied | Extremely Satisfied |
| 10-13-2023 17:47:35 | Satisfied | Satisfied | Satisfied | Extremely Satisfied |
| 10-13-2023 17:47:36 | Extremely Satisfied | Satisfied | Neutral | Dissatisfied |
| 10-13-2023 17:47:37 | Satisfied | Extremely Satisfied | Extremely Dissatisfied | Extremely Satisfied |
| 10-13-2023 17:47:38 | Neutral | Satisfied | Satisfied | Satisfied |
| 10-13-2023 17:47:39 | Satisfied | Extremely Satisfied | Satisfied | Extremely Satisfied |
| 10-13-2023 17:47:40 | Extremely Satisfied | Satisfied | Extremely Satisfied | Satisfied |
| 10-13-2023 17:47:41 | Satisfied | Satisfied | Neutral | Satisfied |
| 10-13-2023 17:47:42 | Satisfied | Dissatisfied | Dissatisfied | Neutral |


Below are several advantages of utilizing anonymous surveys:
Anonymous surveys encourage participants to provide candid feedback without the fear of repercussions.
Participants may be more willing to take part in surveys when their responses are anonymous, leading to higher response rates and a more representative sample.
Anonymity helps reduce response bias by minimizing social desirability bias, where participants may alter their responses to conform to societal norms or expectations.
Respondents’ personal information remains confidential in anonymous surveys, promoting a sense of privacy and potentially increasing their willingness to share sensitive information.
In organizational settings, anonymous surveys can foster a culture of open communication and trust, leading to increased employee engagement and satisfaction.
While anonymous surveys can be valuable in eliciting honest and candid responses, they also come with certain challenges. It’s essential to be aware of these potential issues when designing and interpreting the results of anonymous surveys:
Some individuals may use the anonymity provided by surveys to express harmful or inappropriate opinions. This can create challenges in managing and interpreting responses, especially when dealing with sensitive topics.
Ensuring the security and integrity of the survey data is crucial. Anonymous surveys may be vulnerable to fraudulent responses, such as multiple submissions from the same individual or automated bots.
Researchers must consider the ethical implications of collecting anonymous data, especially when dealing with sensitive topics. Balancing the need for confidentiality with the responsibility to ensure participant well-being is essential.
Yes! Google Forms has settings that remove any email or name requirements from surveys. To make a Google survey anonymous, click the “Settings” tab and then expand the “Responses” section.
There are a few settings you want to ensure are off. The first is the “Collect email addresses” option. This needs to be off. You also want to turn off “Limit 1 response” because this requires an email address from participants.
If these two options are off, your Google Forms surveys will be anonymous for participants.
Sending a Google survey anonymously is a little trickier. There isn’t an option for this. Instead, you will have to email it or share a direct link from an unknown source. This may hurt your response rates, as people won’t be keen to reply to a survey from a stranger.
Maintaining anonymity in the Digital Age is a top concern. We always hear about data leaks spilling people’s personal information into the dark web.
Google Forms anonymous surveys provide you with the valuable audience feedback you need. On the other side, survey participants don’t have to risk their personal information.
You save significant time and other resources when you know how to create an anonymous survey in Google Forms.
The results you receive will produce influential customer insights. You can use this intel to improve key strategies, products, experiences, etc.
For instance, your Google Forms anonymous survey may reveal people are overwhelmingly unhappy with customer service. This gives you actionable intelligence on what needs fixing to improve your business.
Exporting the data to Google Sheets or Excel is crucial to making the most of your survey results. This will give you the best chance of discovering the actionable insights you’re after.
Using Excel or Google Sheets also makes visualizing your Google Forms anonymous survey results possible. Charts produce the most accessible actionable insights.
One minute of viewing a Likert Scale Chart can tell you what hours of numerical analysis would reveal.
Don’t waste time making surveys without Google Forms or analyzing your results without ChartExpo. Thanks to these tools, you can reach incredible audience insight with little effort or cost!
How much did you enjoy this article?


Google Forms to Google Sheets keeps your data organized and current with every submission. Learn the steps, methods, and tips now!

Product survey questions reveal what customers truly think. Learn how to ask the right ones and act on the survey results. Read on!

Learn how the 5-Point Performance Rating Scale improves employee evaluations with clear, consistent, and fair performance reviews across teams.


