Categories
Cancer has been a threat to the human race. However, surgery and chemotherapy are some of the tools used to treat it. But what is the success rate of radiation therapy? Radiation therapy has a 90-95% success rate in stage I, 85-90% success rate in stage II, and a 75-80% success rate in stage III.


In this guide, you’ll discover what radiation therapy is, why people use radiation therapy, types of radiation therapy, how to calculate the success rate of radiation therapy, and how to analyze the success rate for radiation therapy in Power BI.
First…
With radiation therapy, carefully targeted and regulated doses of electromagnetic waves (or high-energy radiation) are used to kill cancer cells.
Radiation causes cancer cells to die immediately after treatment. However, there are cases where the cancer cells become incapacitated due to radiation-induced damage to the cancer cell’s DNA and chromosomes.
Radiation therapy also helps in reducing the size of some tumors. It damages normal cells in the treated areas, but these cells can be repaired from this radiation exposure.
Here are the major reasons why people use radiation therapy.
The general approach to calculating the success rate of radiation therapy includes:
You need to figure out what makes a successful outcome for a specific type of cancer that’s being treated. That could be complete tumor regression, symptom control, or long-term remission.
Figure out measurable outcomes like:
These are data relating to the patient demographics, treatment specifics, cancer characteristics, and follow-up outcomes.
You have to account for factors influencing outcomes like patient age, treatment adherence, cancer stage, and overall health.
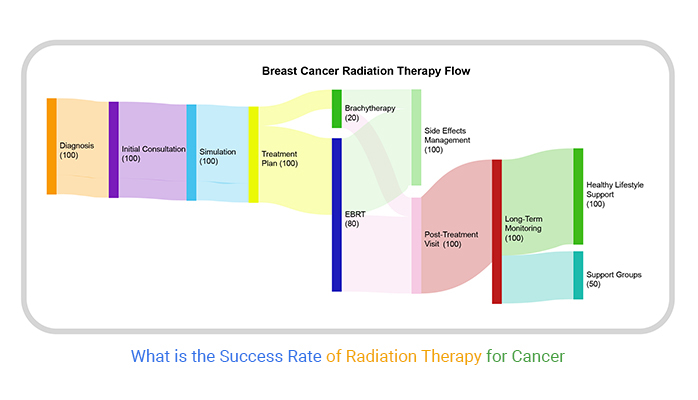
Showcase the success rates with appropriate context and discuss limitations like biases in data collection or follow-up duration, using a Sankey diagram maker to visualize the data flows clearly.
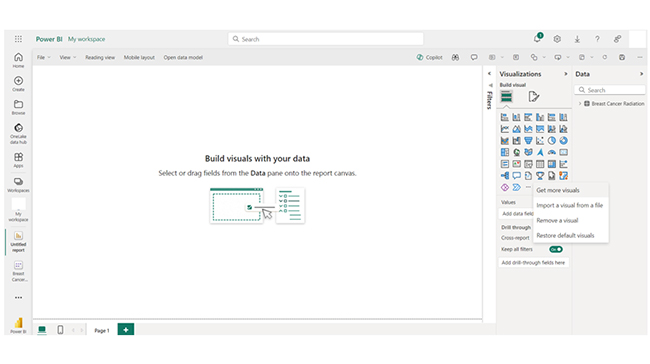
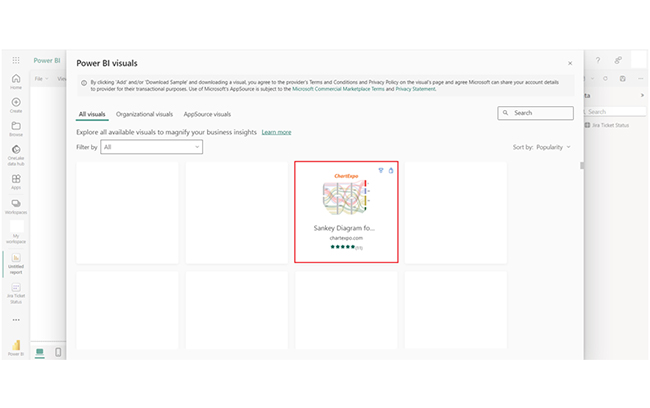
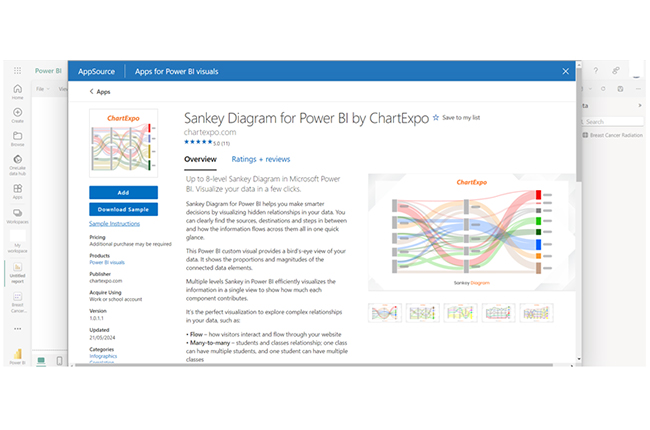
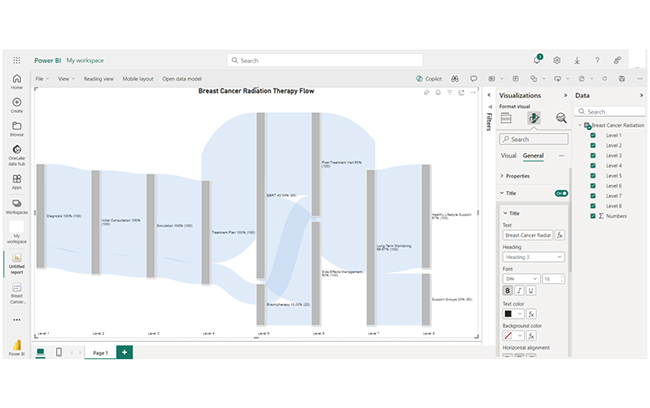
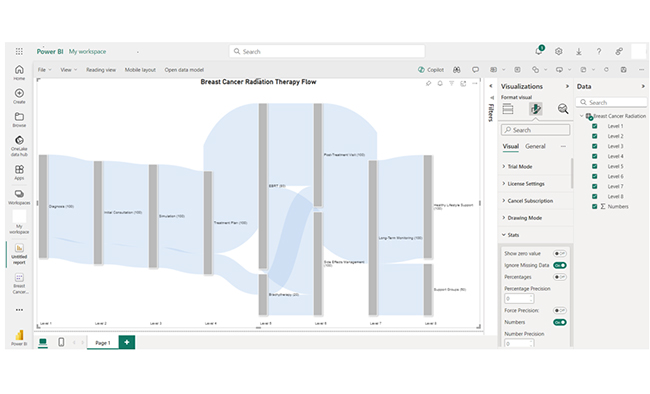
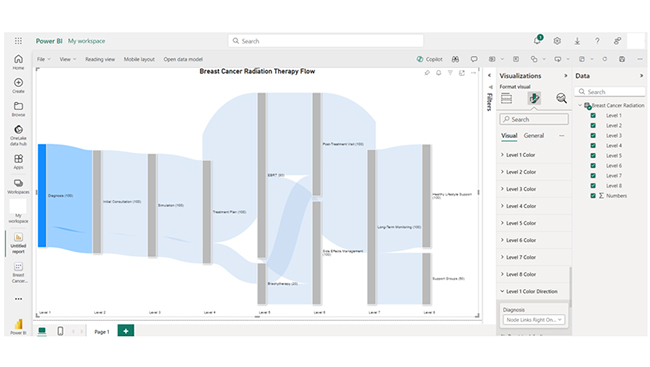
You can use the Sankey plot in Power BI to analyze the success rate of radiation therapy by visualizing patient outcomes and treatment flow.
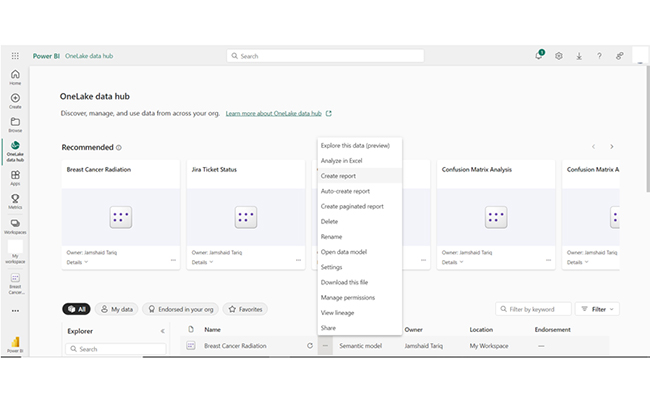
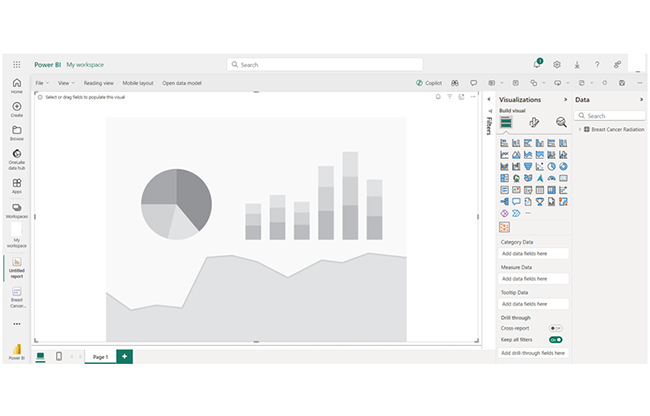
Stage 1: Logging in to Power BI


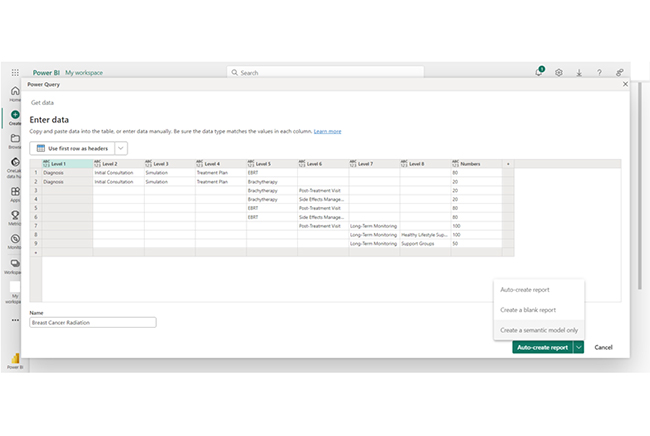
| Level 1 | Level 2 | Level 3 | Level 4 | Level 5 | Level 6 | Level 7 | Level 8 | Numbers |
| Diagnosis | Initial Consultation | Simulation | Treatment Plan | EBRT | 80 | |||
| Diagnosis | Initial Consultation | Simulation | Treatment Plan | Brachytherapy | 20 | |||
| Brachytherapy | Post-Treatment Visit | 20 | ||||||
| Brachytherapy | Side Effects Management | 20 | ||||||
| EBRT | Post-Treatment Visit | 80 | ||||||
| EBRT | Side Effects Management | 80 | ||||||
| Post-Treatment Visit | Long-Term Monitoring | 100 | ||||||
| Long-Term Monitoring | Healthy Lifestyle Support | 100 |
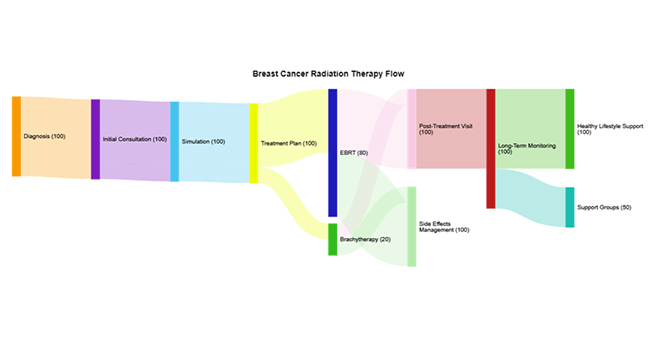
Insights:
The data shows the patient’s treatment pathways. 80% of patients undergo External Beam Radiation Therapy (EBRT), while 20% opt for Brachytherapy. Both involve post-treatment visits and side effects management. Healthy lifestyle support and long-term monitoring are also past of the patient’s post-treatment.
Explore the critical insights behind the success rate of radiation therapy with this engaging tutorial. Using data-driven charts and graphs, you can visualize treatment effectiveness, patient outcomes, and progress over time. Whether you’re comparing success rates across different cancer types, evaluating advancements in technology, or tracking recovery statistics, these visual tools offer a clear and impactful way to present complex data. By mastering the use of charts to analyze radiation therapy outcomes, you can uncover patterns, enhance decision-making, and communicate findings with clarity. Empower your research or clinical practice with visuals that tell a compelling story of success and innovation in radiation therapy.
The number of radiation treatments is determined by factors like cancer type, stage, treatment goals, location, and individual patient factors like overall patient health and tolerance to radiation.
Statistics of radiation therapy include success rates like survival rates and local control. And that varies with cancer type, stage, and treatment approach. This will, in turn, impact the treatment’s effectiveness and outcomes.
Also known as a treatment plan, a radiation treatment chart outlines the dosage, schedule, and target areas of radiation therapy sessions based on individualized patient needs and treatment goals.
Radiation therapy is a technique where high-energy radiation is used in treating cancer. That’s accomplished by damaging the DNA in cancer cells. It’s used for curing, controlling, and palliating cancer.
The common types of radiation therapy are External Beam Radiation Therapy (EBRT), and brachytherapy. The cancer success rate varies, and it’s dependent on the cancer stage and type.
People use radiation therapy for a plethora of reasons including targeting metastases. With radiation therapy, you can treat cancer that has spread to other parts of the body. And that helps in controlling disease progression and providing relief from symptoms. Radiation therapy is also a non-surgical option for patients who are eligible for surgery due to their health conditions, preferences, and age.
Analyzing data that comes with radiation therapy involves the use of tools like the ChartExpo. The tool helps in showcasing patient treatment pathways, including post-treatment visits and side effects management.
How much did you enjoy this article?


Discover diverse and high-quality Power BI report examples for inspiration and insights. Elevate your reporting with strategic visualization techniques.

A Customer Relationship Management Dashboard centralizes data, tracks key metrics, and drives smarter business decisions. Discover now!

Explore Healthcare Dashboard Examples and learn how to turn complex healthcare data into clear, actionable insights for better decision-making.


