• Home
  • Tools dropdown img
    • Spreadsheet Charts

      • ChartExpo for Google Sheets
      • ChartExpo for Microsoft Excel
    • Power BI Charts

      • Power BI Custom Visuals by ChartExpo
    • Word Cloud

  • Charts dropdown img
    • Chart Category

      • Bar Charts
      • Circle Graphs
      • Column Charts
      • Combo Charts
      • Comparison Charts
      • Line Graphs
      • PPC Charts
      • Sentiment Analysis Charts
      • Survey Charts
    • Chart Type

      • Box and Whisker Plot
      • Clustered Bar Chart
      • Clustered Column Chart
      • Comparison Bar Chart
      • Control Chart
      • CSAT Survey Bar Chart
      • CSAT Survey Chart
      • Dot Plot Chart
      • Double Bar Graph
      • Funnel Chart
      • Gauge Chart
      • Likert Scale Chart
      • Matrix Chart
      • Multi Axis Line Chart
      • Overlapping Bar Chart
      • Pareto Chart
      • Radar Chart
      • Radial Bar Chart
      • Sankey Diagram
      • Scatter Plot Chart
      • Slope Chart
      • Sunburst Chart
      • Tornado Chart
      • Waterfall Chart
      • Word Cloud
    • Google Sheets
      Microsoft Excel
  • Services
  • Pricing
  • Contact us
  • Blog
  • Support dropdown img
      • Gallery
      • Videos
      • Contact us
      • FAQs
      • Resources
    • Please feel free to contact us

      atsupport@chartexpo.com

Categories
All Data Visualizations Data Analytics Surveys
Add-ons/
  • Google Sheets
  • Microsoft Excel
  • Power BI
All Data Visualizations Data Analytics Surveys
Add-ons
  • Google Sheets
  • Microsoft Excel
  • Power BI

We use cookies

This website uses cookies to provide better user experience and user's session management.
By continuing visiting this website you consent the use of these cookies.

Ok

ChartExpo Survey


Home > Blog > Microsoft Excel

What is Net Working Capital: A Visual Guide

So, what is a net working capital? Is it just a fancy financial term? No – it’s the heartbeat of a company’s short-term financial health. Think of it as the financial acrobat that balances a company’s short-term assets and liabilities on a tightrope.

What is a Net Working Capital

Understanding net working capital is like discovering the secret sauce of a successful business recipe. A positive net working capital indicates that a company has enough short-term assets to cover short-term debt obligations. On the other hand, a negative net working capital can signal potential financial trouble.

Why does net working capital matter? It measures a company’s operational efficiency and short-term financial health. A healthy net working capital ensures a company can meet its short-term liabilities and fund its operations.

According to the U.S. Small Business Administration, poor net working capital management is a major reason for small business failure. A well-managed net working capital can enhance a company’s ability to seize growth opportunities and navigate economic downturns. This underscores the significance of understanding and effectively managing net working capital.

So, join us, let’s decode the essence of net working capital and unveil its implications.

Table of Content:

  1. What is a Net Working Capital?
  2. What is Net Working Capital Meaning?
  3. Why is Net Working Capital Important?
  4. Working Capital vs Net Working Capital
  5. Net Working Capital Formula
  6. How to Calculate Net Working Capital?
  7. Calculation Examples of Net Working Capital
  8. How to Calculate Change in Net Working Capital?
  9. How to Create a Working Capital Chart?
  10. Net Working Capital Example
  11. Benefits of Net Working Capital
  12. Ways To Improve Working Capital
  13. FAQs About Net Working Capital
  14. Wrap Up

First…

What is a Net Working Capital?

Definition: Net working capital (NWC) is a financial metric assessing a company’s short-term financial health and operational liquidity. It is calculated by deducting current liabilities from current assets. Current assets include cash, accounts receivable, and inventory, while current liabilities encompass short-term debts and obligations. NWC provides insight into a company’s aptitude to fulfill short-term commitments using its existing assets.

NWC reflects a company’s ability to cover its short-term obligations with its current assets.

A positive NWC indicates the company has enough assets to cover its short-term liabilities, suggesting financial stability. Conversely, a negative NWC may signal potential liquidity issues.

Monitoring NWC helps assess a company’s ability to handle day-to-day expenses and capitalize on strategic initiatives. Efficient management is crucial for maintaining smooth business operations and meeting financial obligations.

What is Net Working Capital Meaning?

Net Working Capital (NWC) is the difference between a company’s current assets and current liabilities, representing its short-term liquidity. A positive NWC indicates good financial health, while a negative NWC may signal liquidity issues.

Why is Net Working Capital Important?

Picture it as the financial heartbeat pulsating through the veins of an organization, influencing its vitality and resilience. Let’s delve into the significance of this financial maestro in sustaining a thriving enterprise.

  1. Liquidity management: At its core, net working capital is the guardian of liquidity. It ensures a company has ample resources to meet short-term obligations, maintaining a delicate balance between assets and liabilities. It shields businesses from unexpected cash flow hurdles like a financial safety net.
  2. Operational efficiency: Net working capital reflects a company’s operational efficiency. A positive working capital indicates that a business can easily cover its short-term obligations. This efficiency is vital for day-to-day operations, fostering a smooth and resilient workflow.
  3. Strategic decision-making: Understanding net working capital resembles holding a compass in the corporate wilderness. It guides data-driven decision-making by revealing how well a company can seize opportunities or weather economic downturns. Businesses armed with this insight make informed choices, steering towards sustainable growth.
  4. Investor confidence: Investors scrutinize a company’s net working capital as a barometer of its financial health. A robust working capital position instills confidence, signaling that the business can navigate challenges and capitalize on opportunities. It becomes a persuasive factor for attracting potential investors and partners.
  5. Risk mitigation: Net working capital is a buffer against financial risks. A well-managed working capital ensures the company can absorb unexpected shocks, whether from market fluctuations or unforeseen expenses. It acts as a financial cushion, fortifying the organization against potential downturns.

Working Capital vs Net Working Capital: Key Differences

Aspect Working Capital Net Working Capital (NWC)
Definition Total capital available for daily operations Difference between current assets and current liabilities
Formula Current Assets – Current Liabilities + Long-term Assets Current Assets – Current Liabilities
Scope Includes both short-term and long-term capital Focuses only on short-term financial health
Purpose Measures overall operational efficiency Assesses short-term liquidity position
Indicator Broad financial health metric Shows ability to cover short-term obligations

Net Working Capital Formula

The Net Working Capital formula is:

                                   Net Working Capital=Current Assets – Current Liabilities

This calculation represents the difference between a company’s short-term assets and liabilities, indicating its liquidity and ability to cover short-term obligations.

How to Calculate Net Working Capital?

  1. Identify Current Assets: Add up all short-term assets such as cash, accounts receivable, and inventory.
  2. Identify Current Liabilities: Add up all short-term liabilities like accounts payable, short-term debt, and accrued expenses.
  3. Apply the Formula: Subtract current liabilities from current assets using the formula:

Here is the Net Working Capital formula:

  • NWC=Current Assets – Current Liabilities

Calculation Examples of Net Working Capital

Example 1:

Company ABC has the following financials:

  • Current Assets: $500,000
  • Current Liabilities: $300,000

NWC=500,000 – 300,000=200,000

In this example, Company ABC’s Net Working Capital is $200,000.

Example 2:

Let’s consider Company XYZ with the following financials:

  • Current Assets: $750,000
  • Current Liabilities: $800,000

NWC=750,000 – 800,000=-50,000

In this case, Company XYZ’s Net Working Capital is -$50,000, indicating that its current liabilities exceed its current assets. A negative NWC might suggest potential liquidity challenges.

How to Calculate Change in Net Working Capital?

To calculate the Change in Net Working Capital (NWC), use the following formula:

Change in NWC=NWC (Current Period)−NWC (Previous Period)

Change in Net Working Capital Formula

Find Net Working Capital for Both Periods:

  • NWC=Current Assets−Current Liabilities

Subtract Previous Period NWC from Current Period NWC:

  • If positive → Increase in NWC (more liquidity).
  • If negative → Decrease in NWC (less liquidity).

Example:

  • Previous NWC: $50,000
  • Current NWC: $60,000
  • Change in NWC: $60,000 – $50,000 = $10,000 (Increase)

How to Create a Working Capital Chart?

Data analysis can feel like navigating a maze in the dark, frustrating and full of dead ends. But don’t worry; data visualization is your beacon of hope when deciphering the complexities of Net Working Capital.

Yet, let’s admit it: Excel’s charting features can be as disappointing as a deflated balloon.

But fear not! ChartExpo strides in to rescue your NWC analysis from Excel’s limitations and illuminate your path to clarity.

Let’s learn how to install ChartExpo in Excel.

  1. Open your Excel application.
  2. Open the worksheet and click the “Insert” menu.
  3. You’ll see the “My Apps” option.
  4. In the Office Add-ins window, click “Store” and search for ChartExpo on the Apps Store.
  5. Click the “Add” button to install ChartExpo in Excel.

ChartExpo charts are available both in Google Sheets and Microsoft Excel. Please use the following CTAs to install the tool of your choice and create beautiful visualizations with a few clicks in your favorite tool.

Net Working Capital Example

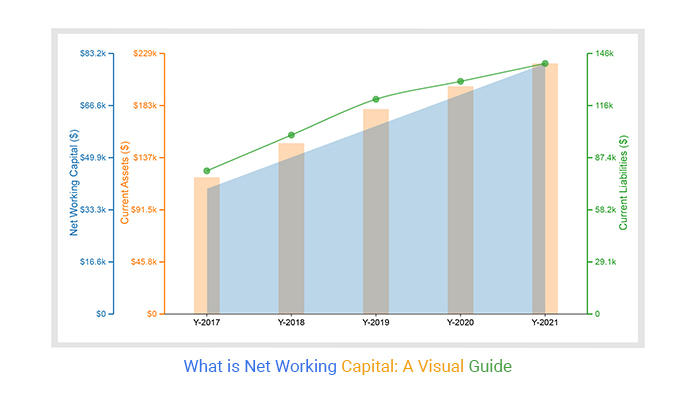
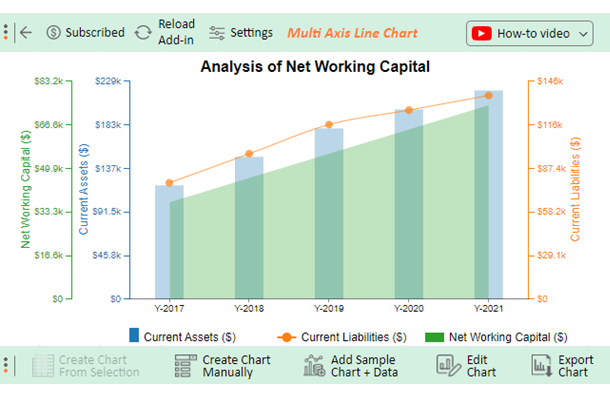
Let’s say you want to analyze the NWC data below.

Year Current Assets ($) Current Liabilities ($) Net Working Capital ($)
Y-2017 120,000 80,000 40,000
Y-2018 150,000 100,000 50,000
Y-2019 180,000 120,000 60,000
Y-2020 200,000 130,000 70,000
Y-2021 220,000 140,000 80,000

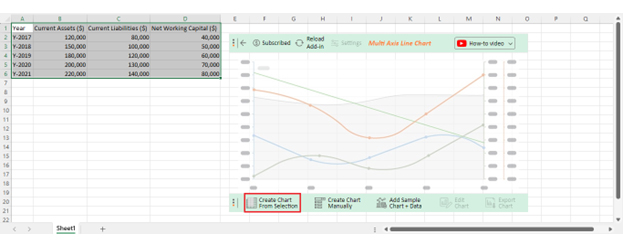
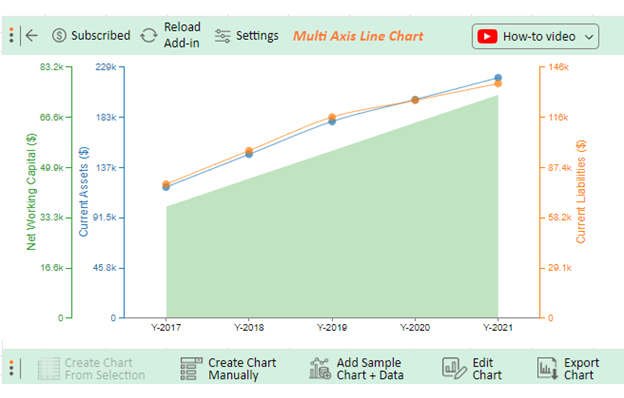
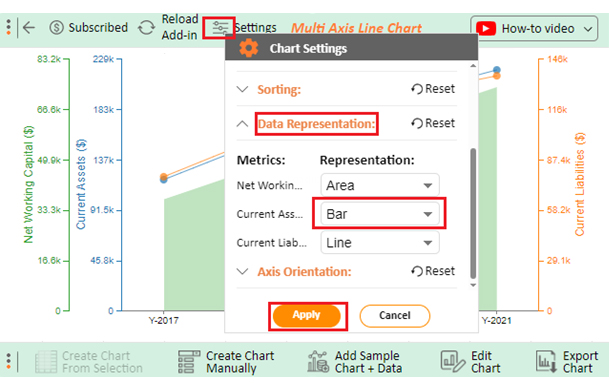
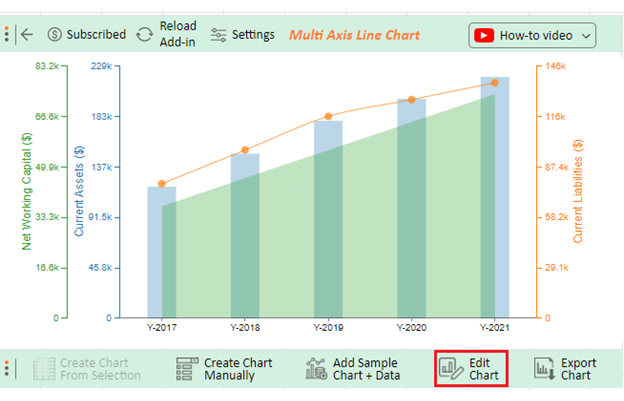
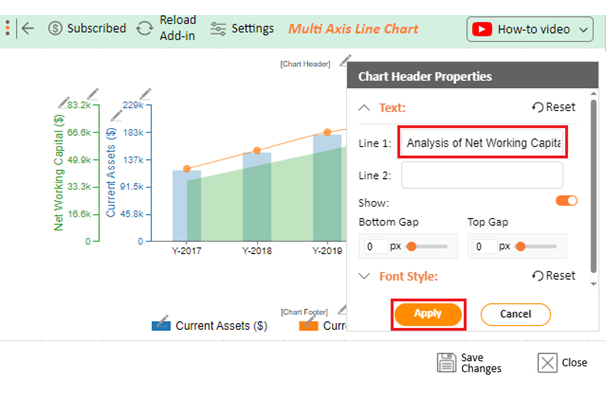
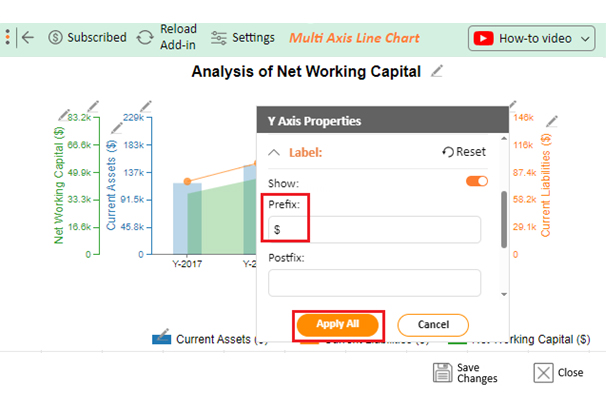
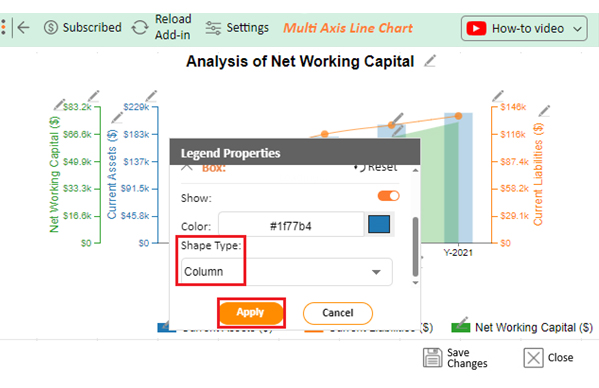
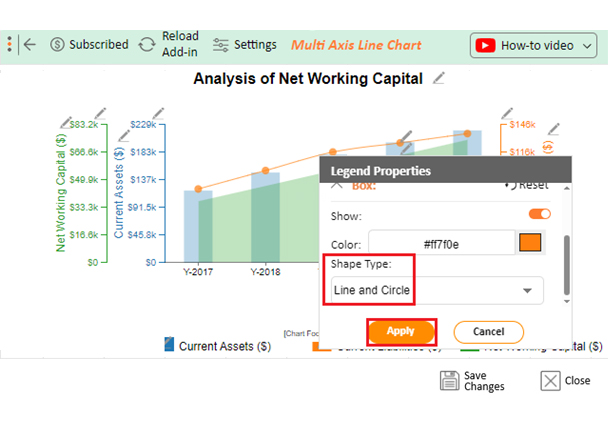
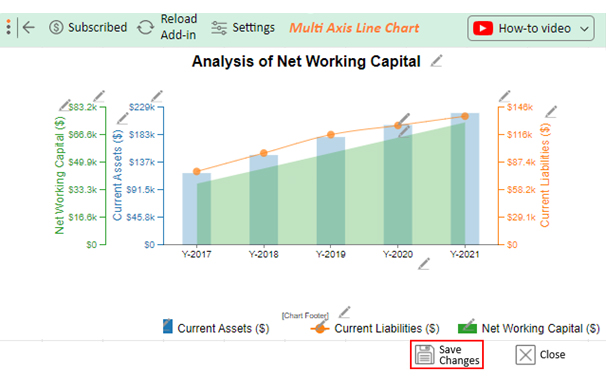
Follow these steps to create a visualization in Excel using CharExpo and glean valuable insights.

  • To get started with ChartExpo, install ChartExpo in Excel.
  • Now Click on My Apps from the INSERT menu.
insert chartexpo in excel
  • Choose ChartExpo from My Apps, then click Insert.
open chartexpo in excel
  • Once it loads, scroll through the charts list to locate and choose the “Multi-Axis Line Chart”.
search multi axis line chart in excel
  • Click the “Create Chart From Selection” button after selecting the data from the sheet, as shown.
Create Chart From Selection After Learning What is a Net Working Capital
  • ChartExpo will generate the visualization below for you.
Initial Visual After Learning What is a Net Working Capital
  • Click on Settings and change the “Data Representation” as follows.
Change Data Representation After Learning What is a Net Working Capital
  • If you want to add anything to the chart, click the Edit Chart button:
Edit Chart After Learning What is a Net Working Capital
  • Click the pencil icon next to the Chart Header to change the title.
  • It will open the properties dialog. Under the Text section, you can add a heading in Line 1 and enable Show.
  • Give the appropriate title of your chart and click the Apply button.
Add Title After Learning What is a Net Working Capital
  • You can add a dollar sign with all values as Current Liabilities shown below:
Add Prefix Current Liabilities After Learning What is a Net Working Capital
  • Change the Legend shape of Current Assets to Column and click the Apply button.
Change Shape of Legend After Learning What is a Net Working Capital
  • Change the Legend shape of Current Liabilities into a Line and Circle and click the Apply button.
Save Legends Changes After Learning What is a Net Working Capital
  • Click the Save Changes button to persist the changes made to the chart.
Save Chart Changes After Learning What is a Net Working Capital
  • Your final Multi Axis Line Chart will look like the one below.
Final What is a Net Working Capital

Insights

  • Over the past five years, there has been a steady increase in net working capital, signaling enhanced liquidity and improved financial well-being.
  • Current assets consistently surpass current liabilities yearly, showcasing the company’s capacity to meet its short-term obligations.
  • The company’s liquidity stance has progressively fortified, with an average annual increment of $10,000 in net working capital.
  • The positive trends observed strongly indicate adept working capital management practices.

Benefits of Net Working Capital

Maintaining a healthy Net Working Capital (NWC) is essential for a company’s financial stability and operational efficiency. Here are the key benefits:

  • Ensures Liquidity

A positive NWC ensures that a business has enough short-term assets to cover liabilities like payroll, rent, and supplier payments. This prevents cash flow shortages.

  • Improves Financial Stability

A strong NWC indicates a well-managed financial structure, reducing the risk of insolvency and improving the company’s ability to handle unexpected expenses.

  • Supports Business Growth

Companies with a positive NWC can invest in growth initiatives, such as expanding operations, purchasing inventory, or launching new products.

  • Enhances Creditworthiness

Lenders and investors assess NWC to determine a company’s financial health. A good NWC increases the likelihood of securing loans and favorable credit terms.

  • Prevents Cash Flow Issues

Properly managing NWC helps businesses maintain smooth operations by ensuring they have enough cash to meet obligations without relying on external funding.

  • Increases Operational Efficiency

Effective NWC management allows businesses to optimize their receivables and payables, improving overall cash management and profitability.

Ways To Improve Working Capital

  1. Reduce Accounts Receivable: Implement stricter payment terms or offer incentives for early payments to improve cash flow.
  2. Manage Inventory Efficiently: Avoid overstocking by optimizing inventory levels to reduce holding costs.
  3. Negotiate Better Payment Terms: Extend accounts payable terms with suppliers to keep cash on hand longer.
  4. Increase Sales and Revenue: Boosting sales can increase cash inflows, improving NWC.
  5. Control Operating Expenses: Streamline operations and reduce unnecessary expenses to improve cash reserves and NWC.

FAQs About Net Working Capital

What is the difference between total and net working capital?

Total working capital is the sum of a company’s current assets and liabilities, representing its short-term financial position. Net working capital, on the other hand, is the difference between current assets and liabilities. It indicates the company’s liquidity and ability to cover short-term obligations.

What are the 4 main components of working capital?

The four main components of working capital are:

  • Cash and Cash Equivalents
  • Accounts Receivable
  • Inventory
  • Accounts Payable

These elements reflect a company’s ability to manage short-term financial obligations and operational efficiency.

Is net working capital the same as profit?

No, net working capital and profit are distinct. Net working capital measures short-term liquidity by subtracting current liabilities from current assets. Profit is the surplus after deducting all expenses from revenue, reflecting overall financial performance.

Wrap Up

Closing thoughts on “What is a net working capital?”: Net working capital is a money manager for businesses. It ensures a business has enough cash for short-term needs.

Think of it as a financial superhero.

We delved into NWC’s key roles, discovering that it’s not just a number on a balance sheet. It’s a versatile tool. It predicts future cash flow, unveils the true value of a company, and acts as a financial compass. Consequently, it helps keep the ship sailing smoothly in the unpredictable sea of business.

The examples provided a hands-on guide to calculating net working capital, offering a peek into a company’s financial health. Whether the number is positive or negative, it speaks volumes about how well a company handles its money matters. Lenders, in particular, pay attention to this metric when businesses seek additional funds.

We’ve also distinguished net working capital from total working capital. We’ve realized that while total gives us the big picture, net working capital zooms in on what truly matters for short-term success. It’s the meticulous financial manager, who ensures businesses stay on the right track.

So, in conclusion, net working capital isn’t just a term; it’s a reliable companion for businesses. It helps companies track their cash flow, making the financial journey more predictable and prosperous.

How much did you enjoy this article?

ExcelAd1
Start Free Trial!
134624

Related articles

next previous
Microsoft Excel12 min read

Artificial Intelligence in Excel for Clear Insights

Discover how AI elevates Excel, from automation to advanced data analysis. This blog covers benefits, limitations, and examples to enhance your productivity.

Microsoft Excel8 min read

Excel Task Tracker Template for Smarter Task Insights

Task tracker template in Excel organizes tasks, tracks deadlines, and boosts efficiency. Learn its benefits, and explore expert tips to simplify task management.

Microsoft Excel10 min read

Invoice Tracker Template in Excel for Better Insights

An invoice tracker Excel template helps track invoices, due dates, and payments. Learn how to use this template for better financial management.

Microsoft Excel12 min read

Key Performance Indicators in Healthcare for Better Insights

Key Performance Indicators in healthcare track patient care and efficiency. Learn about these KPIs, top examples, and how to use them to improve outcomes.

Microsoft Excel10 min read

BMI Calculation Formula in Excel for Better Fitness Insights

The BMI calculation formula in Excel helps track and analyze body mass index. Explore step-by-step instructions and tips to simplify BMI tracking in Excel.

ChartExpo logo

Turn Data into Visual
Stories

CHARTEXPO

  • Home
  • Gallery
  • Videos
  • Services
  • Pricing
  • Contact us
  • FAQs
  • Privacy policy
  • Terms of Service
  • Sitemap

TOOLS

  • ChartExpo for Google Sheets
  • ChartExpo for Microsoft Excel
  • Power BI Custom Visuals by ChartExpo
  • Word Cloud

CATEGORIES

  • Bar Charts
  • Circle Graphs
  • Column Charts
  • Combo Charts
  • Comparison Charts
  • Line Graphs
  • PPC Charts
  • Sentiment Analysis Charts
  • Survey Charts

TOP CHARTS

  • Sankey Diagram
  • Likert Scale Chart
  • Comparison Bar Chart
  • Pareto Chart
  • Funnel Chart
  • Gauge Chart
  • Radar Chart
  • Radial Bar Chart
  • Sunburst Chart
  • see more
  • Scatter Plot Chart
  • CSAT Survey Bar Chart
  • CSAT Survey Chart
  • Dot Plot Chart
  • Double Bar Graph
  • Matrix Chart
  • Multi Axis Line Chart
  • Overlapping Bar Chart
  • Control Chart
  • Slope Chart
  • Clustered Bar Chart
  • Clustered Column Chart
  • Box and Whisker Plot
  • Tornado Chart
  • Waterfall Chart
  • Word Cloud
  • see less

RESOURCES

  • Blog
  • Resources
  • YouTube
SIGN UP FOR UPDATES

We wouldn't dream of spamming you or selling your info.

© 2025 ChartExpo, all rights reserved.