Categories
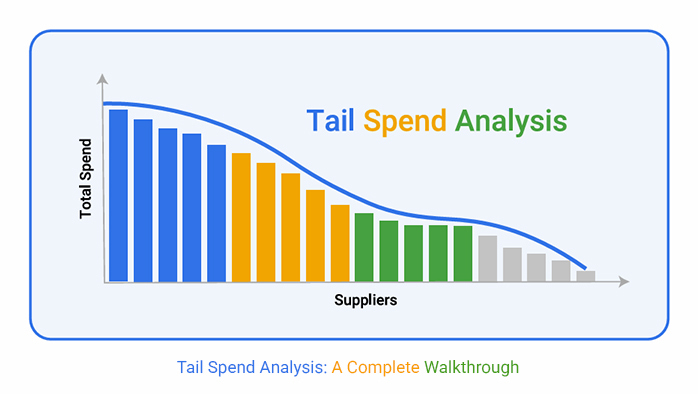
What is tail spend analysis? Companies focus on significant expenses, but small unmanaged purchases can quietly drain profits. Tail spend analysis highlights spending that often goes unnoticed but can dramatically drive up business overhead costs.


With strong procurement spend analysis, businesses capture these hidden costs. They don’t leave money on the table. Instead, they use tail spend analysis to consolidate suppliers and renegotiate smarter contracts.
Tracking the impact of small purchases is essential for accurate spending reporting. Business overhead costs swell when minor expenses are not reported correctly, creating major budget issues later. Companies that embrace better data practices see direct improvements in financial transparency.
Analyze where your minor spending leaks occur to make a smart move. Use tail spend analysis to gain control and turn invisible costs into visible savings. Your next monthly finance report could tell a different story — one of sharper control and more substantial margins.
Ready to rethink the spending habits that are holding your business back?
Let’s dig in.
Definition: Tail spend analysis is the process of reviewing low-value, high-frequency purchases. It focuses on the smaller 20% of spend that companies often overlook. Through procurement spend analysis, businesses identify inefficiencies hiding in minor transactions.
Strong spend reporting practices help uncover duplicate suppliers and unnecessary expenses. Tail spend analysis improves cost control and boosts procurement strategies. It ensures more innovative budgeting and better vendor management. Companies use it to improve their cost-benefit analysis, lower hidden costs, and prepare better monthly finance reports.
Where does your profit leak without warning? It often hides in the tiny purchases you don’t track. Reducing tail spend isn’t about pinching pennies but creating decisive financial wins. Here’s how focusing on it makes a real difference:
Do you think tail spend analysis is a straightforward category? Think again. In procurement, unmanaged spending takes many forms. Knowing these types is key to conducting a fundamental cost-benefit analysis.
Let’s break it down:
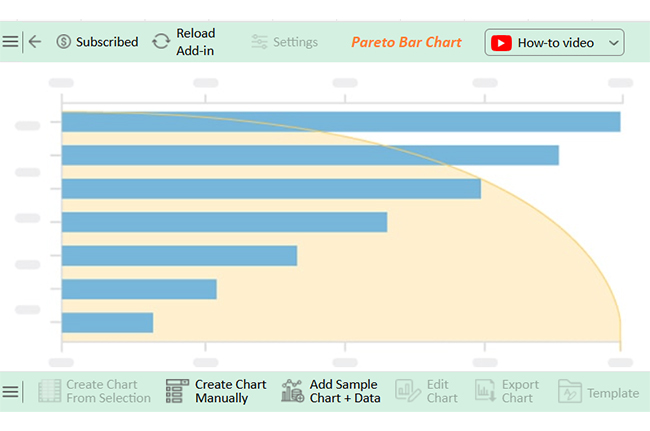
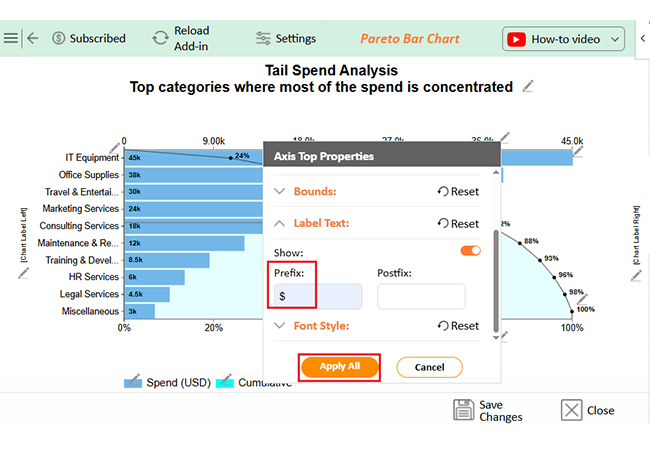
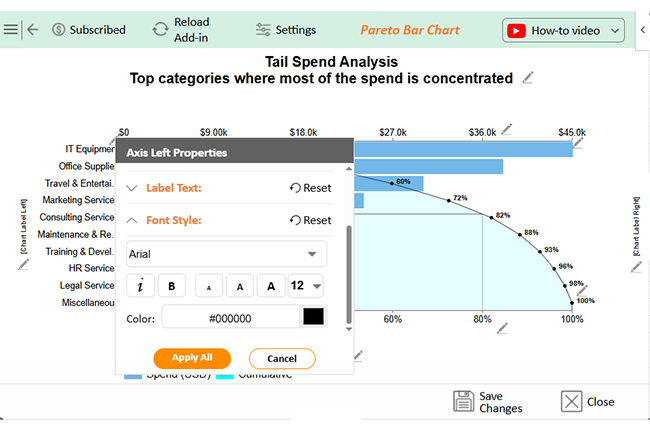
Have you ever tried making sense of piles of data in Excel? It’s like trying to find a needle in a haystack — messy, time-consuming, and frustrating. When it comes to tail spend analysis, clarity is everything. However, Excel, though useful, doesn’t consistently deliver the clear visuals you need to see the bigger picture.
This is where ChartExpo steps in. It turns data into beautiful, easy-to-understand visuals. No more squinting at endless rows of numbers — just sharp, actionable insights.
Ready to ditch the chaos? Let’s explore tail spend analysis and how better tools can make all the difference.
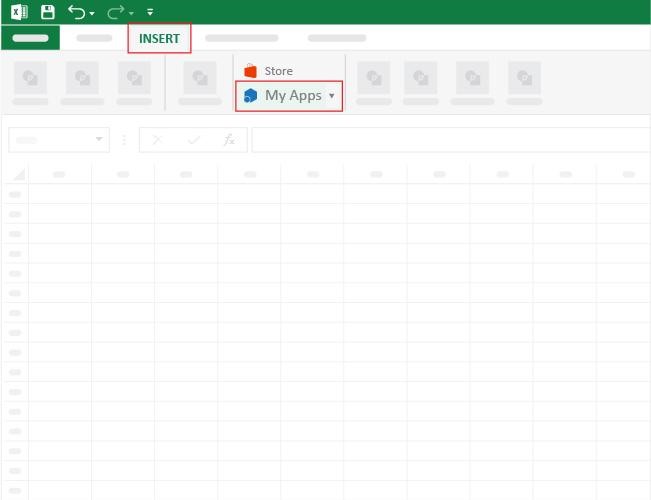
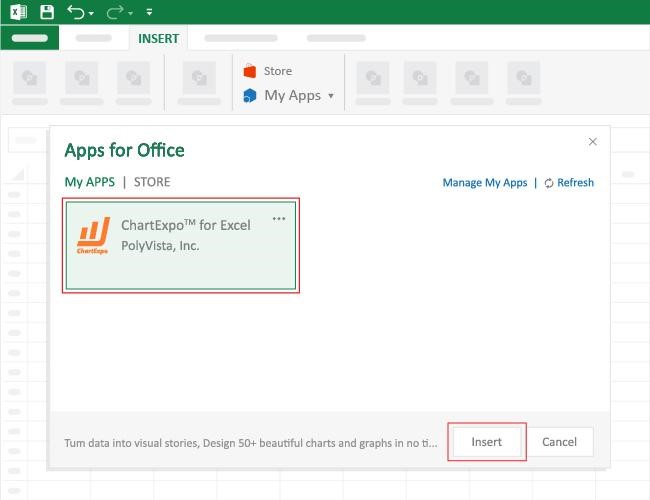
How to Install ChartExpo in Excel?
ChartExpo charts are available both in Google Sheets and Microsoft Excel. Please use the following CTAs to install the tool of your choice and create beautiful visualizations with a few clicks in your favorite tool.
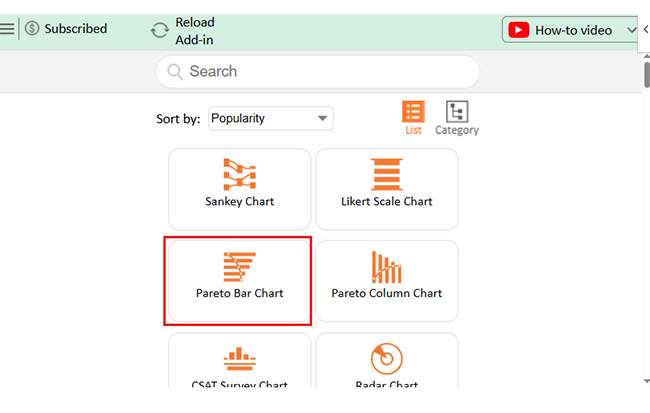
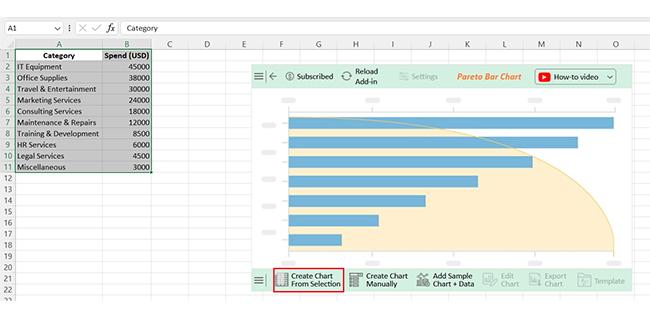
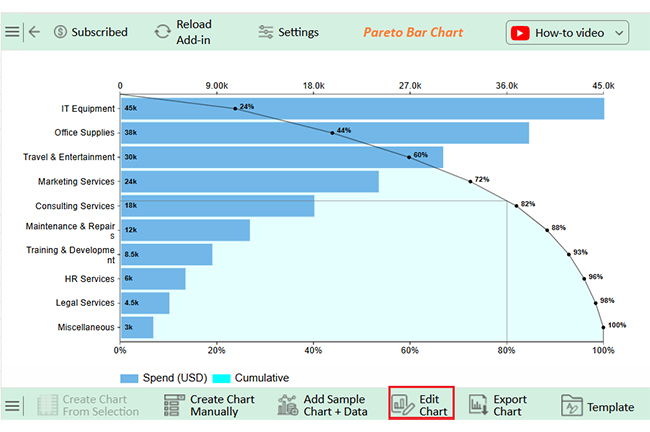
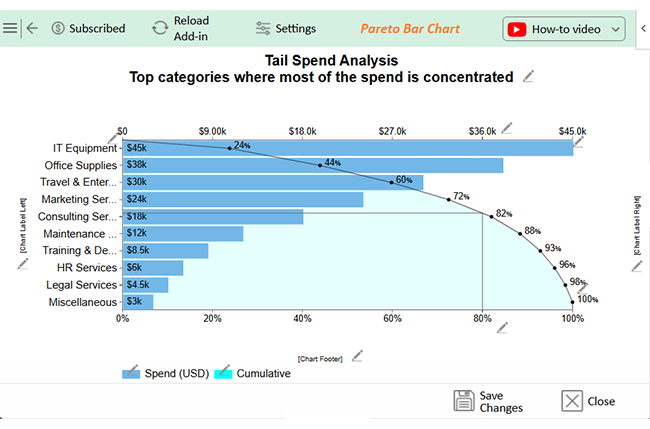
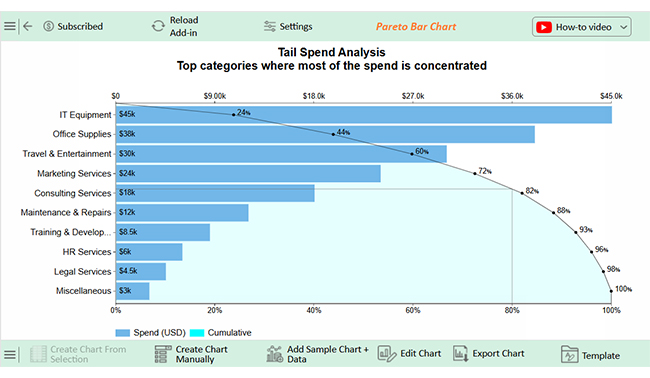
Let’s do a tail-end spend analysis of the sample data below in Excel using ChartExpo.
| Category | Spend (USD) |
| IT Equipment | 45000 |
| Office Supplies | 38000 |
| Travel & Entertainment | 30000 |
| Marketing Services | 24000 |
| Consulting Services | 18000 |
| Maintenance & Repairs | 12000 |
| Training & Development | 8500 |
| HR Services | 6000 |
| Legal Services | 4500 |
| Miscellaneous | 3000 |


Fixing tail spend doesn’t start with guesswork. It begins with structure. The most innovative companies know that success comes from consistency, not one-time fixes. Here’s how to take control of the chaos and keep it that way:
Managing tail spending sounds straightforward, but it’s full of obstacles. While the opportunities are enormous, the challenges can easily trip you up. Here’s what makes controlling tail spending more challenging than it seems:


Tail-end spending refers to small, unmanaged purchases that often fall outside strategic sourcing. They typically make up 20% of total expenditure, but they involve 80% of suppliers, creating complexity and hidden costs.
It’s a plan to control low-value purchases. It involves tracking, analyzing, and streamlining these expenses. The goal is better visibility and savings. It reduces waste and supplier overload and improves financial accuracy.
Tail spending is often ignored or poorly tracked. This leads to waste and lost savings, increases supplier risk, and increases process inefficiency. The problem grows quietly, hurting budgets and performance.
Tail spend analysis helps businesses control small, frequent purchases. These expenses are easy to ignore but hard to manage. Over time, they create hidden costs and waste.
Large purchases get the most attention. However, reviewing the little things can lead to significant savings. A strong financial performance analysis example often reveals how much tail spending matters.
By studying spending patterns, companies gain clarity. They can separate direct costs from indirect costs and plan budgets more effectively, leading to more intelligent choices and less waste.
Better data means better decisions. Detailed reports on financial analysis help teams act quickly and stay informed. They show where improvements are needed most.
Tail spend management also improves compliance, reduces supplier clutter, and tightens control. Even small changes make a big difference over time.
Tail spend analysis is a smart move, not an extra chore. It supports better planning, fewer surprises, and stronger financial health. Want clearer insights fast? Install ChartExpo to turn your data into decisions.
How much did you enjoy this article?


Calculate accounts receivable turnover ratio to measure credit collection speed, improve cash flow, and strengthen your financial strategy. Read on!

Change Management KPIs are the key to tracking adoption, performance, and ROI during transitions. Find out which metrics matter. Read on!

Data collection methods and techniques determine the quality of every insight you act on. Explore key approaches for gathering reliable data. Read on!


