Categories
Restaurant survey questions can help you gather customer feedback and improve service, menu, and overall experience.


To meet the needs of your customers better, you’ve got to understand their psychology, culinary preferences, and dislikes. The more you understand your customers, the higher the chances of getting the right results.
Carefully crafted restaurant surveys with targeted questions can do wonders, especially in understanding customers. Not all restaurant survey questions can help you get the insights you want. We recommend you use closed-ended questions because they’re quantifiable.
Let’s assume you’ve used restaurant survey questions to gather data.
How do you extract answers from the data?
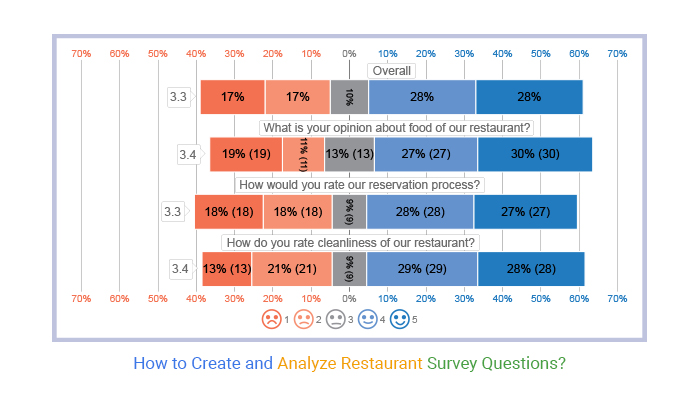
This is where survey-based charts, such as the Likert Scale Chart, come in. A Likert Scale Chart has choices ranging from ‘strongly agree’ to ‘strongly disagree’ to help you get a macro view of people’s opinions. It’s straightforward to read and interpret a Likert Scale Chart, as you will see later.
Definition: The Restaurant survey questions refer to a set of inquiries designed to gather feedback and opinions from customers about their dining experiences at a restaurant.
These questions are typically used by restaurant owners, managers, or market researchers to assess various aspects of the dining establishment, understand customer satisfaction, and identify areas for improvement.
Customer feedback is a guiding light in the food industry. The only way to know what it’s like to dine at your restaurant is to ask your guests directly.
Yes, you read that right.
You can do this by crafting goal-focused restaurant survey questions. You’ll get reliable feedback you can use to optimize your operations for more profits.
You’ll probably get distorted and unreliable insights if you’re not asking the right questions. For instance, including questions that assess the customer effort score can provide valuable insights into how easy or difficult customers find their interactions with your service.
A restaurant survey is a mode of data collection that uses questions to gather responses for analysis. By incorporating metrics like the customer effort score, you can gain a deeper understanding of customer experiences and use these insights to help you make more informed decisions.
In the coming section, we’ll address the following question: why should you use a restaurant survey questionnaire?
Check out the benefits of crafting restaurant survey questions below:
One of the key merits of a survey is that you can use it to question your audience over a protracted time.
The longer you gather data, the more you’ll have for analysis. More data means a higher degree of reliability of the resulting insights.
You can easily adjust your surveys to meet new developments without many challenges.
With other feedback collection methodologies, you’ll probably need to train your staff and re-engineer the process.
This can be time-consuming, expensive, and frustrating.
With a restaurant survey, you only need to change the questions to align with the new conditions.
This will help you free up time for your team to focus mostly on distributing your survey for more data.
Some data collection tools are not designed to be used by everybody.
You probably need staff with in-depth and specialized training to gather data.
This can be frustrating and expensive in the long run. For other members of your team to gather feedback, they’ll have to rely on one person.
Some freemium survey creation tools, such as Google Forms, are straightforward. You don’t need specialized skills to create a survey.
Other data collection tools, such as interviews, are often prone to manipulation and distortion.
For instance, respondents may not want to share their true feelings with a stranger. Besides, social pressure to conform can easily distort the final data.
How?
Experiments have shown that we tend to agree with a more dominant person in a room.
Restaurant surveys can help you overcome this obstacle. Your respondents will fill out the surveys privately, without peer pressure.
The data gathered will be more honest and reliable.
Restaurant survey questions can help you to do more than collect information about past customers.
You can employ surveys in other scopes, such as market research surveys, to uncover a new customer base.
How can you do this?
Well-crafted surveys can help you ask qualifying questions that narrow down an expansive audience to hot leads.
Surveys are significantly cheaper than other data collection methods, such as telephone and mail surveys.
You don’t have to spend money on postage or traveling to areas where your target audience hangs out.
So, how to craft restaurant survey questions?
This is what we’ll address in the coming section. You don’t want to miss this.


A survey’s critical part is creating restaurant survey questions that accurately measure opinions, experiences, etc.
You’re likely to gather distorted and unreliable data if you have a shaky foundation of ambiguous or biased questions.
We recommend you keep many elements in mind when drafting restaurant survey questions.
The first thing you need is to consider the wording of your questions. And this is because it’s closely related to the data you’re collecting.
Crafting survey questions is an art. It calls for elements of psychology and marketing skills.
Gathering accurate responses involves writing good questions and organizing them to form a goal-driven survey.
Creating questions for a restaurant survey is a multistage process that requires attention to multiple details. This process can be complicated because a survey can be applied to multiple areas of your food business.
Different surveys come with varying degrees of detail. More so, questions can be asked in different ways. Also, questions asked earlier in a survey may influence how your audience responds to other questions.
We recommend you conduct pilot tests or focus groups in the early stages of developing questions.
Why?
You’ll comprehend how your target audience perceives or understands your restaurant questionnaire.
Pretesting a survey is critical in optimizing the process to increase participation and completion rates. We’ve put together more tips you can use to create goal-focused restaurant survey questions.
Avoid asking for two things at the same time.
Each question should give room for one answer. Anything more than this can confuse your respondents.
Confusing respondents is unethical and may distort your overall findings.
Why?
Your target audience may choose an answer that doesn’t reflect their true feelings.
Check out an example of a double-barreled question below.
“How would you rate our new menu and home delivery services?
What’s the problem with the question above?
New menu and home delivery are two different aspects of your business. Squeezing two varying themes in the same question can push your audience to either address one or skip the question.
We recommend you break these question types into two for comprehensive and in-depth responses.
For instance:
This approach can help you uncover critical areas weighing your business down.
Your questionnaire should be concise and easy to understand.
In other words, avoid double negatives or ambiguous wording.
For instance, avoid asking:
“Do you agree the new menu is not delicious?”
These question types may mislead your target respondents. Your language should also be appropriate to improve readability.
Craft questions with an average seventh-grade reading level to ensure everyone can understand.
Putting an opinion or something that reflects your sentiments in your restaurant survey questionnaires.
Look at the example below.
“We believe our new menu is remarkable.”
How remarkable do you think our new menu is?
These questions seem to pass an opinion you want your target audience to agree with.
How do you know if respondents feel your new menu is remarkable?
Such questions will distort the resulting insights.
So, create neutral and objective questions.
Ask more closed-ended than open-ended questions.
To gather analyzable data, use closed-ended questions. This is because these questions generate quantitative data you can analyze using charts and graphs.
Besides, the resulting answers are always objective and conclusive.
Also, you can easily visualize responses from closed-ended questions using charts and graphs, such as Likert Scale Charts.
Conversely, open-ended questions generate qualitative responses. This data type is frustrating and requires more effort and time to analyze compared to closed-ended questions.
So, if your goal is to save time and energy, consider using close-ended restaurant survey questions.
We recommend you ensure your restaurant survey questions are in a language your target audience can understand.
For example, if you plan to engage respondents of Hispanic heritage, use translated questions to make everything easier.
Also, engage Hispanics during the pretesting to pinpoint confusing questions.
So, how can you gather data using restaurant survey questions?
We recommend you create a restaurant survey using free tools like Google Forms as it will be helpful to add and get feedback from this type of survey questions.
This application provides an innovative way to gather your target market’s feelings about your restaurant brand.
Google Forms is a time-saver compared to other data collection strategies, such as in-person interviews.
Imagine you’ve put together a restaurant survey using Google Forms to gather data.
Your objective is to share the restaurant survey form with your target market.
Follow the easy steps below.


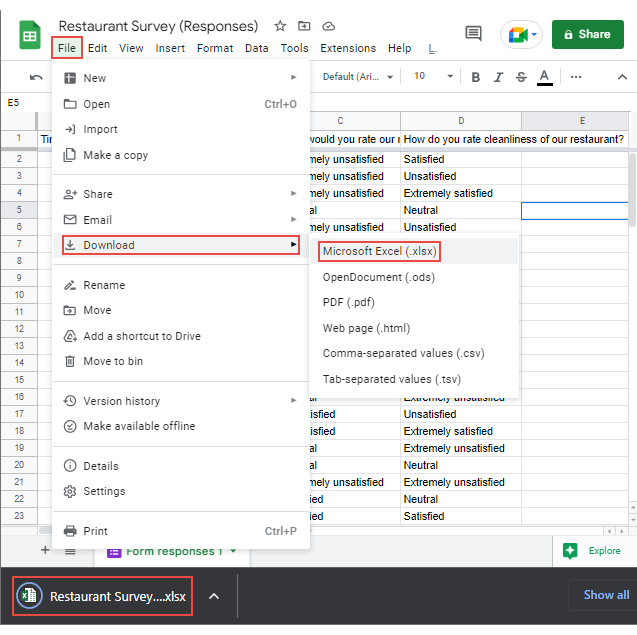

In the ensuing section, we’ll show you how to analyze restaurant survey questionnaire data in Excel.
Excel is a spreadsheet application you can use to organize, store, and visualize data using charts and graphs.
You’re unlikely to find visualizations designed purposely to visualize restaurant survey data.
We’re not advocating you leave Microsoft Excel.
Install a particular third-party add-in in your Excel to access restaurant survey-oriented graphs, such as the Likert Scale Chart.
The application is called ChartExpo.
What is ChartExpo?
ChartExpo is an add-in you can easily install in your Microsoft Excel to access charts for visualizing restaurant survey questions.
ChartExpo is inexpensive. You’ll spend $10 every month only. Besides, you’re free to cancel your subscription anytime.
Also, you don’t need coding skills to generate insightful and ready-made restaurant survey charts for your stories.
ChartExpo charts are available both in Google Sheets and Microsoft Excel. Please use the following CTA’s to install the tool of your choice and create beautiful visualizations in a few clicks in your favorite tool.


This section will use a Likert Scale Chart (one of the restaurant survey questions-friendly charts) to visualize the survey responses below.


A restaurant survey helps you measure your target market’s awareness of your restaurant or services.
You can easily gain insights into how your guests view your brand and how you can improve its positioning.
This can be a powerful indicator of your success in reaching your target market.
One of the key merits of a survey is that you can use it to question your audience over a protracted time.
The longer you gather data, the more you’ll have for analysis. More data means a higher degree of reliability of the resulting insights.
Restaurant survey questions can help you improve service, menu, and overall experience.
To better meet the needs of your customers, you’ve got to understand their psychology, culinary preferences, dislikes, etc. The more you understand your customers, the higher the chances of getting the right results.
Properly crafted restaurant survey questions with specific questions can do wonders, especially in understanding customers.
Let’s assume you’ve used restaurant survey questions to gather data.
How do you extract answers from the data?
This is where survey-based charts, such as Likert, come in.
A Likert Scale Chart is straightforward to read and interpret.
Microsoft Excel lacks ready-to-go and insightful Likert Scale Charts for visualizing restaurant survey questions.
So, what’s the solution?
We recommend you install an add-in, such as ChartExpo, to access the Likert Scale Chart and other restaurant survey questions-based visualizations.
ChartExpo is an Excel add-in loaded with ready-made restaurant survey-based visualizations, such as the Likert Scale Chart.
Sign up for a 7-day free trial today to access ready-made graphs for visualizing restaurant survey data.
How much did you enjoy this article?


Google Forms to Google Sheets keeps your data organized and current with every submission. Learn the steps, methods, and tips now!

Product survey questions reveal what customers truly think. Learn how to ask the right ones and act on the survey results. Read on!

Learn how the 5-Point Performance Rating Scale improves employee evaluations with clear, consistent, and fair performance reviews across teams.


