• Home
  • Tools dropdown img
    • Spreadsheet Charts

      • ChartExpo for Google Sheets
      • ChartExpo for Microsoft Excel
    • Power BI Charts

      • Power BI Custom Visuals by ChartExpo
    • Word Cloud

  • Charts dropdown img
    • Chart Category

      • Bar Charts
      • Circle Graphs
      • Column Charts
      • Combo Charts
      • Comparison Charts
      • Line Graphs
      • PPC Charts
      • Sentiment Analysis Charts
      • Survey Charts
    • Chart Type

      • Box and Whisker Plot
      • Clustered Bar Chart
      • Clustered Column Chart
      • Comparison Bar Chart
      • Control Chart
      • CSAT Survey Bar Chart
      • CSAT Survey Chart
      • Dot Plot Chart
      • Double Bar Graph
      • Funnel Chart
      • Gauge Chart
      • Likert Scale Chart
      • Matrix Chart
      • Multi Axis Line Chart
      • Overlapping Bar Chart
      • Pareto Chart
      • Radar Chart
      • Radial Bar Chart
      • Sankey Diagram
      • Scatter Plot Chart
      • Slope Chart
      • Sunburst Chart
      • Tornado Chart
      • Waterfall Chart
      • Word Cloud
    • Google Sheets
      Microsoft Excel
  • Services
  • Pricing
  • Contact us
  • Blog
  • Support dropdown img
      • Gallery
      • Videos
      • Contact us
      • FAQs
      • Resources
    • Please feel free to contact us

      atsupport@chartexpo.com

Categories
All Data Visualizations Data Analytics Surveys
Add-ons/
  • Google Sheets
  • Microsoft Excel
  • Power BI
All Data Visualizations Data Analytics Surveys
Add-ons
  • Google Sheets
  • Microsoft Excel
  • Power BI

We use cookies

This website uses cookies to provide better user experience and user's session management.
By continuing visiting this website you consent the use of these cookies.

Ok

ChartExpo Survey


Home > Blog > Google Sheets

Import XML to Google Sheets: Smarter Ways to Use XML

What is Import XML to Google Sheets, and why does it matter to so many professionals today? Data drives decisions, and companies handle enormous amounts of it every second. With a simple function, you can pull structured data directly into your spreadsheets. No extra software. No complicated coding.

Import XML to Google Sheets

The IMPORTXML function turns a static spreadsheet into a dynamic data hub. Imagine getting live currency rates, news feeds, or product listings without manual updates. That’s the power of Import XML to Google Sheets.

Google Sheets ranks among the top choices for cloud-based collaboration. With this growing demand, you expect seamless integration with Google Spreadsheets for their daily operations. For this reason, integrating XML feeds is no longer a bonus — it’s a must. Data access should feel natural, not forced.

As teams expand across locations, sharing insights remains critical. Moreover, knowing how to share a Google Sheets without disrupting workflows matters. Teams can collaborate, comment, and edit together in real time. This smooth exchange saves hours and helps maintain data integrity.

Data is no longer a static resource. It flows, updates, and changes by the minute. With tools like Import XML to Google Sheets, your spreadsheet becomes more than a table. It’s an innovative solution for fast-paced business needs.

Let’s dive deeper…

Table of Contents:

  1. What is Import XML to Google Sheets?
  2. Why Use Google Sheets ImportXML?
  3. When to Import XML into Google Sheets?
  4. What is the IMPORTXML Function in Google Sheets?
  5. How to Perform IMPORTXML in Google Sheets?
  6. How to Analyze XML-Imported Data in Google Sheets?
  7. Limitations of the IMPORTXML Function in Google Sheets
  8. FAQs
  9. Wrap Up

What is Import XML to Google Sheets?

Definition: Importing XML to Google Sheets lets you pull structured XML data directly into your spreadsheet using simple functions. It works using a simple formula inside Google Sheets. This enhances Google Sheets functionality by automating live data imports.

You can fetch information from websites, APIs, or online reports. This feature also enhances Google Sheets’ artificial intelligence capabilities by providing real-time data for analysis and insights. It saves time and removes the need for manual copying.

Top Five Charts Created after Importing XML to Google Sheets

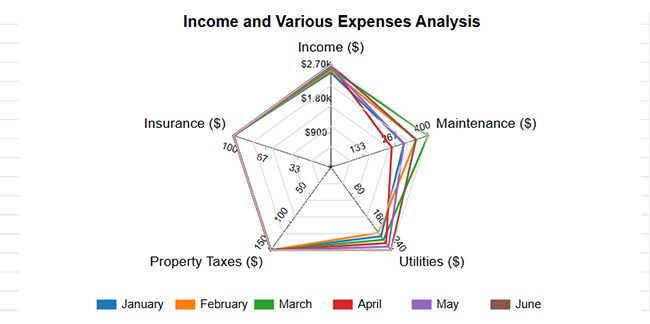
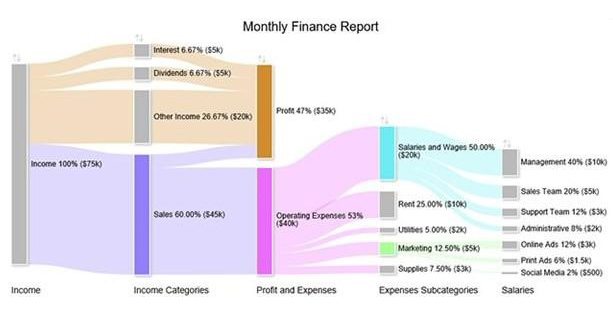
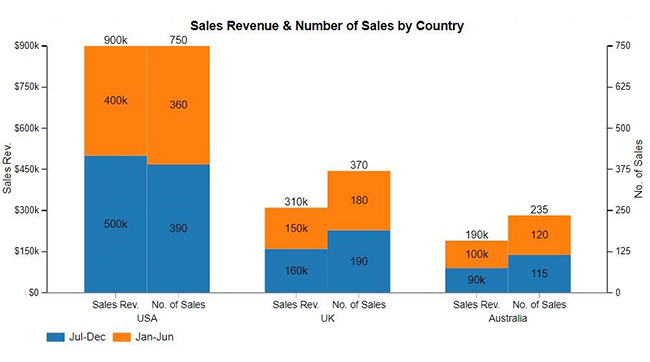
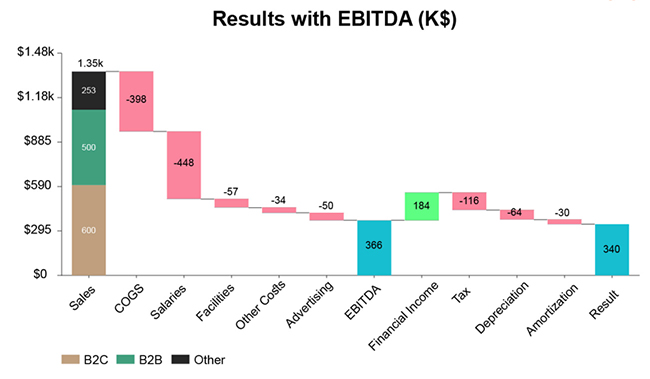
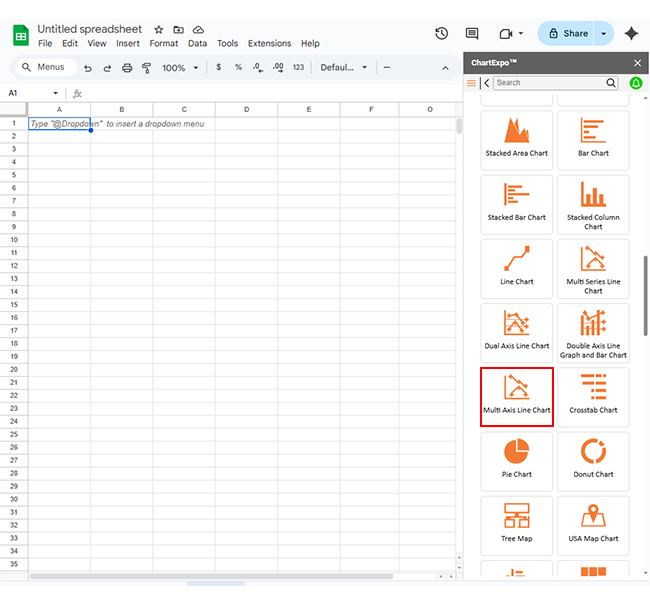
Explore the top five charts to analyze XML data imported to Google Sheets. These charts were created using ChartExpo for clear, powerful insights:

Multi Axis Line Chart:

Import XML to Google Sheets

Multi Axis Spider Chart:

Import XML to Google Sheets

Sankey Chart:

Import XML to Google Sheets

Clustered Stacked Bar Chart:

Import XML to Google Sheets

Stacked Waterfall Chart:

Import XML to Google Sheets

Why Use Google Sheets ImportXML?

Copying and pasting data from websites into your spreadsheets is slow, tedious, and prone to mistakes. Now, imagine pulling live data straight into Google Sheets with just one formula. That’s what ImportXML does. It automates the hard work so you can focus on what matters—analyzing and acting on your data.

Here’s why using Google Sheets IMPORTXML can transform your workflow:

  • Automates data collection: No more manual copy-pasting from websites or feeds. With IMPORTXML, your sheet automatically pulls structured data based on the URL and XPath you specify.
  • Saves time and reduces errors: Manual entry is slow and prone to errors. IMPORTXML fetches accurate data instantly, cutting your risk of mistakes.
  • Uses XPath for flexibility: XPath enables you to pinpoint precisely the data you want from a webpage. You can target headings, prices, links, or even meta descriptions with ease.
  • Enables real-time data updates: Your spreadsheet updates when the source changes — no refresh needed. This ensures your team always works with the latest information.
  • Cloud-based collaboration: Using Google Sheets functionality, teams can view, comment on, and edit live data together. Whether across departments or countries, everyone stays on the same page in real time.

When to Import XML into Google Sheets?

Have you ever wished your spreadsheet could act like a live dashboard? That’s precisely what happens when you bring Import XML to Google Sheets into your workflow. It turns a simple sheet into a live data powerhouse.

Here are real scenarios where Google Spreadsheet Integration makes a real impact:

  • When working with structured web data: Websites often publish data in structured formats like XML. IMPORTXML helps you pull that data directly into your sheet without the need for extra tools.
  • For real-time data monitoring: Need live price updates, stock values, or news feeds? IMPORTXML keeps your data up to date as the source updates.
  • During API integration or feed import: Some APIs offer data in XML format. By importing XML to Google Sheets, you can pull this API data directly for analysis or tracking.
  • For automation and reporting: Regular reports need regular data. Automating imports means your reports update themselves with the latest information.
  • In collaborative environments: Teams can access real-time data together using Google Sheets. This boosts collaboration and ensures everyone is working with the exact numbers.

What is the IMPORTXML Function in Google Sheets?

Have you ever gotten tired of chasing down updates or copying data from endless websites? Importing XML to Google Sheets solves that. It fetches live information straight into your sheet — fast, automatic, and precise. Here’s how the IMPORTXML function in Google Sheets helps in a real situation:

  • Function syntax: =IMPORTXML(URL, XPath query)

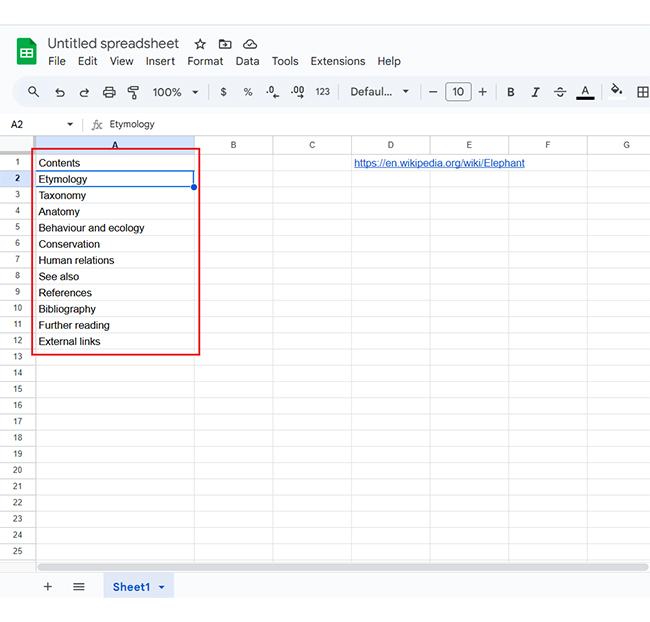
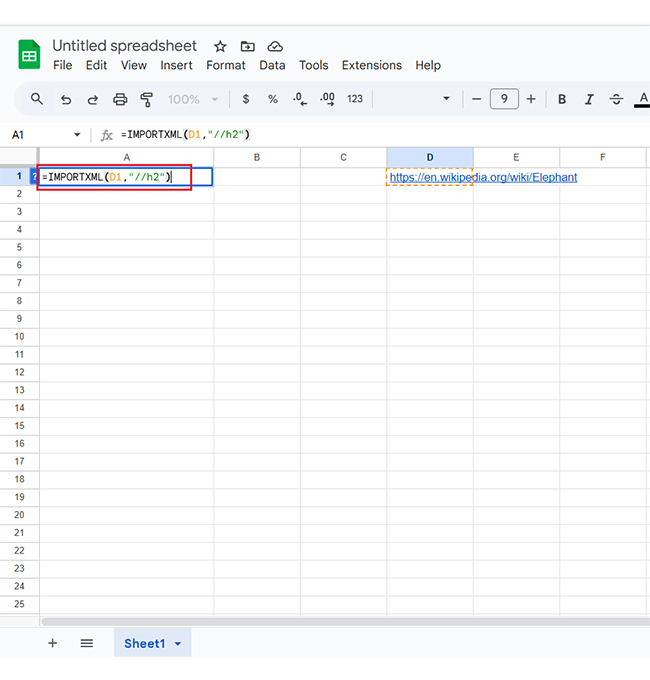
The URL is the webpage or feed from which you want to retrieve data. The XPath query instructs Google Sheets on which part of the data to retrieve.

  • Use cases:
    • Product price monitoring: You can track product prices directly from competitor websites or online stores. The spreadsheet automatically updates prices, helping your team stay competitive and informed.
    • News headlines aggregation: Pull the latest headlines from news sites without visiting each one. This keeps your news dashboard up to date and your team informed.
    • Stock market tracking: Fetch real-time stock prices or financial data feeds. Your reports will always reflect the latest market movements.
    • Website SEO data: Extract key SEO elements, such as meta titles, descriptions, and keywords. This enables your content planning and audits to be faster and wiser.
    • Event listings or schedules: Grab event details from public calendars or listing pages. This is ideal for teams who need updated schedules at a glance.

How to Perform IMPORTXML in Google Sheets?

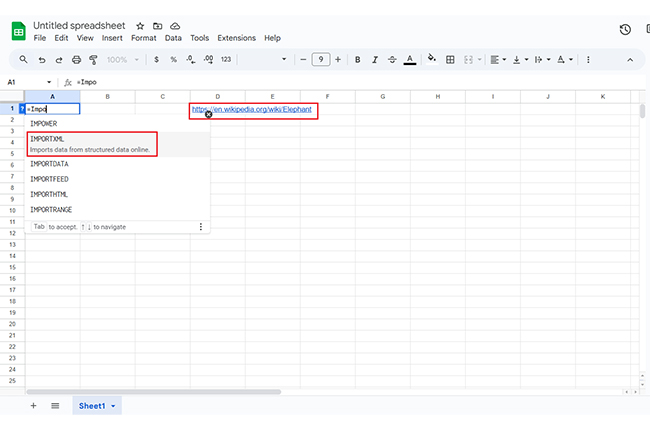
Have you ever wished you could grab data from a website without lifting a finger? With Import XML to Google Sheets, you can. And the best part? It’s easier than you think — no special skills required. Your spreadsheet does the fetching for you.

How?

  • Paste the URL in Google Sheets: Start by placing the website URL in a cell, like A1. This helps you easily reference or change the link without having to edit your formula.
Import XML to Google Sheets
  • Insert the formula to bring in your desired data, for example, headings, as shown below:
  • Use the formula =IMPORTXML(D1, “//h2”) in another cell to pull specific data. This XPath example fetches all main headings from the linked webpage.
Import XML to Google Sheets

How to Analyze XML-Imported Data in Google Sheets?

Have you ever tried turning a pile of numbers into a story? Importing XML to Google Sheets alone won’t win you that clarity.

That’s where data visualization comes in. It makes raw data clear, sharp, and meaningful. However, despite Google Sheets’ ability to handle data well, its charts often fall short. Basic graphs, clunky visuals, and limited options leave your insights buried.

This is where ChartExpo steps in. It plugs right into Google Sheets and powers up your charts. With ChartExpo, your data speaks louder, clearer, and brighter.

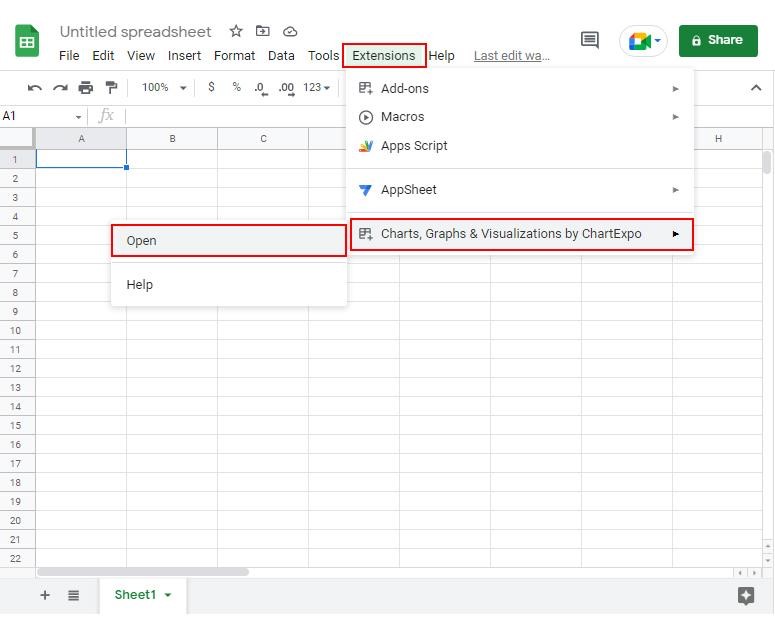
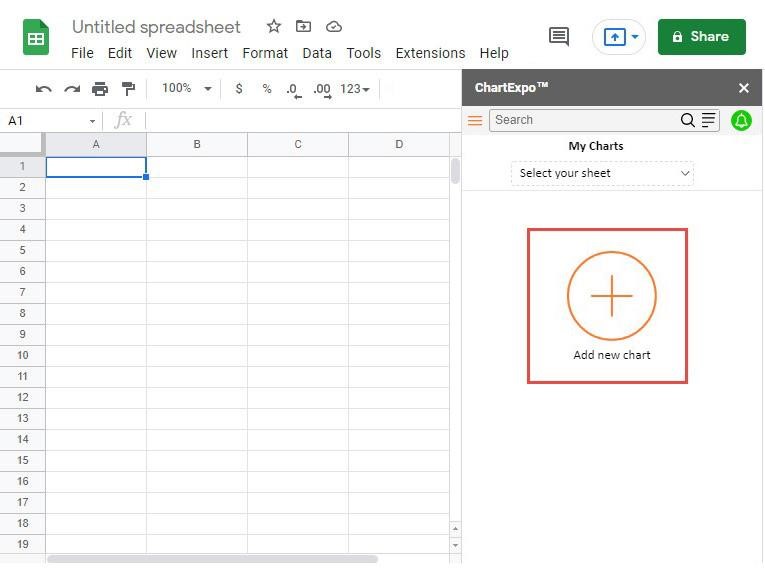
How to Install ChartExpo in Google Sheets?

  1. To start using ChartExpo, download it directly from the Google Sheets program. To do this, select Extensions from the top toolbar.
  2. A menu will appear. Click the Get add-ons option.
  3. Search for ChartExpo, and click on Charts, Graphs & Visualizations by ChartExpo when it appears in the results.
  4. Click the Install button. You will have to confirm your Google account and accept some permissions.

ChartExpo charts are available both in Google Sheets and Microsoft Excel. Please use the following CTAs to install the tool of your choice and create beautiful visualizations in a few clicks in your favorite tool.

Example

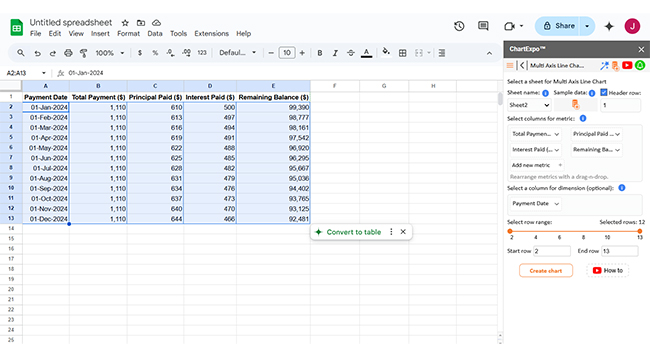
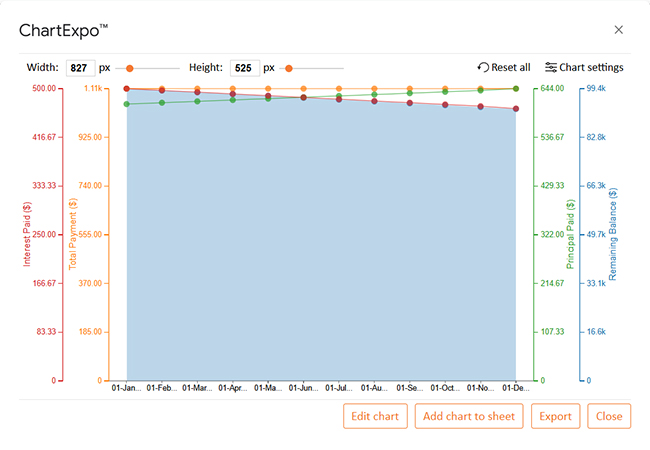
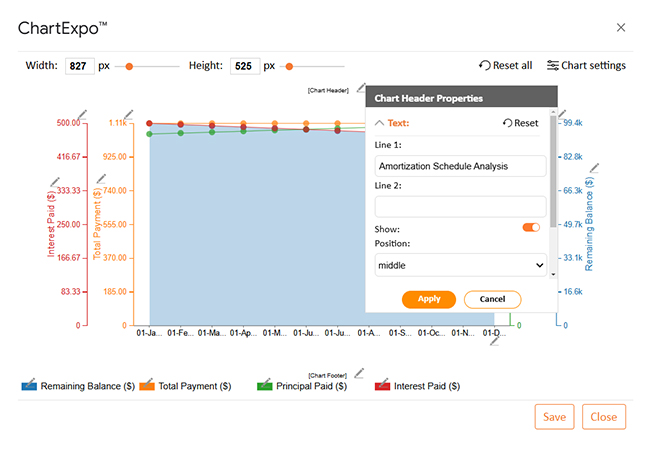
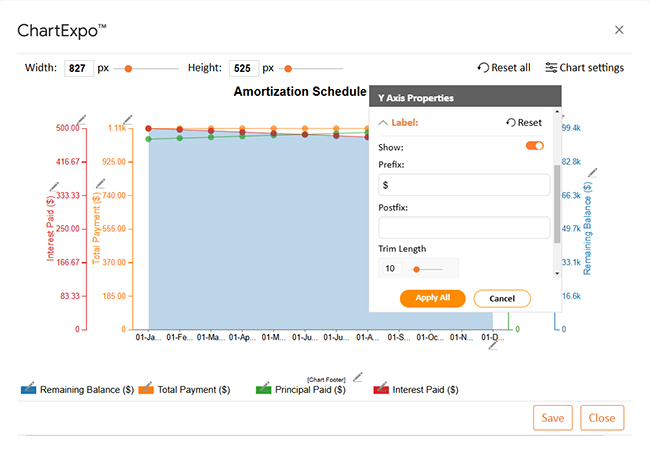
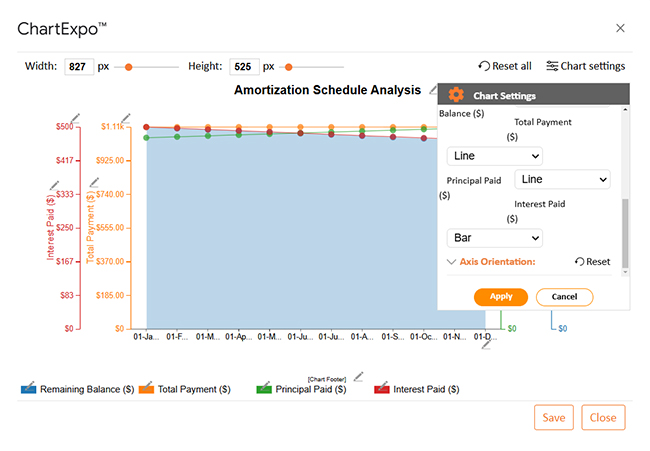
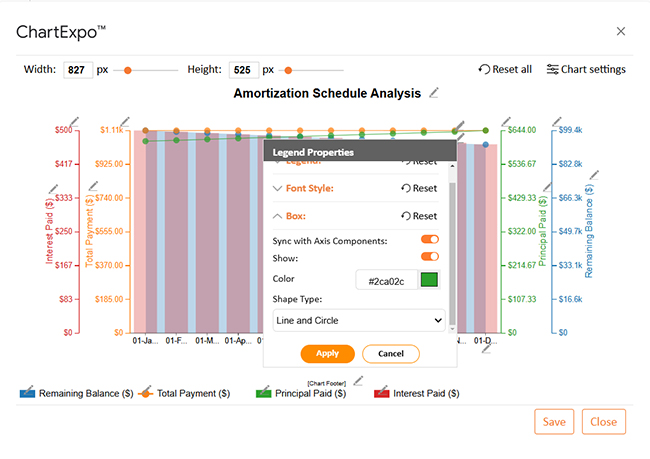
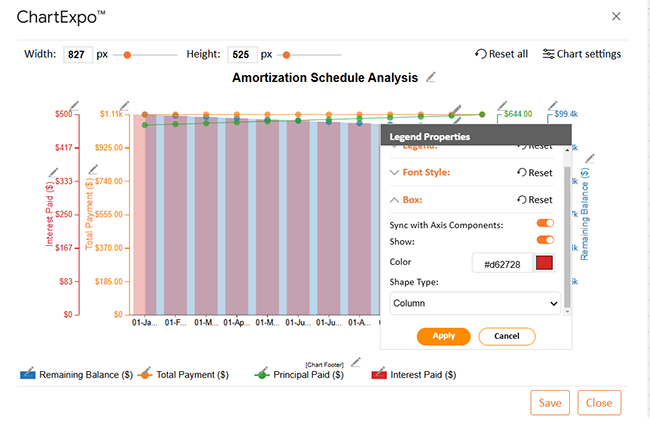
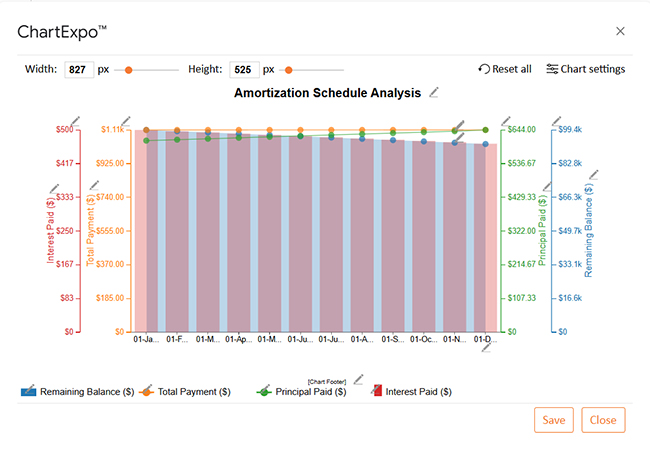
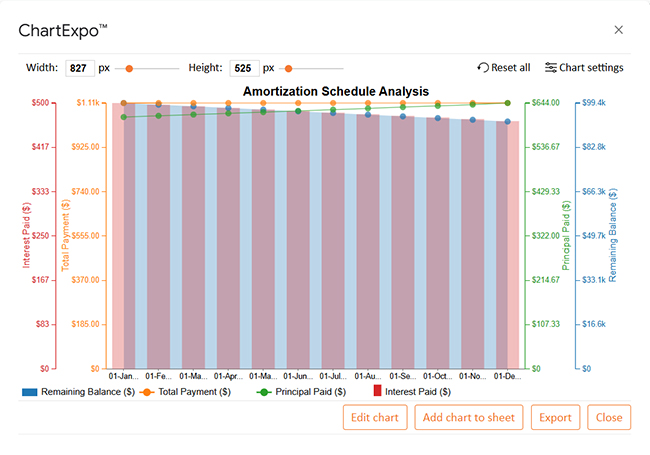
Let’s visualize and analyze this sample data in Google Sheets using ChartExpo.
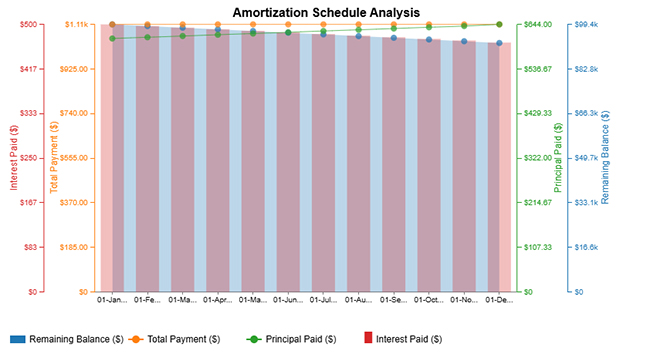
Payment Date Total Payment ($) Principal Paid ($) Interest Paid ($) Remaining Balance ($)
01-Jan-2024 1,110 610 500 99,390
01-Feb-2024 1,110 613 497 98,777
01-Mar-2024 1,110 616 494 98,161
01-Apr-2024 1,110 619 491 97,542
01-May-2024 1,110 622 488 96,920
01-Jun-2024 1,110 625 485 96,295
01-Jul-2024 1,110 628 482 95,667
01-Aug-2024 1,110 631 479 95,036
01-Sep-2024 1,110 634 476 94,402
01-Oct-2024 1,110 637 473 93,765
01-Nov-2024 1,110 640 470 93,125
01-Dec-2024 1,110 644 466 92,481
  • To get started with ChartExpo, install ChartExpo in Google Sheets.
  • Go to Extensions > Charts, Graphs & Visualizations by ChartExpo > Open.
Import XML to Google Sheets
  • To access the charts library, click the Add new chart button.
Import XML to Google Sheets
  • Once it loads, scroll through the charts list to locate and choose the “Multi-Axis Line Chart”.
Import XML to Google Sheets
  • Put the data table in the sheet first. Then, choose the Sheet name from the drop-down in the ChartExpo section.
  • Select the metric column; metric is the numeric column in your data sheet.
  • Select the dimensions column; the dimension is the categorical column in your datasheet that contains text information.
  • Click the Create chart button to complete the process.
Import XML to Google Sheets
  • If you want to add anything to the chart, click the Edit Chart button:
Import XML to Google Sheets
  • Click the pencil icon next to the Chart Header to change the title.
  • It will open the properties dialog. Under the Text section, you can add a heading in Line 1 and enable Show.
  • Give the appropriate title of your chart and click the Apply button.
Import XML to Google Sheets
  • You can add the Dollar Sign ($) with all values and change the precision value to zero as follows:
Import XML to Google Sheets
  • You can change the data representation by clicking on Settings as follows:
Import XML to Google Sheets
  • Change the label shape of Total Payment and Principal Paid into “Line and Circle” and click the “Apply” button:
Import XML to Google Sheets
  • Change the label shape of Interest Paid into Column and click the “Apply” button:
Import XML to Google Sheets
  • After making all changes, click the “Save” button:
Import XML to Google Sheets
  • Your final Multi-Axis Line Chart will resemble the one below.
Import XML to Google Sheets

Insights

  • Monthly payments remain consistent at $1,110.
  • The interest portion decreases over time.
  • The principal portion increases with each payment.
  • The loan balance reduces from $100,000 to $92,481 in one year.
  • This data illustrates how repayment accelerates as interest declines.

Limitations of the IMPORTXML Function in Google Sheets

Will importing XML into Google Sheets always work? Not quite. While it’s powerful, this tool comes with its quirks. Sometimes, it surprises you — and not always in a good way. Here’s what you need to watch out for before making it part of your daily Google Spreadsheet integration:

  • Website restrictions (no access or blocking): Some websites block automated data requests. If that happens, your formula returns errors or blank cells.
  • XPath complexity and errors: XPath queries need to be exact. A minor mistake can cause your import to fail.
  • Refresh and load delays: Google Sheets doesn’t refresh imported data instantly. Sometimes, you’ll wait longer than expected for updates to appear.
  • Limited data handling: Large data imports can cause your sheet to break or slow down. Google Sheets’ artificial intelligence can help with analysis, but it won’t fix overloaded sheets.
  • Unpredictable behavior: IMPORTXML can stop working for reasons beyond your control, such as site layout changes or server issues. Even a minor tweak on the source page may break your formula.
  • No pagination support: It can’t pull data from multiple pages at once. If a website spreads data across pages, IMPORTXML grabs content from the first page only.

FAQs

Can I import XML into Google Sheets?

Yes, you can import XML into Google Sheets. Use the IMPORTXML function. It pulls data from a URL. Google Sheets doesn’t support direct XML file uploads. So, convert XML to CSV if needed.

How to open an XML file in a Spreadsheet?

  • Open Excel or Google Sheets.
  • Convert XML to CSV using an online tool.
  • Import the CSV into your spreadsheet.
  • Use IMPORTXML for web XML data.
  • Ensure correct structure for parsing.

Wrap Up

IMPORTXML in Google Sheets is a powerful tool. It allows you to extract data from structured web pages. This includes data from XML, HTML, and RSS feeds. You need a proper URL and XPath query. It’s simple but effective.

This function saves time. Instead of copying data manually, it updates automatically. It helps you stay current – Perfect for price tracking, SEO, or news. You can use this function with IMPORTRANGE in Google Sheets. This allows you to combine data from other spreadsheets. Use both to build dynamic dashboards.

When switching platforms, it’s important to learn how to convert an Excel file to a Google Sheets file well. Don’t worry; I have simplified it for you. Just upload your Excel file to Google Drive. Then open it with Google Sheets. Now you can use all the functions, such as IMPORTXML.

Want to rearrange your data after import? Use Google Sheets transpose. It switches rows into columns. Or columns into rows. This helps when organizing large data sets.

Google Sheets is powerful. With IMPORTXML, TRANSPOSE, and IMPORTRANGE, you gain flexibility. To enhance your visuals, install ChartExpo. ChartExpo will provide you with eye-catching, insightful data visualizations for easy and impactful data analysis.

How much did you enjoy this article?

GSAd2
Start Free Trial!
156618

Related articles

next previous
Google Sheets10 min read

Wedding Budget Template in Google Sheets: Clear Insights

The wedding budget template in Google Sheets tracks and organizes wedding costs. This guide shows you how to set it up and stay on budget with ease.

Google Sheets11 min read

Google Sheets HLOOKUP: A Simple Walkthrough

Google Sheets HLOOKUP finds data fast by scanning rows. Click here to learn how to use it to save time, reduce errors, work smarter, and more.

Google Sheets11 min read

Compare Two Columns in Google Sheets: A Quick Guide

Learn how to compare two columns in Google Sheets with ease. This guide helps you spot differences, clean data, visualize results quickly, and more.

Google Sheets11 min read

Gemini in Google Sheets: Simplifying Data for Insights

Gemini in Google Sheets lets you automate tasks with simple prompts. Click here to learn how to use it, create charts, and boost productivity with expert tips.

Google Sheets13 min read

Google Spreadsheet Templates: You Can Use Today

Google spreadsheet templates simplify tracking, planning, and reporting. Click here to learn how to use them with examples, tips, visual tools, and more.

ChartExpo logo

Turn Data into Visual
Stories

CHARTEXPO

  • Home
  • Gallery
  • Videos
  • Services
  • Pricing
  • Contact us
  • FAQs
  • Privacy policy
  • Terms of Service
  • Sitemap

TOOLS

  • ChartExpo for Google Sheets
  • ChartExpo for Microsoft Excel
  • Power BI Custom Visuals by ChartExpo
  • Word Cloud

CATEGORIES

  • Bar Charts
  • Circle Graphs
  • Column Charts
  • Combo Charts
  • Comparison Charts
  • Line Graphs
  • PPC Charts
  • Sentiment Analysis Charts
  • Survey Charts

TOP CHARTS

  • Sankey Diagram
  • Likert Scale Chart
  • Comparison Bar Chart
  • Pareto Chart
  • Funnel Chart
  • Gauge Chart
  • Radar Chart
  • Radial Bar Chart
  • Sunburst Chart
  • see more
  • Scatter Plot Chart
  • CSAT Survey Bar Chart
  • CSAT Survey Chart
  • Dot Plot Chart
  • Double Bar Graph
  • Matrix Chart
  • Multi Axis Line Chart
  • Overlapping Bar Chart
  • Control Chart
  • Slope Chart
  • Clustered Bar Chart
  • Clustered Column Chart
  • Box and Whisker Plot
  • Tornado Chart
  • Waterfall Chart
  • Word Cloud
  • see less

RESOURCES

  • Blog
  • Resources
  • YouTube
SIGN UP FOR UPDATES

We wouldn't dream of spamming you or selling your info.

© 2025 ChartExpo, all rights reserved.