• Home
  • Tools dropdown img
    • Spreadsheet Charts

      • ChartExpo for Google Sheets
      • ChartExpo for Microsoft Excel
    • Power BI Charts

      • Power BI Custom Visuals by ChartExpo
    • Word Cloud

  • Charts dropdown img
    • Chart Category

      • Bar Charts
      • Circle Graphs
      • Column Charts
      • Combo Charts
      • Comparison Charts
      • Line Graphs
      • PPC Charts
      • Sentiment Analysis Charts
      • Survey Charts
    • Chart Type

      • Box and Whisker Plot
      • Clustered Bar Chart
      • Clustered Column Chart
      • Comparison Bar Chart
      • Control Chart
      • CSAT Survey Bar Chart
      • CSAT Survey Chart
      • Dot Plot Chart
      • Double Bar Graph
      • Funnel Chart
      • Gauge Chart
      • Likert Scale Chart
      • Matrix Chart
      • Multi Axis Line Chart
      • Overlapping Bar Chart
      • Pareto Chart
      • Radar Chart
      • Radial Bar Chart
      • Sankey Diagram
      • Scatter Plot Chart
      • Slope Chart
      • Sunburst Chart
      • Tornado Chart
      • Waterfall Chart
      • Word Cloud
    • Google Sheets
      Microsoft Excel
  • Services
  • Pricing
  • Contact us
  • Blog
  • Support dropdown img
      • Gallery
      • Videos
      • Contact us
      • FAQs
      • Resources
    • Please feel free to contact us

      atsupport@chartexpo.com

Categories
All Data Visualizations Data Analytics Surveys
Add-ons/
  • Google Sheets
  • Microsoft Excel
  • Power BI
All Data Visualizations Data Analytics Surveys
Add-ons
  • Google Sheets
  • Microsoft Excel
  • Power BI

We use cookies

This website uses cookies to provide better user experience and user's session management.
By continuing visiting this website you consent the use of these cookies.

Ok

ChartExpo Survey


Home > Blog > Microsoft Excel

Google Spreadsheet Alternatives for Insightful Visuals

What is a Google Spreadsheet alternative?

With the rise of digital tools, you must explore options beyond Google Sheets. Alternatives offer unique features, better performance, or a tailored fit for specific needs. Finding the right tool is important to manage data for business, project, or personal use.

Over 2 billion people use Google Workspace, including Sheets. However, some seek alternatives for advanced features, offline capabilities, or enhanced collaboration. Tools like Microsoft Excel, Zoho Sheet, and Airtable are gaining popularity for their unique offerings. Each caters to different preferences and work styles.

Google Spreadsheet Alternatives

Imagine needing a platform that integrates seamlessly with other apps or one built for large datasets. A Google Spreadsheet alternative might provide faster processing or deeper customization. These tools improve efficiency and meet specialized needs.

Don’t get me wrong: choosing an alternative isn’t replacing Google Sheets; it’s finding the best solution for your tasks. Some tools focus on simplicity, while others offer complex, data-driven features. The key is to understand what works for you.

In this blog, we’ll explore the best options.

Table of Contents:

  1. What is a Google Spreadsheet Alternative?
  2. Why Do You Need Alternatives to Google Sheets?
  3. Top 10 Alternatives of Google Sheets
  4. How to Choose Google Sheets Competitor?
  5. How to Use Google Sheets Alternative for Charting?
  6. Wrap Up

First…

What is a Google Spreadsheet Alternative?

Definition: A Google Spreadsheet alternative is any tool that offers similar or enhanced features for managing data. These tools provide unique benefits, such as advanced analytics, offline access, or better integration with other apps.

Google Spreadsheet alternatives cater to different needs, from basic data tracking to complex data analysis. Businesses and individuals choose them for flexibility, performance, or specific functionalities. Exploring these options can help you find the best fit for your tasks.

Why Do You Need Alternatives to Google Sheets?

Exploring alternatives boosts your workflow and unlocks new features. Here are the key reasons why you might need a Google Sheets alternative:

  • Performance and scalability: Google spreadsheets make handling small datasets easy. On the other hand, alternative methods handle larger files and complex calculations more efficiently.
  • Limited advanced features: Google Sheets may need more advanced options. Tools like Excel or Airtable offer in-depth data analytics and automation capabilities.
  • Offline access and connectivity issues: Google Sheets requires a steady internet connection. If you need offline access, there are tools to ensure uninterrupted productivity.
  • Privacy and data control concerns: Self-hosted or encrypted platforms give you more control over sensitive information.
  • Collaboration limits: While great for teamwork, Google Sheets has limitations in managing extensive collaboration. Alternatives can offer more robust sharing and editing options.

Top 10 Alternatives of Google Sheets

Whether you need advanced features, better performance, or just a change of pace, there’s a perfect alternative waiting for you. Here are the top 10 Google Sheets alternatives:

  1. Microsoft Excel: The gold standard for data crunching and advanced analytics.
Microsoft Excel as Google Spreadsheet Alternatives
  1. Airtable: A blend of spreadsheets and databases, perfect for creative workflows.
Airtable as Google Spreadsheet Alternatives
  1. Zoho Sheet: Collaboration and automation rolled into one.
Zoho Sheet as Google Spreadsheet Alternatives
  1. Apple Numbers: Sleek, user-friendly, and built for Apple fans.
Apple Numbers as Google Spreadsheet Alternatives
  1. OnlyOffice: Powerful and secure, ideal for teams.
OnlyOffice as Google Spreadsheet Alternatives
  1. Smartsheet:  Combines spreadsheets with project management tools.
Smartsheet as Google Spreadsheet Alternatives
  1. Quip:  Collaborative and chat-friendly for team projects.
Quip as Google Spreadsheet Alternatives
  1. LibreOffice Calc: Open-source, free, and packed with features.
LibreOffice Calc as Google Spreadsheet Alternatives
  1. WPS Office Spreadsheets: Lightweight and versatile, with a familiar interface.
WPS Office Spreadsheets as Google Spreadsheet Alternatives
  1. Coda: More than a spreadsheet, it’s a powerful document and app-building tool.
Coda as Google Spreadsheet Alternatives

How to Choose Google Sheets Competitor?

Choosing a Google Sheets competitor can simplify your work. The right tool depends on your needs, team, and budget.

  • Functionality: Look for tools with features like data analysis, automation, or offline access. These capabilities can handle more complex tasks than Google Sheets.
  • Collaboration: Teamwork is important; choose tools with real-time updates and sharing controls. They keep you aligned and make group projects easier.
  • Customization: A good competitor lets you adjust layouts and workflows to fit your needs. Flexibility ensures the tool works for your specific projects.
  • Platform and integration: Ensure the tool integrates seamlessly with CRM analytics, project management software, or business apps. Such connectivity streamlines workflows and enhances data-driven decision-making.
  • Cost: Compare free plans and paid subscriptions to find what fits your budget. Only pay for the features you truly need.

How to Use Google Sheets Alternative for Charting?

Data visualization is essential for clear, impactful data analysis. Tools like Google Sheets often need to improve when creating dynamic, eye-catching visuals. Complex charts take time, and options can feel limited.

Enter ChartExpo—a powerful solution to Google Sheets’ visualization limitations. It’s designed to make stunning, insightful charts, transforming how you present and understand data.
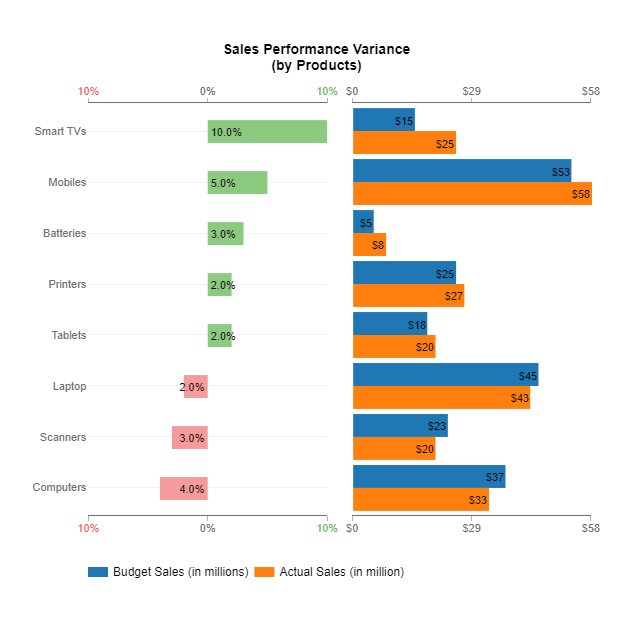
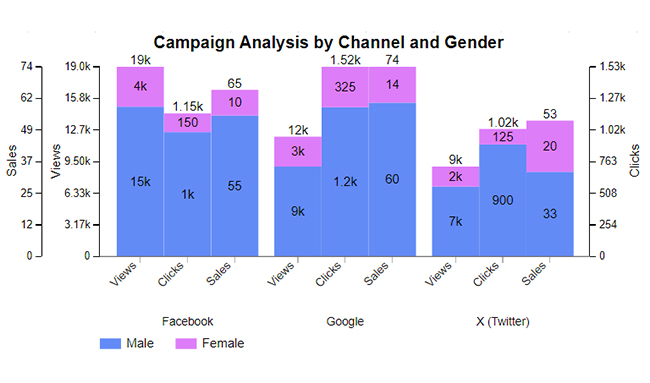
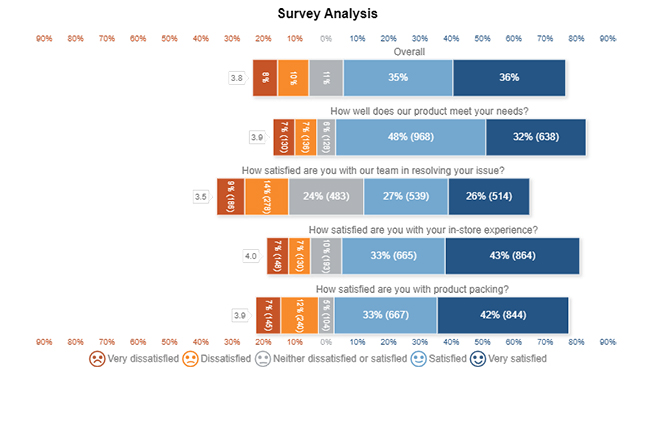
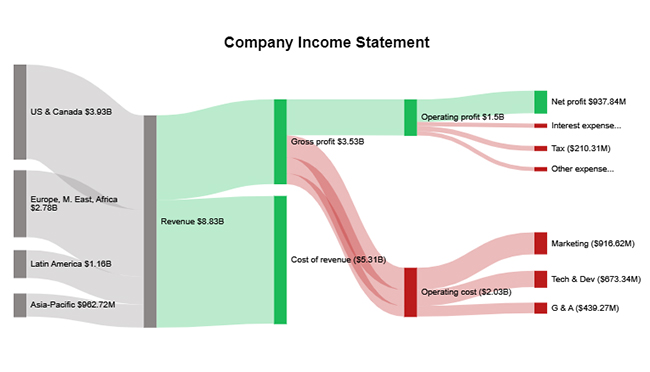
Here are the top 5 charts and graphs created in Google Sheets using ChartExpo.

Progress Chart

Progress Chart as Google Spreadsheet Alternatives

Clustered Stacked Bar Chart

Clustered Stacked Bar Chart as Google Spreadsheet Alternatives

Likert Scale Chart

Likert Scale Chart as Google Spreadsheet Alternatives

Sankey Chart

Sankey Chart as Google Spreadsheet Alternatives

Multi Axis Line Chart:

Multi Axis Line Chart as Google Spreadsheet Alternatives

Let’s learn how to Install ChartExpo in Excel.

  1. Open your Excel application.
  2. Open the worksheet and click the “Insert” menu.
  3. You’ll see the “My Apps” option.
  4. In the Office Add-ins window, click “Store” and search for ChartExpo on my Apps Store.
  5. Click the “Add” button to install ChartExpo in your Excel.

ChartExpo charts are available both in Google Sheets and Microsoft Excel. Please use the following CTAs to install the tool of your choice and create beautiful visualizations with a few clicks in your favorite tool.

Example

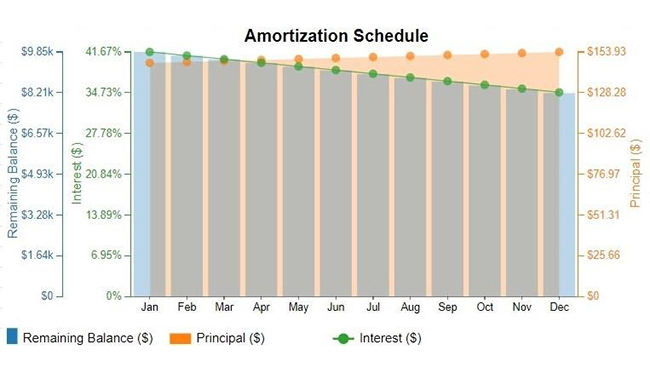
Let’s explore this sample data in Excel using ChartExpo, a powerful tool for analyzing and interpreting data effectively.

Payment Month Interest ($) Principal ($) Remaining Balance ($)
Jan 41.67 147.05 9,852.95
Feb 41.05 147.66 9,705.30
Mar 40.44 148.27 9,557.02
Apr 39.82 148.89 9,408.13
May 39.2 149.51 9,258.62
Jun 38.58 150.13 9,108.48
Jul 37.95 150.76 8,957.72
Aug 37.32 151.39 8,806.34
Sep 36.69 152.02 8,654.32
Oct 36.06 152.65 8,501.66
Nov 35.42 153.29 8,348.37
Dec 34.78 153.93 8,194.45
  • To get started with ChartExpo, install ChartExpo in Excel.
  • Now Click on My Apps from the INSERT menu.
insert chartexpo in excel
  • Choose ChartExpo from My Apps, then click Insert.
open chartexpo in excel
  • Once it loads, scroll through the charts list to locate and choose the “Multi Axis Line Chart”.
search multi axis line chart in excel
  • After clicking on the chart, you will see the Multi Axis Line Chart on the screen.
See Multi Axis Line Chart Page After Learning Google Spreadsheet Alternatives
  • Click the “Create Chart From Selection” button after selecting the data from the sheet, as shown.
Click Create Chart From Selection After Learning Google Spreadsheet Alternatives
  • You can change the Data Representation as follows:
Change Data Representation After Learning Google Spreadsheet Alternatives
  • ChartExpo will generate the visualization below for you.
Initial Visual After Learning Google Spreadsheet Alternatives
  • If you want to have the chart’s title, click Edit Chart, as shown in the above image.
  • Click the pencil icon next to the Chart Header to change the title.
  • It will open the properties dialog. Under the Text section, you can add a heading in Line 1 and enable Show.
  • Give the appropriate title of your chart and click the Apply button.
Add Chart Header After Learning Google Spreadsheet Alternatives
  • You can add the dollar sign with “Principal” as follows:
Add Postfix with Interest After Learning Google Spreadsheet Alternatives
  • You can then add a percentage sign with “Interest” as follows:
Add Prefix with Remaining Balance After Learning Google Spreadsheet Alternatives
  • You can add the dollar sign with “Remaining Balance” as follows:
Enable Legend After Learning Google Spreadsheet Alternatives
  • You can enable the Legend Show button as follows:
Change Legend Shape of Remaining Balance After Learning Google Spreadsheet Alternatives
  • Change the Legend shape of “Remaining Balance” to Column and click the “Apply” button.
Change Legend Shape of Interest After Learning Google Spreadsheet Alternatives
  • Change the Legend shape of “Interest” into a Line and Circle and click the “Apply” button.
Click Sace Changes After Learning Google Spreadsheet Alternatives
  • To persist the changes made to the chart, you can click on the “Save Changes” button.
Final After Learning Google Spreadsheet Alternatives
  • Your final chart will look like the one below.


Insights

  • Monthly loan payments show declining interest and rising principal contributions.
  • The remaining balance decreases from $9,852.95 in January to $8,194.45 in December.
  • Steady repayment progress is evident over the 12 months.

Enhance Insights with Charts Through Google Spreadsheet Alternatives:

  1. Open your Excel Application.
  2. Install ChartExpo Add-in for Excel from Microsoft AppSource to create interactive visualizations.
  3. Select the Multi-Axis Line Chart from the list of charts.
  4. Select your data.
  5. Click on the “Create Chart from Selection” button.
  6. Customize your chart properties to add header, axis, legends, and other required information.

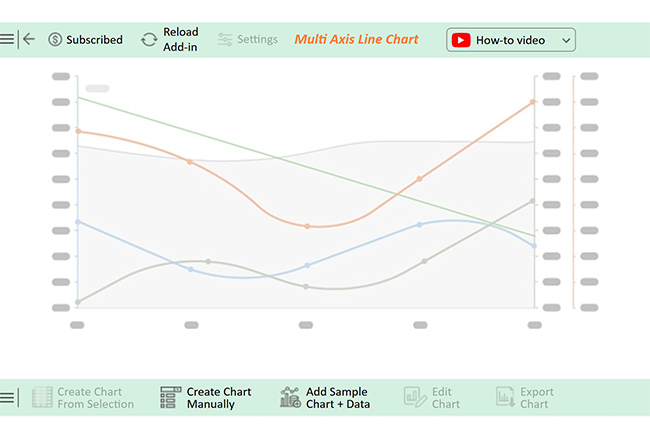
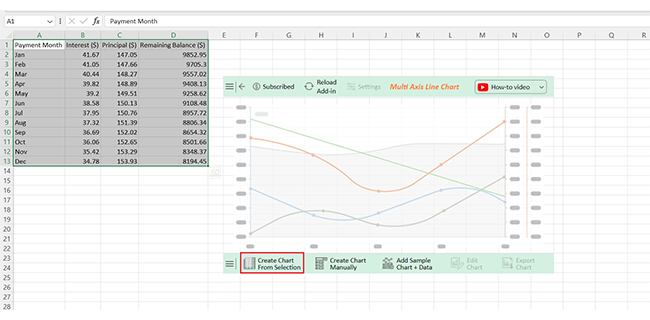
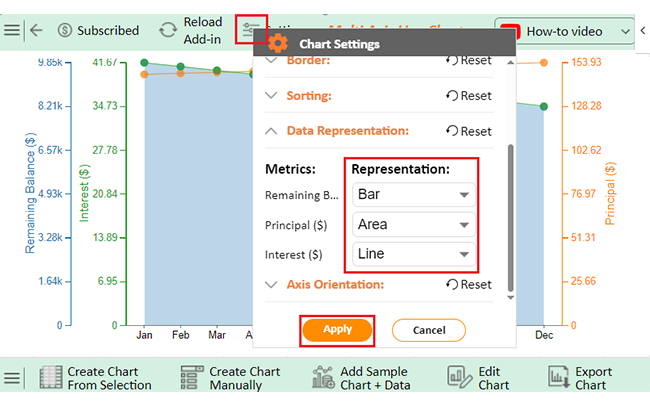
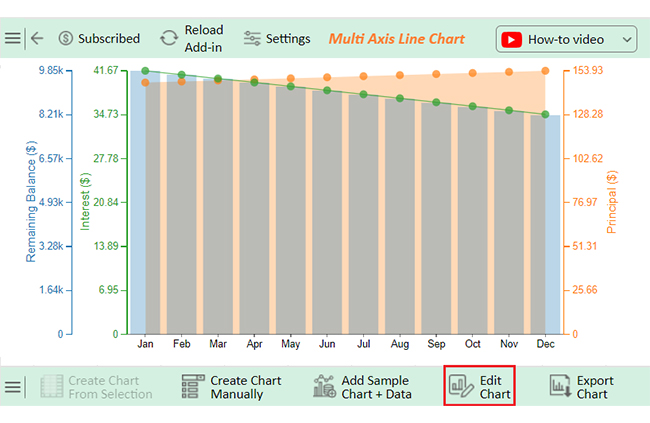
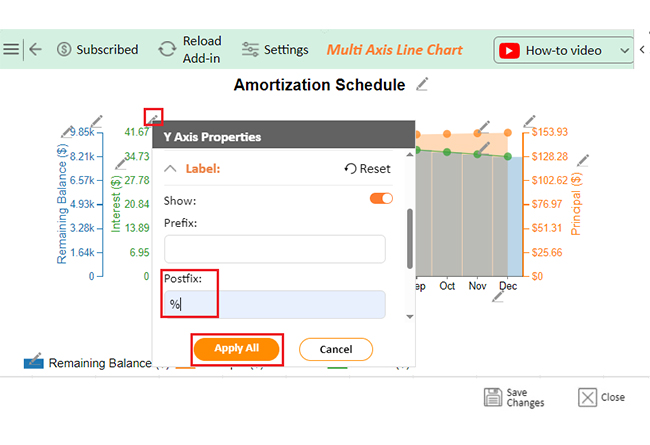
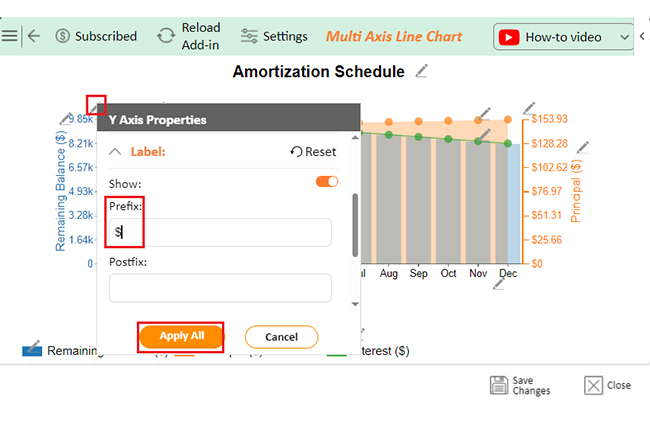
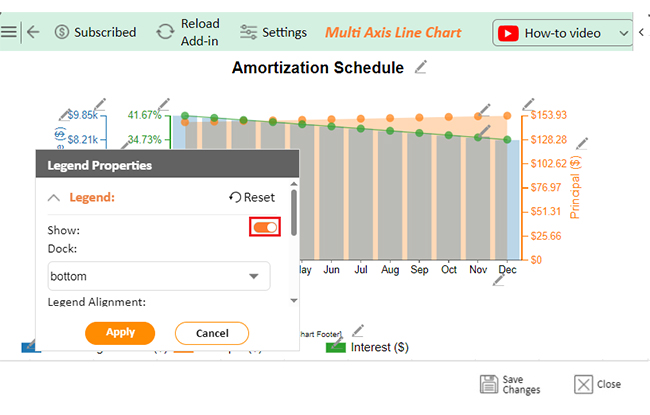
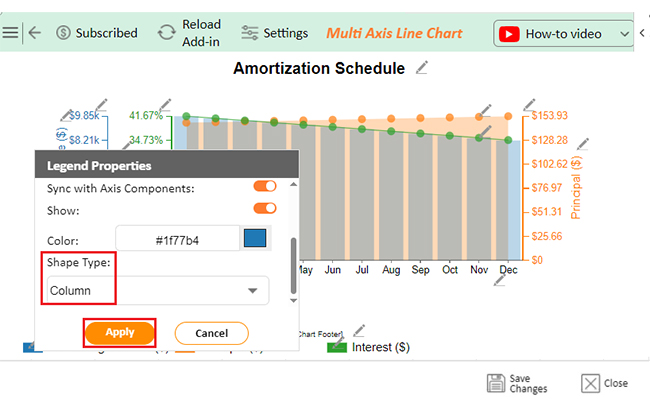
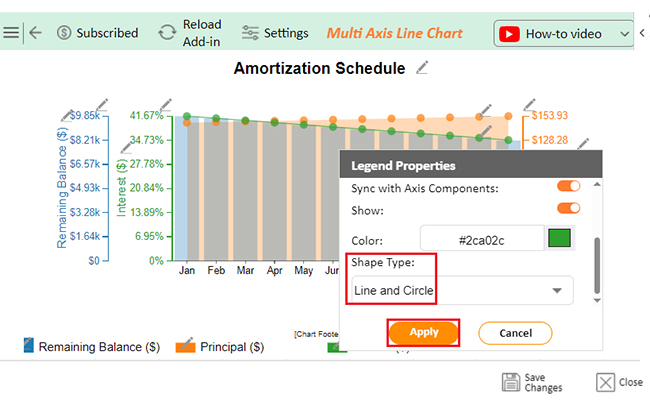
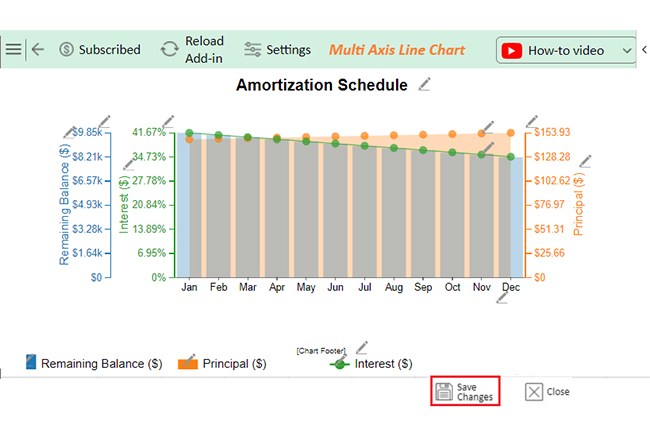
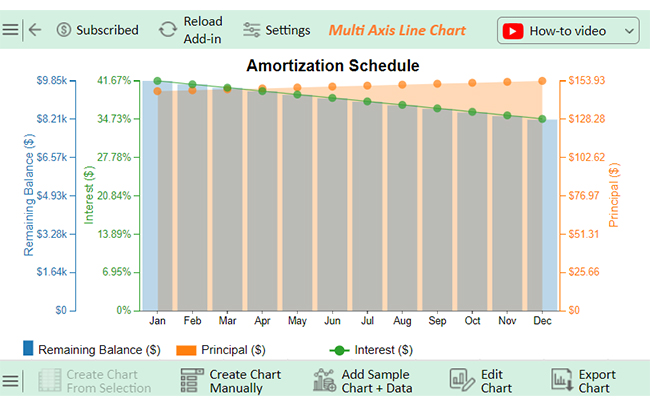
The following video will help you create a Multi-Axis Line Chart in Microsoft Excel.

FAQs

What is better than a Google Sheet?

Airtable blends spreadsheets with databases, which is perfect for creative projects. Excel excels at advanced analytics and large datasets. Try Smartsheet or Coda, offering powerful integrations and streamlined workflows for collaboration.

What is equivalent to Google Sheets?

Zoho Sheet is a strong Google Sheets equivalent, offering collaboration and cloud storage. Microsoft Excel Online mirrors its features for web-based use. LibreOffice Calc provides a free, offline alternative with robust functionality.

Wrap Up

Google Sheets is a powerful tool, but it’s not the only option. Many alternatives are available, and they cater to different needs. They work for businesses, teams, and individuals.

Microsoft Excel is a top competitor. It offers advanced features and works offline and online. Excel is great for professionals; many users trust it.

Airtable is another choice. It combines spreadsheets with databases. It’s user-friendly and visually appealing and also supports collaboration.

Zoho Sheet is also popular. It’s part of the Zoho Office Suite and integrates with other Zoho apps. Zoho is budget-friendly and cloud-based, and it suits small—to medium-sized teams.

For simplicity, try Smartsheet. It’s easy to use and versatile. Smartsheet supports project management and is great for tracking tasks. Teams value its flexibility.

Choosing the right alternative depends on your goals. Business users need robust processing tools, while creative teams prefer visually focused platforms.

Exploring alternatives doesn’t mean abandoning Google Sheets. It means finding tools that complement your work. Each has strengths that can boost productivity.

A Google Spreadsheet alternative empowers you to work smarter. It adapts to your tasks and preferences; you can enhance efficiency and achieve more with the right choice.

How much did you enjoy this article?

ExcelAd2
Start Free Trial!
145339

Related articles

next previous
Microsoft Excel8 min read

Excel Task Tracker Template for Smarter Task Insights

Task tracker template in Excel organizes tasks, tracks deadlines, and boosts efficiency. Learn its benefits, and explore expert tips to simplify task management.

Microsoft Excel10 min read

Invoice Tracker Template in Excel for Better Insights

An invoice tracker Excel template helps track invoices, due dates, and payments. Learn how to use this template for better financial management.

Microsoft Excel12 min read

Key Performance Indicators in Healthcare for Better Insights

Key Performance Indicators in healthcare track patient care and efficiency. Learn about these KPIs, top examples, and how to use them to improve outcomes.

Microsoft Excel10 min read

BMI Calculation Formula in Excel for Better Fitness Insights

The BMI calculation formula in Excel helps track and analyze body mass index. Explore step-by-step instructions and tips to simplify BMI tracking in Excel.

Microsoft Excel29 min read

How to Create a Tornado Chart in Excel? A Complete Guide

Click to learn how to plot a Tornado Chart in Excel using easy-to-follow steps. Also, we’ll address the following question: what is a Tornado Diagram?

ChartExpo logo

Turn Data into Visual
Stories

CHARTEXPO

  • Home
  • Gallery
  • Videos
  • Services
  • Pricing
  • Contact us
  • FAQs
  • Privacy policy
  • Terms of Service
  • Sitemap

TOOLS

  • ChartExpo for Google Sheets
  • ChartExpo for Microsoft Excel
  • Power BI Custom Visuals by ChartExpo
  • Word Cloud

CATEGORIES

  • Bar Charts
  • Circle Graphs
  • Column Charts
  • Combo Charts
  • Comparison Charts
  • Line Graphs
  • PPC Charts
  • Sentiment Analysis Charts
  • Survey Charts

TOP CHARTS

  • Sankey Diagram
  • Likert Scale Chart
  • Comparison Bar Chart
  • Pareto Chart
  • Funnel Chart
  • Gauge Chart
  • Radar Chart
  • Radial Bar Chart
  • Sunburst Chart
  • see more
  • Scatter Plot Chart
  • CSAT Survey Bar Chart
  • CSAT Survey Chart
  • Dot Plot Chart
  • Double Bar Graph
  • Matrix Chart
  • Multi Axis Line Chart
  • Overlapping Bar Chart
  • Control Chart
  • Slope Chart
  • Clustered Bar Chart
  • Clustered Column Chart
  • Box and Whisker Plot
  • Tornado Chart
  • Waterfall Chart
  • Word Cloud
  • see less

RESOURCES

  • Blog
  • Resources
  • YouTube
SIGN UP FOR UPDATES

We wouldn't dream of spamming you or selling your info.

© 2025 ChartExpo, all rights reserved.