Categories
Building a Google Sheets Pie Chart turns raw numbers into visual insights anyone can understand at a glance. Split revenue by source, track project completion stages, or show survey breakdowns with circular slices that make proportions obvious.
Google Sheets handles the heavy lifting while you focus on telling the story behind your data. This walkthrough covers everything from basic setup to advanced customization tricks for a Google Sheets Pie Chart.
You’ll learn exactly how to build Pie Charts that actually look good and communicate clearly. Whether you’re building dashboards or just need quick visuals for a report, these techniques get you there fast.
Definition: The Pie Chart in Google Sheets splits a circle into wedges, with each wedge showing one category’s share of the total. Big values get big slices, small values get narrow ones. This makes comparisons quick and intuitive.
You’ll find a Google spreadsheet Pie Chart deployed across these scenarios:
The simplicity makes the Pie Graph in Google Sheets a go-to option across business teams, classrooms, and data analysis workflows.
A Google Sheets Pie Chart shows you instantly which categories dominate and which barely register. That clarity matters when you’re briefing stakeholders who don’t live in spreadsheets all day.
The Google Sheets Pie Chart delivers:
Pair them with progress trackers or forecasting visuals, and you’ve got a dashboard that tells the full story.
Start by opening the Google Sheets file that contains the data you want to visualize using a Pie Chart.
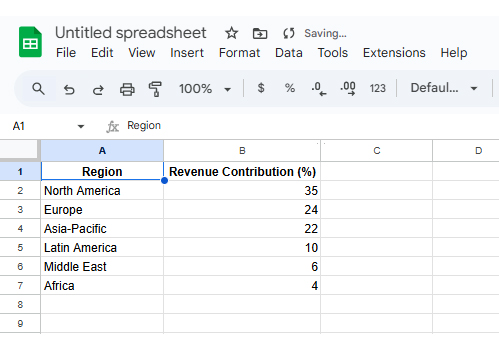
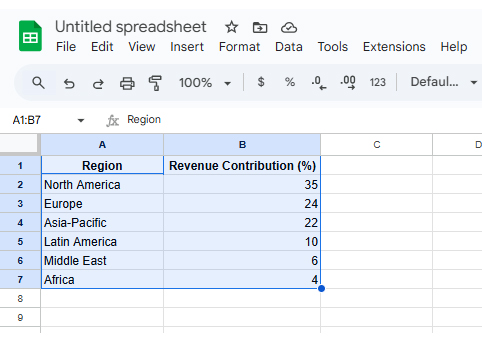
Highlight both columns, including headers, so Google Sheets correctly identifies labels and values.
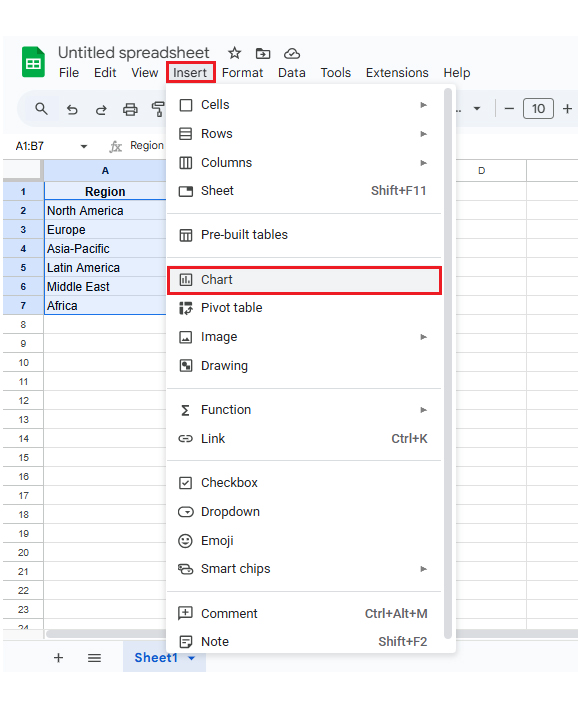
Click Insert → Chart. Google Sheets will automatically generate a default visualization.
In the Chart Editor panel, select Pie Chart as the chart type. Your data now displays as a Pie Chart in Google Sheets.
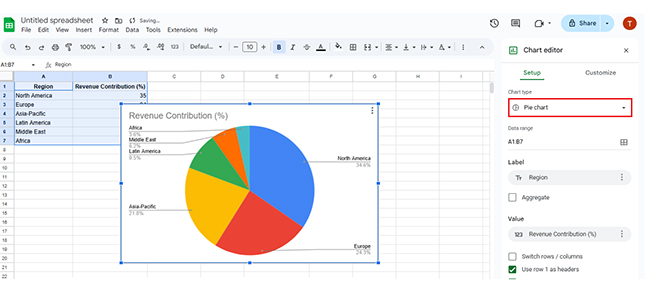
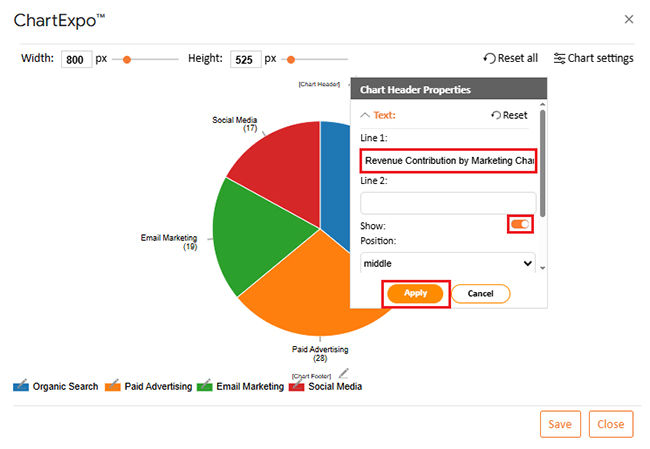
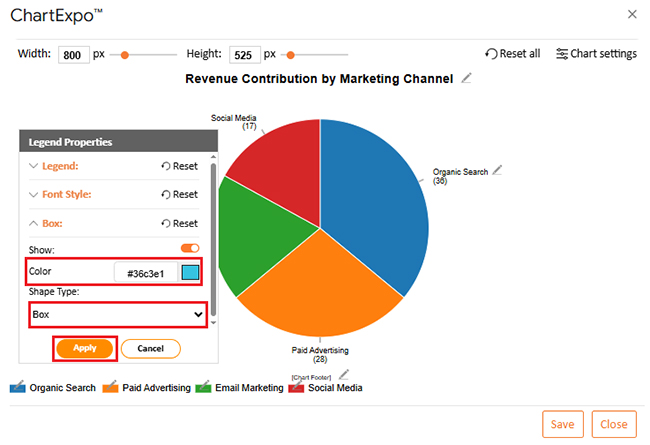
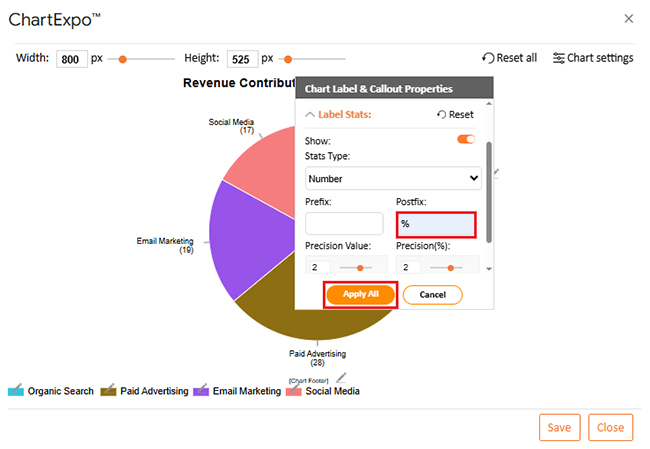
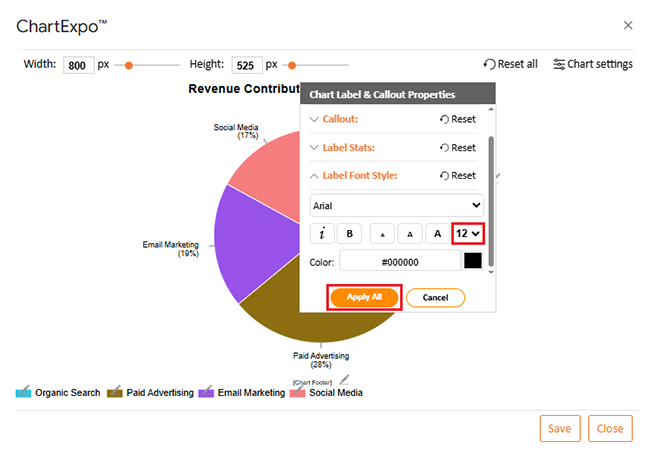
Adjust colors, labels, legends, and percentages to improve readability and presentation quality.
Native Google Sheets gets the job done for simple charts, but customization options hit a ceiling fast.
ChartExpo fills that gap with polished templates, better handling when slice sizes bunch together, and cleaner output for presentations.
It cuts down formatting time and makes your charts look professional without manual tweaking.
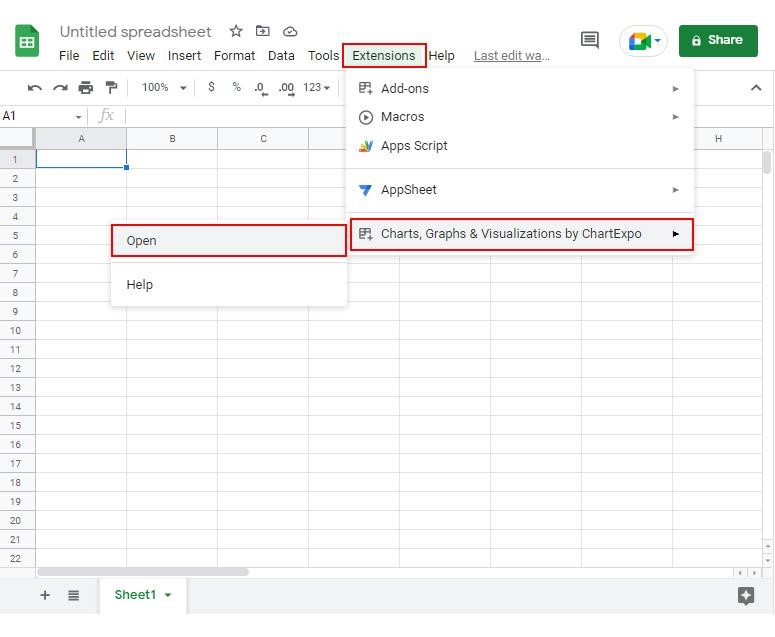
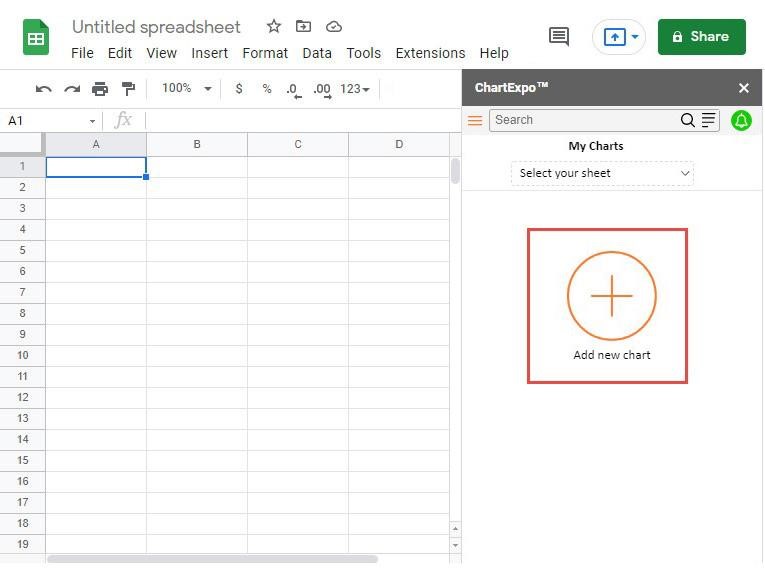
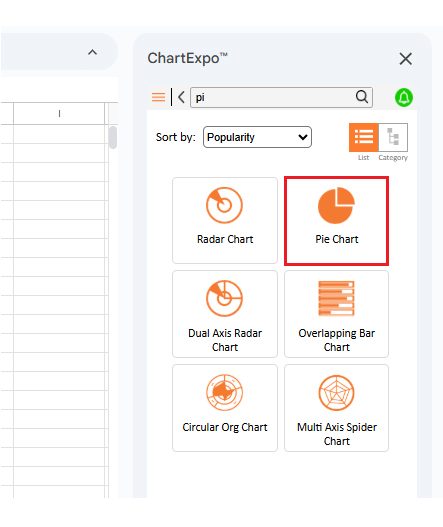
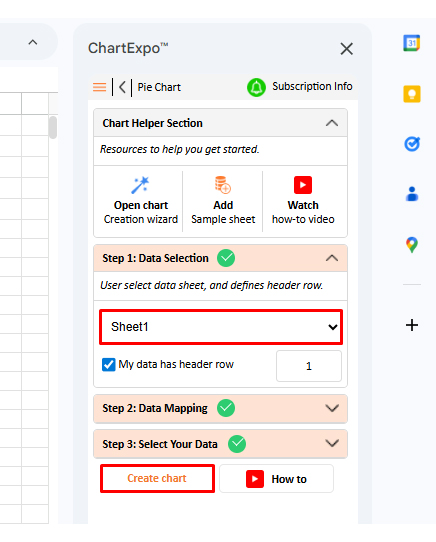
How to install ChartExpo in Google Sheets?
ChartExpo integrates with both Google Sheets and Microsoft Excel. Pick your platform, install the extension, and start building powerful Google Sheets Pie Chart visualizations in seconds.
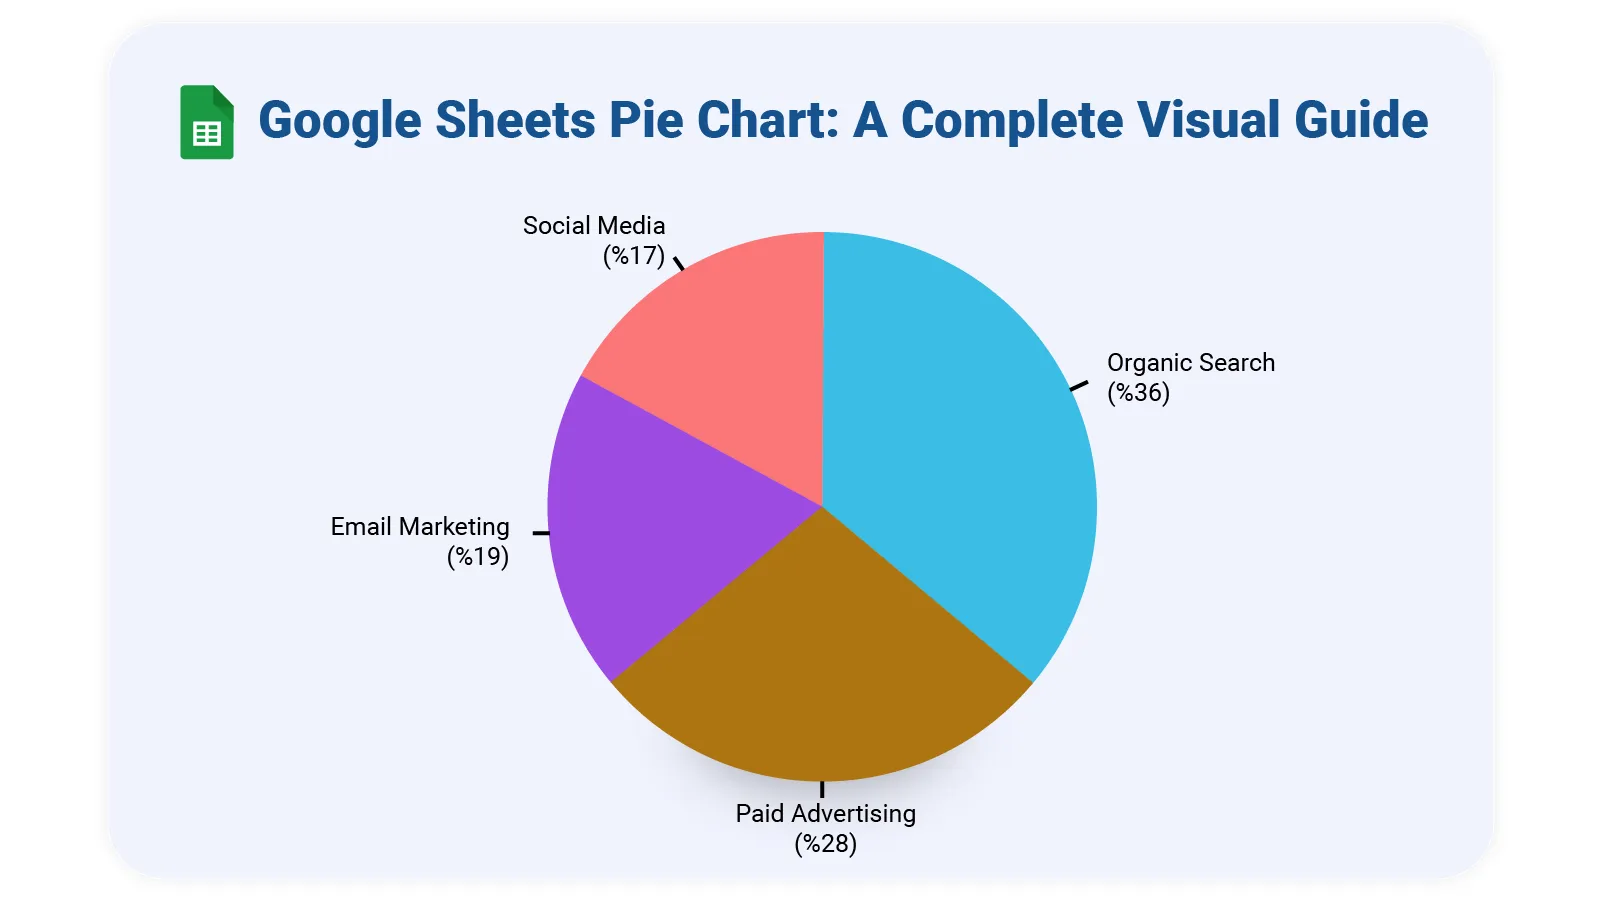
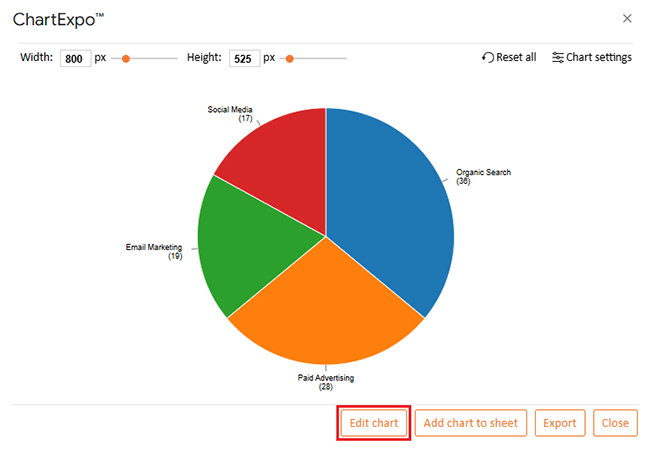
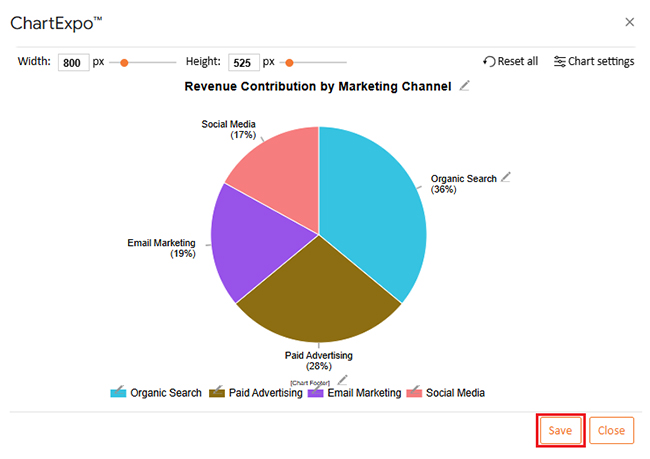
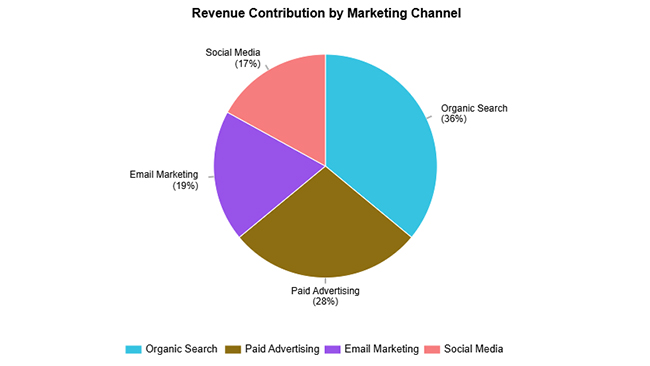
Here’s sample data for building a Google Sheets Pie Chart.
| Marketing Channel | Revenue Contribution (%) |
| Organic Search | 36 |
| Paid Advertising | 28 |
| Email Marketing | 19 |
| Social Media | 17 |
Native charts handle basics fine, but lock you into limited styling choices when you need deeper analysis. ChartExpo, a powerful Google Sheets extension, changes that by offering more control over how charts render and interpret.
With ChartExpo, you can:
ChartExpo hooks into spreadsheet workflows without disrupting what already works.
Building a clean, readable Google Sheets Pie Chart display means following these rules:
When tracking completion rates, a progress bar in Google Sheets delivers clearer insights than circular slices.
Even with their strengths, Google Sheets Pie Chart visualizations come with built-in trade-offs:
When these limits bite, switch to make a comparison chart in Google Sheets or layer in trend lines using forecasting in Google Sheets instead.
Set up your data with category names in column one and numbers in column two. Highlight both, hit Insert → Chart, and pick the pie option to create your Google Sheets Pie Chart.
Build two data points showing completed versus remaining work, then chart them as a pie. For advanced progress tracking, try add-ons like ChartExpo that offer more visual flexibility.
A Google Sheets Pie Chart excels at showing how individual parts relate to the whole picture. These charts build fast and read easily. Google Sheets functionality gets you started quickly, while extensions like ChartExpo polish things up when you need sharper visuals or tighter control over design elements.
Keep slice counts low in your Google Sheets Pie Chart, label everything clearly, and don’t shy away from percentages to aid interpretation. For datasets with many categories or values that change over time, consider switching to bar charts or Line Chart formats instead. Match the chart type to what you’re actually trying to show, and your audience will grasp it immediately.
How much did you enjoy this article?


SUMPRODUCT in Google Sheets handles multi-condition calculations without extra columns. Master its syntax, uses, and errors. Read on!

An annual budget template in Google Sheets organizes your yearly finances, tracks every dollar, and reveals spending patterns. Read on!

Learn the best graph to show profit and loss with practical examples and use cases. Discover how to visualize your business data, track trends, and make smarter financial decisions.


