Categories
Imagine a world where understanding opinions is not just a task but a confident exploration, made possible by the intuitive design and powerful insights brought forth by the Google Forms Likert Scale.


Your customers and audiences want you to know what they are thinking. They don’t expect you to read their mind, either. Instead, they expect you to engage them through feedback forms, surveys, questionnaires, etc.
Yet, many businesses fail to meet this expectation. The common reason is a misconception regarding how much effort it takes to conduct surveys. Companies assume that acquiring feedback and building surveys is a resource-intensive undertaking.
Thanks to Google Forms Likert Scale Surveys, it is not. The Google Forms using Likert Scale lets you make and send powerful surveys in minutes. Your response data appears automatically. It even includes charts to help you understand the results more easily.
Using the right tools and survey methods (i.e. Google Forms Likert Scale Surveys) holds remarkable advantages. Not only do you conduct professional surveys in less time, but you also receive more valuable data. This is thanks to the unique way Likert Scale Survey questions work.
This discussion will explore the benefits of Google Forms and Likert Scale Surveys. Additionally, we’ll look at the impact charts have on analyzing survey data. Data visualizations take your valuable Likert Scale Survey results to new levels.
Let’s take a look.
Definition: A Likert scale in Google Forms is a widely used type of rating scale that measures respondents’ attitudes or opinions on a set of statements.
There are many ways to create surveys using Google Forms. For instance, you can choose between closed or Open-Ended Questionnaires. Closed questions include things like multiple-choice responses, grids, and rating scales.
Likert Scale Survey using Google Forms is a type of rating scale. The design of the Likert Scale strives to remove subjectivity from responses.
Consider the following survey question:

How each person evaluates their score is different. Everyone has their own personal level of cleanliness that impacts how they score.
For instance, Participant A may have seen a spill and thus measured the cleanliness a 1. Participant B saw the same mess but rated much more positively at a 6.
The spill still impacted their score, keeping it from a 10, but they felt the store was clean overall.
Let’s look at a survey question using the Likert Scale:

Posing the question in this way removes this subjectivity. You’re assigning qualifiers to each position on the scale. The 5-point Likert scale design gives participants five types of answers:
This creates results data that is more accurate and quantifiable.
Here are some tips for you to create an effective Likert Scale in Google Forms
Google Forms is an online form creator. Most people consider it the Google survey maker because it creates feedback questionnaires.
You can use this free tool to make unlimited surveys, keeping costs as low as possible. Google Forms also assists in the sharing of surveys and collecting results.
Some of this assistance is entirely automated. For instance, as survey participants complete your questionnaires, Google Forms automatically adds the data to your results, including Net Promoter Score (NPS) metrics. This saves hours of having to tabulate results by hand.
Google Forms also saves time in building surveys themselves. It’s very easy to add new questions and remove or edit existing ones. It even helps you with how to structure the responses for each question.
Thanks to Google Forms, you can make free Likert Scale Surveys in a fraction of the time and at no cost!
All you need to get started with Google Forms is a free Google account. You may already have this account if you use other Google services, such as Gmail.
You can find Google Forms in the Apps menu on any Google page.

Another time-saving feature of Google Forms is the free survey templates offered. The Customer Feedback form gives you the framework of an effective audience survey you can start using.
Alternatively, you can start from scratch with a blank template.

As you build your Likert Scale Surveys, consider the different question types and settings at your disposal. Mixing Likert Scale Survey questions with other types can often be a good strategy.
This tactic will keep your questionnaire more engaging to audiences. Variation keeps them from getting bored!
You can also mix question types to give yourself more complete data. For example, you may want to follow your Google Forms Likert Scale Survey questions with open-ended ones. These feedback items allow the participant to explain their ratings in greater detail.
When your Likert Scale Survey is complete and ready for your target audience, click the purple “Send” button. It’s at the top of the page in the right corner.
You have a few options for how you want to share your Google Forms Likert Scale Survey.

You can send through your email mailing lists or share a direct link via social media and other channels.
You can check the status of your Google Forms Likert Scale Surveys using the “Responses” tab.
Here, you’ll see a basic breakdown of responses for every item in your Likert Scale Survey. This is a good start for analyzing the results. However, you’ll want to dig deeper into your Google Forms responses for more impactful audience insights.
Exporting your responses to Google Sheets is the first step in analyzing your results further. Google Forms makes it easy to convert the data into spreadsheet format. You only need to click the “Link to Sheets” option.

Google Forms will ask whether you want to use an existing spreadsheet or create a new one.
The next section will outline how to visualize the data once in Google Sheets to extract actionable insights.
Your Google Forms Likert Scale Survey data is now in spreadsheet format in Google Sheets. You can finally begin analyzing the results, right?
There’s one problem. You’re staring at a wall of numbers. Sure, it is neatly organized, but it isn’t exactly welcoming. Trying to analyze hundreds of rows of raw data is incredibly mind-numbing and tedious.
You’re more likely to walk away with a headache than any insights. The human brain isn’t equipped to analyze raw data in such large amounts. Unfortunately, big datasets are the most common type in the Digital Age.
So, how do you circumvent analyzing raw numbers? What’s the alternative? Charts!
Data visualization is the process of taking that overwhelming spreadsheet and visually depicting it with charts, graphs, and other diagrams.
This procedure puts data into a format that is more accessible. It’s also far easier on your eyes and brain.
One chart, including those for a 4-point Likert scale, can turn thousands of rows and columns into a simple, digestible visual. Thus, visual analysis is several thousand times faster and more effective. It makes effortless sense of the overwhelming wall of numbers, also known as your spreadsheet.
The 7-point Likert scale is one of the best options for survey data. It effectively depicts ratings clearly and comprehensively. You’ll gain faster insights that reveal the story behind the numbers, helping you respond appropriately to feedback.
How to Install ChartExpo in Google Sheets?
ChartExpo charts are available both in Google Sheets and Microsoft Excel. Please use the following CTA’s to install the tool of your choice and create beautiful visualizations in a few clicks in your favorite tool.


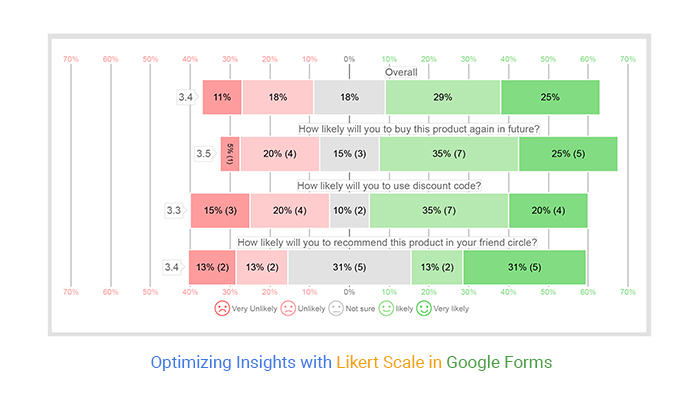
Suppose you get the following data from Google Forms:

You have to change this data in the following format:
| Questions | Scale | Responses |
| How likely will you to buy this product again in future? | 1 | 1 |
| How likely will you to buy this product again in future? | 2 | 4 |
| How likely will you to buy this product again in future? | 3 | 3 |
| How likely will you to buy this product again in future? | 4 | 7 |
| How likely will you to buy this product again in future? | 5 | 5 |
| How likely will you to use discount code? | 1 | 3 |
| How likely will you to use discount code? | 2 | 4 |
| How likely will you to use discount code? | 3 | 2 |
| How likely will you to use discount code? | 4 | 7 |
| How likely will you to use discount code? | 5 | 4 |
| How likely will you to recommend this product in your friend circle? | 1 | 2 |
| How likely will you to recommend this product in your friend circle? | 2 | 2 |
| How likely will you to recommend this product in your friend circle? | 3 | 5 |
| How likely will you to recommend this product in your friend circle? | 4 | 2 |
| How likely will you to recommend this product in your friend circle? | 5 | 5 |


In earlier sections of this discussion, we touched on some of the advantages of using Likert Scale Survey questions.
Here is a summary of these benefits.
Other rating scales only use numerical scores. The Likert Scale puts meaning behind each possible value.
Since Likert Scale Surveys produce both qualitative and quantitative data, your results are remarkably straightforward. It’s easy to draw accurate conclusions from your Google Forms Likert Scale responses!
Removing the subjective nature of typical rating scales benefits the survey participant. They don’t have to spend time considering what score to evaluate. Instead, they simply match their feelings to the appropriate response (satisfied, not satisfied, etc.).
The Likert Scale Chart allows you to visually analyze results from every rating scale item in your surveys. You’ll quickly identify topics creating largely positive or negative scores.
Survey participants don’t always have an opinion on what you’re asking. Many question types and rating scales create an either-or scenario.
People have to respond either positively or negatively. There is no middle ground. This creates inaccurate data. Luckily, Likert Scale Surveys don’t have this issue.
Adding a rating scale question to your Google Forms surveys is easy. When you add a new question, click the question-type dropdown menu.

Next, select the “Linear scale” option.

Google Forms does a good job of anticipating the type of question you’re asking. If you enter your question as “Rate our business on a scale of 1 to 5,” the tool should automatically change the question type to the linear scale.
You can add labels to any linear scale question in Google Forms. However, it only enables you to title either end of the scale. A true Likert Scale model labels every position on the spectrum.
To accomplish this in Google Forms, you’ll make a “Multiple choice grid” question instead. You can then name each position on your Likert Scale using the Columns labels.
You have two options to make a 5-point scale in Google Forms. The first is to change the question type to “Linear scale” manually. Then, set the values from 1-5.
A faster method is to type in your question first. Google Forms will typically understand the intent of the question and change the question type accordingly. Let’s say you enter “Rate our new product from 1 to 5” in the question field. The 5-point scale should appear automatically.
Google Forms is the best tool to make a free Likert Scale Survey. The online survey maker’s interface takes no time to learn. And, there are no paywalls or premium features. You can send unlimited Likert Scale Surveys for free!
The real benefit of Google Forms is how it handles your survey responses. Results appear instantly after a participant completes the survey. This gives you up-to-the-second customer feedback.
Google Forms does an excellent job of organizing your survey results. You can view data for every question or individual completed form. Plus, you can export the data to Google Sheets in two clicks.
Exporting your Google Forms Likert Scale Survey data is best for thoroughly analyzing the results. It will allow you to investigate the data at an even deeper level.
Do you want the absolute best audience and customer insights? Consider supercharging your analysis efforts with ChartExpo.
ChartExpo’s Likert Scale Chart will visually depict your survey results in an engaging, concise manner. You’ll be able to see otherwise hidden insights appear in front of your eyes.
With the Likert Scale Chart and Google Forms’ instant survey results, you have every tool you need to make positive changes for your business or organization!
How much did you enjoy this article?


Google Forms to Google Sheets keeps your data organized and current with every submission. Learn the steps, methods, and tips now!

Product survey questions reveal what customers truly think. Learn how to ask the right ones and act on the survey results. Read on!

Learn how the 5-Point Performance Rating Scale improves employee evaluations with clear, consistent, and fair performance reviews across teams.


