• Home
  • Tools dropdown img
    • Spreadsheet Charts

      • ChartExpo for Google Sheets
      • ChartExpo for Microsoft Excel
    • Power BI Charts

      • Power BI Custom Visuals by ChartExpo
    • Word Cloud

  • Charts dropdown img
    • Chart Category

      • Bar Charts
      • Circle Graphs
      • Column Charts
      • Combo Charts
      • Comparison Charts
      • Line Graphs
      • PPC Charts
      • Sentiment Analysis Charts
      • Survey Charts
    • Chart Type

      • Box and Whisker Plot
      • Clustered Bar Chart
      • Clustered Column Chart
      • Comparison Bar Chart
      • Control Chart
      • CSAT Survey Bar Chart
      • CSAT Survey Chart
      • Dot Plot Chart
      • Double Bar Graph
      • Funnel Chart
      • Gauge Chart
      • Likert Scale Chart
      • Matrix Chart
      • Multi Axis Line Chart
      • Overlapping Bar Chart
      • Pareto Chart
      • Radar Chart
      • Radial Bar Chart
      • Sankey Diagram
      • Scatter Plot Chart
      • Slope Chart
      • Sunburst Chart
      • Tornado Chart
      • Waterfall Chart
      • Word Cloud
    • Google Sheets
      Microsoft Excel
  • Services
  • Pricing
  • Contact us
  • Blog
  • Support dropdown img
      • Gallery
      • Videos
      • Contact us
      • FAQs
      • Resources
    • Please feel free to contact us

      atsupport@chartexpo.com

Categories
All Data Visualizations Data Analytics Surveys
Add-ons/
  • Google Sheets
  • Microsoft Excel
  • Power BI
All Data Visualizations Data Analytics Surveys
Add-ons
  • Google Sheets
  • Microsoft Excel
  • Power BI

We use cookies

This website uses cookies to provide better user experience and user's session management.
By continuing visiting this website you consent the use of these cookies.

Ok

ChartExpo Survey


Home > Blog > Surveys

Fun Survey Questions: Turn Responses into Insights

People answer more when the prompt feels human. Fun survey questions replace stiff wording with prompts that invite quick thought, small smiles, and honest replies.

Fun Survey Questions

That simple shift can keep attention high from the first item to the last, even when the topic feels routine, repetitive, or very dry.

A lighter tone can improve participation without weakening the purpose. It helps teams collect cleaner input, compare views, and reduce drop-off in forms, polls, and classroom tasks.

This guide shows how funny survey questions can support planning, writing, and review without turning the form into noise, clutter, or needless confusion today.

What are Fun Survey Questions?

Definition: Fun survey questions are engaging and conversational questions designed to make surveys enjoyable while still collecting meaningful data. Instead of sounding formal or rigid, these questions use humor, relatable scenarios, or simple choices to encourage participation.

They are commonly used in workplaces, classrooms, and online communities to increase response rates and make the survey experience feel less like a task and more like a conversation.

Why Use Fun Survey Questions?

Clear wording and play can lift response quality. Fun survey questions keep the form active, useful, and easier to complete from the start.

  • Raise response rate: Curiosity pulls people in and helps more participants begin the form.
  • Hold attention longer: Light prompts keep focus steady and make each item easier to answer.
  • Lower form fatigue: Variety reduces boredom, keeps pace moving, and limits mid-form drop-off.
  • Support honest replies: A relaxed tone can reduce guarded answers and invite more candor.
  • Create a good experience: People remember the process more positively and return with less friction.
  • Improve survey results: Strong interest helps more people finish every item.
  • Make collection easier: The task feels lighter, clearer, and less forced for both sides involved.

How to Create a Fun Survey?

Creating a fun survey makes responding enjoyable while still collecting useful insights. Follow these 5 simple steps to design a survey your audience will love.

Step 1: Define Your Goal

Start by clarifying why you’re creating the survey. Know what insights you want and who your audience is. A clear goal ensures your questions are focused, relevant, and engaging.

 Step 2: Choose the Right Questions

Mix different types of questions to keep it fun and dynamic:

  • Multiple-choice for quick answers
  • This-or-That or Would-You-Rather for playful options
  • Likert-scale for opinions or preferences
  • Short open-ended questions for creativity

Variety keeps respondents interested.

Step 3: Write Engaging Questions

Use clear, casual, and playful language. Keep questions short, relatable, and humorous when appropriate. Example:

“If you could have a superpower for a day, what would it be?”

Step 4: Add Visuals and Keep It Short

Include images, emojis, or progress bars to make the survey interactive. Limit your survey to 5–15 questions so it’s quick and fun to complete.

Step 5: Test, Share, and Analyze

Test the survey for clarity, share it across your channels, and analyze responses using tools like Google Sheets. Use visualizations such as a Likert Scale chart to present insights clearly.

Types of Fun Survey Questions

Using different types of questions keeps surveys dynamic and interesting.

Icebreaker Questions

  • What’s your favorite way to spend a free day?
  • Are you a morning person or a night owl?
  • What’s your favorite food of all time?

This-or-That Questions

  • Coffee or tea?
  • Movies or TV shows?
  • Summer or winter?

Would You Rather Questions

  • Would you rather travel the world or stay in one dream place forever?
  • Would you rather work four long days or five short days?

Funny Questions

  • If you were an animal, what would you be?
  • What’s your most unusual habit?
  • If you could have any superpower, what would it be?

Workplace Fun Questions

  • What motivates you most at work?
  • What’s your ideal work environment?
  • What’s one thing that makes your job enjoyable?

Top 100 Fun Survey Questions

Below is a carefully crafted, unique list of funny survey questions categorized for different use cases.

Icebreaker Questions

  • What’s your favorite way to relax after a busy day?
  • What hobby do you enjoy the most?
  • What’s your dream vacation destination?
  • What type of music do you listen to the most?
  • What’s your favorite season of the year?
  • What’s your favorite weekend activity?
  • Do you prefer staying in or going out?
  • What’s your favorite movie genre?
  • What’s your favorite comfort food?
  • What’s one thing you always carry with you?

Funny Questions

  • If you could switch lives with any fictional character, who would it be?
  • What’s the funniest thing that happened to you recently?
  • If animals could talk, which one would be the funniest?
  • What’s your most unusual talent?
  • If you were a fruit, which one would you be?
  • What’s your guilty pleasure TV show?
  • If you had a warning label, what would it say?
  • What’s the weirdest food combination you enjoy?
  • If you could invent a holiday, what would it be?
  • What’s the most random fact you know?

This-or-That Questions

  • Coffee or tea?
  • Pizza or burger?
  • Morning or night?
  • Beach or mountains?
  • Books or movies?
  • Texting or calling?
  • Sweet or salty?
  • Online shopping or in-store shopping?
  • Cats or dogs?
  • Music or podcasts?

Would You Rather Questions

  • Would you rather travel to space or explore the deep ocean?
  • Would you rather be able to fly or become invisible?
  • Would you rather always be early or always be late?
  • Would you rather give up your phone or your favorite food?
  • Would you rather live in the city or the countryside?
  • Would you rather have unlimited money or unlimited time?
  • Would you rather work remotely or in an office?
  • Would you rather be famous or anonymous?
  • Would you rather have a long vacation or shorter frequent breaks?
  • Would you rather learn a new language or a new skill?

Workplace Fun Questions

  • What motivates you to perform better at work?
  • What’s your ideal work schedule?
  • What’s one thing you enjoy about your job?
  • What’s the best part of your workday?
  • What helps you stay productive?
  • What’s your preferred communication style?
  • Do you prefer teamwork or working independently?
  • What’s one skill you want to improve?
  • What makes a workplace enjoyable for you?
  • What’s your biggest work-related goal?

Fun Survey Questionnaires Examples

Examples show how a lighter tone can guide responses.

1. Lifestyle and Daily Habits Survey Insights

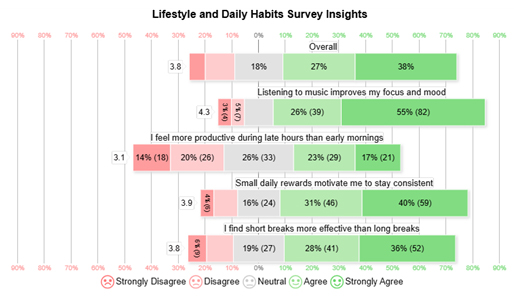
This example points to broad agreement around focus and rest. Many responses favor music during work and short breaks during the day, which suggests comfort with simple habits.

Fun Survey Questions

2. Workplace Preferences Survey Insights

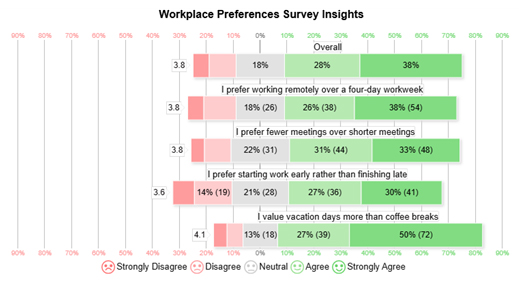
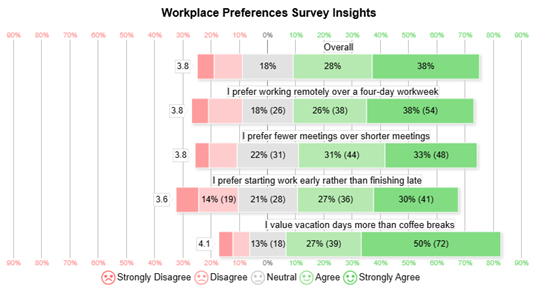
This example shows clear support for remote work, fewer meetings, and vacation time. Most selections gather in the Agree and Strongly Agree range, which signals steady alignment.

Fun Survey Questions

How to Analyze a Fun Survey Questionnaire in Google Sheets?

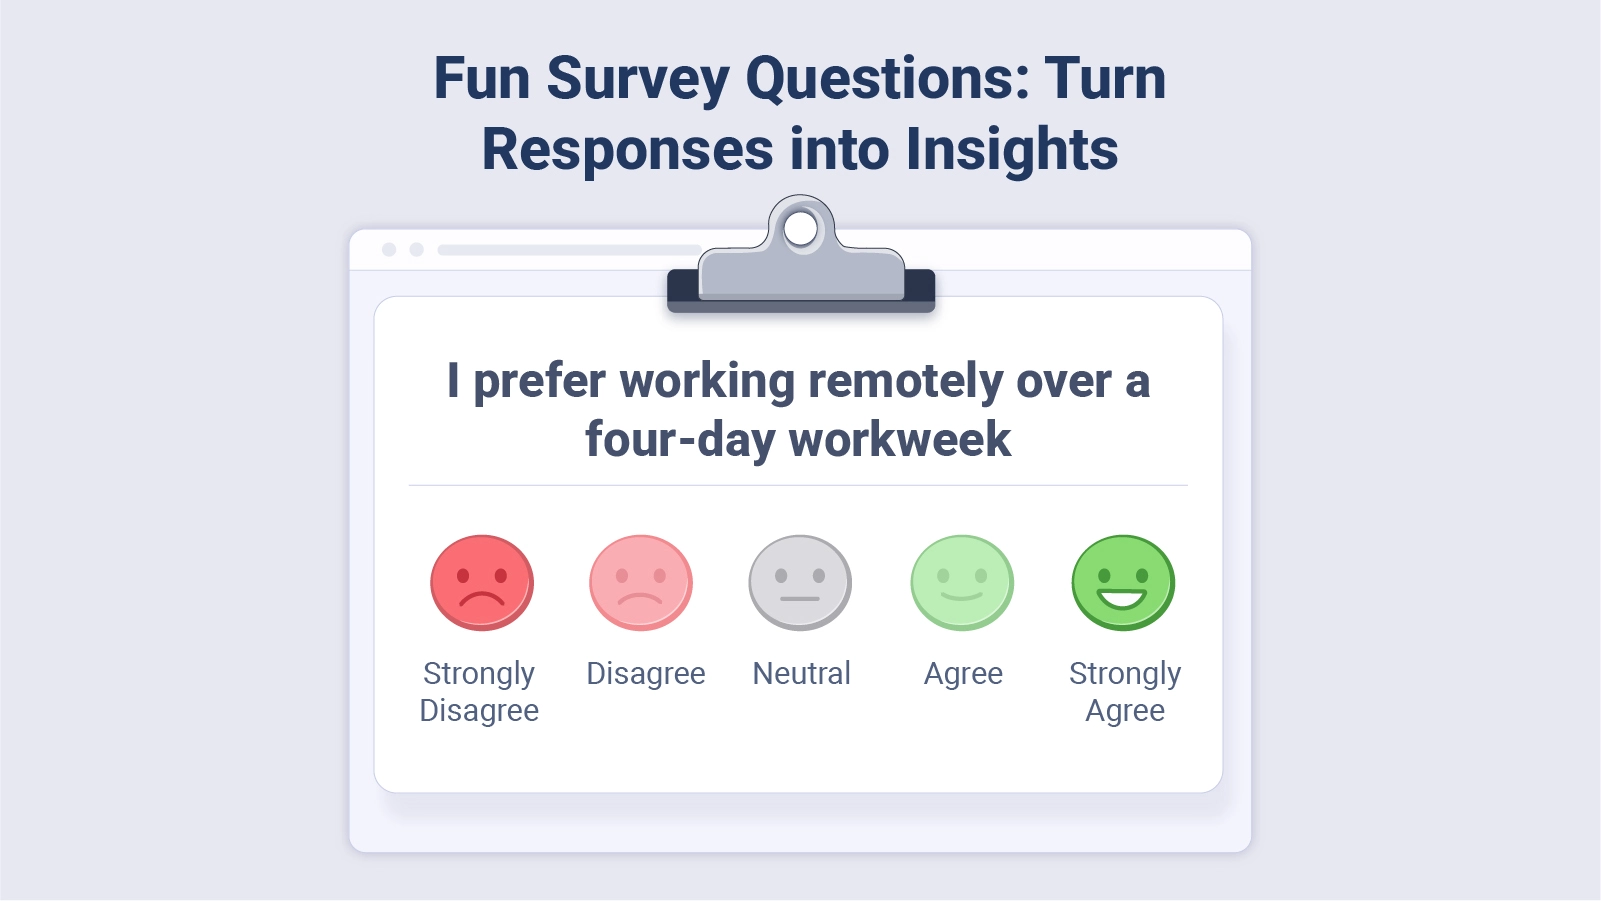
One of the best ways to analyze opinion-based survey questions is using a Likert Scale chart. Unlike regular bar charts, a Likert Scale chart is specifically designed to display gradations of agreement or disagreement for each statement, making it ideal for fun survey questionnaires, workplace preferences, or opinion polls.

A Likert Scale chart typically uses categories such as:

  • Strongly Disagree
  • Disagree
  • Neutral
  • Agree
  • Strongly Agree

Step 1: Organize Your Survey Responses

To prepare your data for a Likert Scale chart in Google Sheets:

  • Ensure each survey question has its own column.
  • Each respondent occupies a separate row.
  • Keep responses consistent by using standard categories (Strongly Disagree → Strongly Agree).
  • Group similar questions (fun, workplace, or preference-based) for easier analysis.

This structured format ensures that your Likert Scale chart is accurate and easy to interpret.

Step 2: Prepare the Data for Likert Scale Visualization

Even without numerical values, you can prepare the data conceptually for a Likert Scale chart:

  • Count the responses for each agreement category per question.
  • Structure the data so that each row represents a survey question and each column represents an agreement level.
  • This arrangement allows the chart to display the distribution of opinions for each question visually.

Step 3: Create the  Chart

A Likert Scale chart displays the proportion of responses across agreement levels for each question.

In Google Sheets:

  1. Use your summarized response table as the input.
  2. Insert a ChartExpo Likert Scale chart or a preformatted template if using Google Sheets default options.
  3. Apply distinct colors to each agreement level, for example:
    • Strongly Disagree → Red
    • Disagree → Light Red
    • Neutral → Gray
    • Agree → Light Green
    • Strongly Agree → Green

Step 4: Interpret the Likert Scale Chart

The chart allows you to see overall trends and opinions at a glance:

  • Statements with more agreement indicate strong positive sentiment.
  • Higher disagreement shows areas of concern or dissatisfaction.
  • Neutral responses highlight questions where respondents are uncertain.
  • Comparing multiple questions shows differences in sentiment between topics.

Step 5: Use Insights to Take Action

Once the chart is created:

  • Identify the questions that show strong agreement or disagreement.
  • Use insights to improve policies, engagement strategies, or survey design.
  • Share the chart visually with stakeholders to communicate sentiment clearly.

Step 6: Final Fun Survey Result

Fun Survey Questions

Key Insights

  • Most responses cluster on the agreement side, pointing to broad positive sentiment.
  • Remote work stands out as the clearest overall preference.
  • Vacation days earn more support than coffee breaks.

Benefits of Using Fun Survey Questions

Silly survey questions can improve outcomes beyond participation alone.

  • Lift participation rates: Better interest supports completion in any longitudinal survey and helps reduce attrition.
  • Raise answer quality: Relaxed participants often share fuller and more thoughtful responses.
  • Build audience connection: Playful wording can make the exchange feel more human.
  • Support brand trust: A pleasant process leaves a better final impression.
  • Ease pattern review: Cleaner answers make trends easier to spot.
  • Increase time on task: People stay engaged longer and interact more throughout the form.

Tips for Creating Fun Poll Questions Strategy

A workable plan needs structure and restraint.

  • Keep items short: Brief wording reduces confusion and helps people answer without delay or hesitation.
  • Use familiar topics: Known themes make each prompt easier to grasp, judge, and answer confidently.
  • Skip sensitive areas: Avoiding discomfort helps preserve trust, comfort, and honest participation throughout.
  • Mix formats: Variety keeps the pace active and prevents monotony over time.
  • Stay positive: Friendly language supports effort, ease, trust, and cleaner answers.
  • Test before launch: A trial run can reveal weak wording, errors, gaps, or missed instructions.

FAQs

How do fun questions improve surveys?

Fun questions make surveys more engaging by turning them into a conversational and enjoyable experience. They reduce boredom and increase completion rates, leading to more reliable responses. They also encourage honest answers by helping respondents feel relaxed and comfortable.

Where can they be used?

They fit employee feedback, class activities, customer polls, team check-ins, and community outreach. They work best when attention is limited, and the form needs steady completion across many groups, settings, and time frames.

What makes good funny survey questions?

Good, funny survey questions are simple, relatable, and engaging. They use clear language, feel conversational, and often include playful or creative options. Most importantly, they keep respondents interested while still serving the purpose of the survey.

Wrap Up

Fun survey questions work best when they feel playful but still serve a clear goal. The strongest versions use simple wording, fit the audience, and make it easier for people to finish the form with useful, honest input. That balance protects both tone and purpose in every setting.

When the wording matches the setting, participation rises, and review becomes easier. A smart mix of short prompts, clear choices, and hilarious survey questions can keep attention high while still producing answers you can sort, compare, and use with confidence. That makes the final data easier to trust and easier to act on.

How much did you enjoy this article?

ExcelAd1
Start Free Trial!
160322

Related articles

next previous
Surveys10 min read

How to Connect Google Forms to Google Sheets?

Google Forms to Google Sheets keeps your data organized and current with every submission. Learn the steps, methods, and tips now!

Surveys8 min read

Product Survey Questions: Product Survey Made Visual

Product survey questions reveal what customers truly think. Learn how to ask the right ones and act on the survey results. Read on!

Surveys11 min read

5-Point Performance Rating Scale With Examples:Quick Guide

Learn how the 5-Point Performance Rating Scale improves employee evaluations with clear, consistent, and fair performance reviews across teams.

Surveys8 min read

How to Interpret 4-Point Likert Scale Results?

Learn how to create, collect, and analyze data using a 4-point Likert scale. A complete guide with definition, examples, advantages, and practical applications.

Surveys11 min read

5 Point Likert Scale: Analysis, Interpretation and Examples

Learn how to analyze and interpret a 5-point Likert scale with examples, charts, and step-by-step methods to turn survey responses into actionable insights.

ChartExpo logo

Turn Data into Visual
Stories

CHARTEXPO

  • Home
  • Gallery
  • Videos
  • Services
  • Pricing
  • Contact us
  • FAQs
  • Privacy policy
  • Terms of Service
  • Sitemap

TOOLS

  • ChartExpo for Google Sheets
  • ChartExpo for Microsoft Excel
  • Power BI Custom Visuals by ChartExpo
  • Word Cloud

CATEGORIES

  • Bar Charts
  • Circle Graphs
  • Column Charts
  • Combo Charts
  • Comparison Charts
  • Line Graphs
  • PPC Charts
  • Sentiment Analysis Charts
  • Survey Charts

TOP CHARTS

  • Sankey Diagram
  • Likert Scale Chart
  • Comparison Bar Chart
  • Pareto Chart
  • Funnel Chart
  • Gauge Chart
  • Radar Chart
  • Radial Bar Chart
  • Sunburst Chart
  • see more
  • Scatter Plot Chart
  • CSAT Survey Bar Chart
  • CSAT Survey Chart
  • Dot Plot Chart
  • Double Bar Graph
  • Matrix Chart
  • Multi Axis Line Chart
  • Overlapping Bar Chart
  • Control Chart
  • Slope Chart
  • Clustered Bar Chart
  • Clustered Column Chart
  • Box and Whisker Plot
  • Tornado Chart
  • Waterfall Chart
  • Word Cloud
  • see less

RESOURCES

  • Blog
  • Resources
  • YouTube
SIGN UP FOR UPDATES

We wouldn't dream of spamming you or selling your info.

© 2026 ChartExpo, all rights reserved.