• Home
  • Tools dropdown img
    • Spreadsheet Charts

      • ChartExpo for Google Sheets
      • ChartExpo for Microsoft Excel
    • Power BI Charts

      • Power BI Custom Visuals by ChartExpo
    • Word Cloud

  • Charts dropdown img
    • Chart Category

      • Bar Charts
      • Circle Graphs
      • Column Charts
      • Combo Charts
      • Comparison Charts
      • Line Graphs
      • PPC Charts
      • Sentiment Analysis Charts
      • Survey Charts
    • Chart Type

      • Box and Whisker Plot
      • Clustered Bar Chart
      • Clustered Column Chart
      • Comparison Bar Chart
      • Control Chart
      • CSAT Survey Bar Chart
      • CSAT Survey Chart
      • Dot Plot Chart
      • Double Bar Graph
      • Funnel Chart
      • Gauge Chart
      • Likert Scale Chart
      • Matrix Chart
      • Multi Axis Line Chart
      • Overlapping Bar Chart
      • Pareto Chart
      • Radar Chart
      • Radial Bar Chart
      • Sankey Diagram
      • Scatter Plot Chart
      • Slope Chart
      • Sunburst Chart
      • Tornado Chart
      • Waterfall Chart
      • Word Cloud
    • Google Sheets
      Microsoft Excel
  • Services
  • Pricing
  • Contact us
  • Blog
  • Support dropdown img
      • Gallery
      • Videos
      • Contact us
      • FAQs
      • Resources
    • Please feel free to contact us

      atsupport@chartexpo.com

Categories
All Data Visualizations Data Analytics Surveys
Add-ons/
  • Google Sheets
  • Microsoft Excel
  • Power BI
All Data Visualizations Data Analytics Surveys
Add-ons
  • Google Sheets
  • Microsoft Excel
  • Power BI

We use cookies

This website uses cookies to provide better user experience and user's session management.
By continuing visiting this website you consent the use of these cookies.

Ok

ChartExpo Survey


Home > Blog > Data Analytics

Cyber Security Key Performance Indicators: Quick Wins

Cybersecurity key performance indicators drive data-driven decision-making. They measure defenses, detect weaknesses, and guide strategic actions. Companies that track these metrics reduce breach costs by proving their impact.

Cyber threats affect more than finances. Breaches damage reputations, erode trust, and lead to legal issues. Strong security metrics prevent financial loss and protect brand credibility.

Cybersecurity key performance indicators

A digital dashboard simplifies security monitoring. It visualizes key metrics, helping teams detect threats faster. Tracking intrusion attempts, response times, and patching rates ensures proactive protection.

Understanding security trends requires comparing data effectively. The table vs. charts approach matters when analyzing login failures, firewall effectiveness, and compliance rates. Charts highlight patterns, while tables provide detailed records.

This blog will show you how to track meaningful indicators and strengthen defenses. Organizations that invest in cybersecurity metrics reduce risks, safeguard data, and ensure long-term resilience. It’s all about preparation, awareness, and continuous improvement.

Let’s dive in…

Table of Contents:

  1. What Are Cybersecurity KPIs & Metrics?
  2. What Are Information Security Metrics?
  3. Why Are Cyber Security Key Performance Indicators Important?
  4. Top 15 Cybersecurity KPI Examples
  5. How to Analyze Cybersecurity KPIs in Excel?
  6. Benefits of Cyber Security KPI Dashboards
  7. How to Choose the Right Cybersecurity Metrics or KPIs?
  8. Tips for Tacking Cyber Security Key Performance Indicators
  9. FAQs
  10. Wrap Up

What Are Cybersecurity KPIs & Metrics?

Definition: Cybersecurity KPIs and metrics are measurable values that track the effectiveness of security efforts. They include incident response times, vulnerability remediation rates, and phishing test results. These indicators help organizations identify strengths and weaknesses in their defenses.

Analyzing and interpreting data from these metrics reveals security gaps. Metrics like mean time to detect and mean time to respond (MTTR) highlight operational efficiency. Understanding these numbers helps businesses refine strategies and enhance protection.

By monitoring these KPIs, businesses can prioritize actions, reduce risks, and improve overall security. They turn abstract security goals into clear, actionable insights.

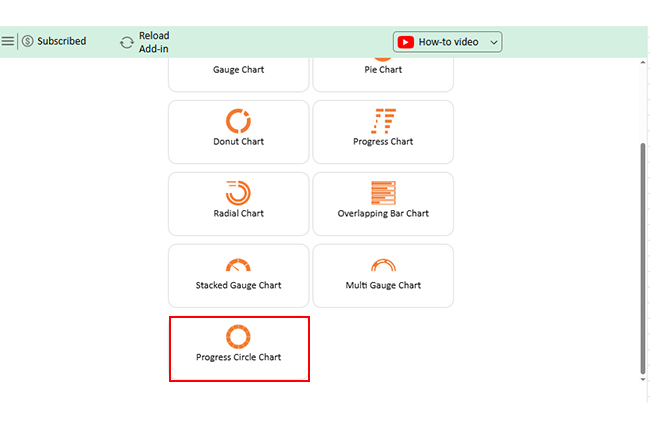
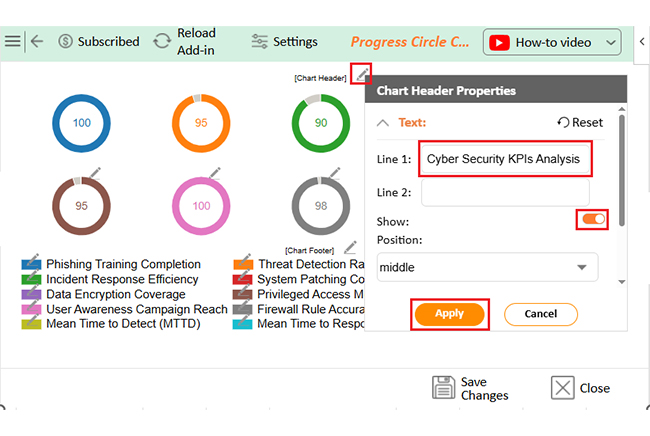
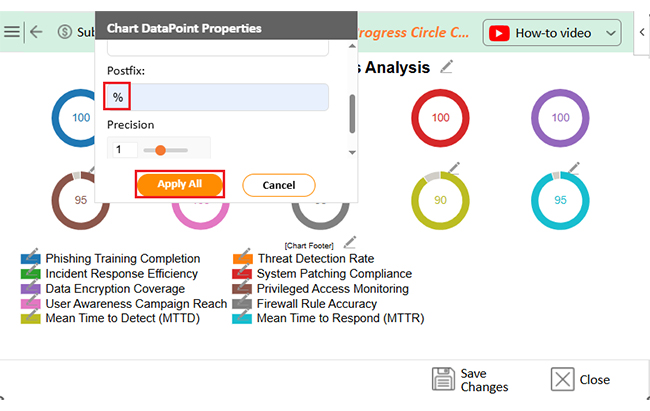
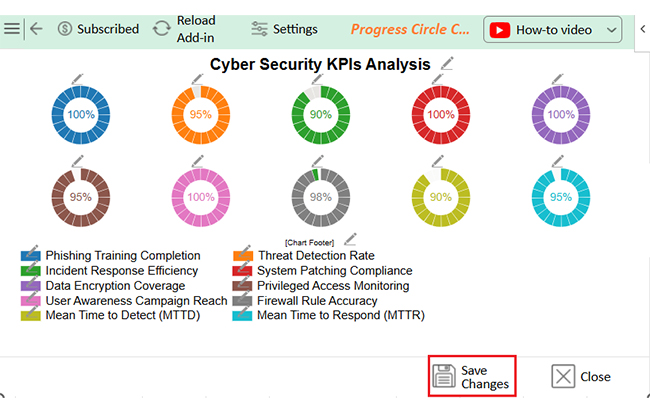
Learn to Design a Progress Circle Chart in Microsoft Excel for Cybersecurity KPIs

Learn to Design a Progress Circle Chart in Google Sheets for Cybersecurity KPIs

What Are Information Security Metrics?

Think of them as your security team’s report card. They measure how well your defenses are working. Data discovery tools help identify sensitive information, making it easier to protect. KPIs and KRIs track performance and highlight areas needing improvement. Let’s break them down.

  • Performance monitoring: These metrics track how efficiently your security systems operate. They measure response times and detection rates to identify areas for improvement.
  • Risk assessment: These metrics highlight vulnerabilities in your defenses. They help prioritize actions to reduce potential threats.
  • Compliance tracking: The metrics ensure adherence to industry regulations, avoid penalties and build stakeholder trust.
  • Decision support: These metrics provide data to guide strategic decisions. They help allocate resources effectively for stronger security.

Why Are Cyber Security Key Performance Indicators Important?

Cyber security Key Performance Indicators (KPIs) provide the clarity needed to protect your organization effectively. By leveraging business analytics, you can gain deeper insights into security trends. This helps make data-driven decisions to improve your defenses. Here’s why they matter.

  • Monitoring security performance: KPIs measure how well your security systems function. They identify strengths and weaknesses, allowing you to enhance performance.
  • Identifying vulnerabilities and risks: KPIs identify weaknesses in your defenses. By detecting risks early, you can resolve them before they lead to breaches.
  • Data-driven decision-making: It turns raw data into actionable insights, guides strategic choices, and ensures the effective use of resources.
  • Ensuring regulatory compliance: These KPIs help you meet industry standards and avoid penalties. They provide proof that your organization follows necessary regulations.
  • Demonstrating security value to stakeholders: KPIs show the effectiveness of your security efforts. It builds trust by proving your commitment to protecting sensitive data.
  • Continuous improvement: They create a feedback loop for ongoing enhancement to help you adapt to new threats and stay ahead of attackers.

Top 15 Cybersecurity KPI Examples

Cybersecurity Key Performance Indicators (KPIs) are essential for tracking your organization’s ability to defend against cyber threats. These metrics help you understand how well your security measures are performing and where improvements are needed. Here are the top 15 KPIs that will help guide your cybersecurity strategy.

  1. Number of Detected Threats: This measures the volume of threats your security system identifies. It can help indicate if you’re under attack or if your detection systems are working effectively.
  2. Mean Time to Detect (MTTD): The faster you can detect a threat, the quicker you can respond. This metric tracks how long it typically takes to spot an incident.
  3. Mean Time to Respond (MTTR): How quickly can your team neutralize a threat once detected? MTTR measures the average response time.
  4. Incident Response Success Rate: This tells you how often your response protocols successfully neutralize threats. It’s crucial for gauging your team’s effectiveness.
  5. Phishing Attack Success Rate: How often are phishing attempts successful? This metric helps measure your organization’s vulnerability to social engineering tactics.
  6. Number of Security Incidents: The raw number of security events or breaches within a set period. It can be a clear indicator of overall security performance.
  7. Percentage of Systems with Updated Patches: Keeping systems updated is critical. This metric tracks the number of your systems that are current with their security patches.
  8. User Awareness Training Completion Rate: Your employees play a significant role in cybersecurity. This KPI tracks the number of employees who have completed mandatory security training.
  9. Number of Unauthorized Access Attempts: Measuring unauthorized access attempts can help you understand potential vulnerabilities and how often your defenses are being tested.
  10. Loss Events: This metric tracks the number of incidents resulting in data loss, financial loss, or operational disruption. Minimizing these events is key to protecting your organization.
  11. Compliance Rate with Security Policies: How well does your organization adhere to established security policies? This metric helps ensure consistent security across the board.
  12. Percentage of Encrypted Data: Data encryption is vital for protecting sensitive information. This KPI tracks how much of your data is adequately encrypted.
  13. Firewall Rule Changes Success Rate: This metric monitors how often changes to firewall rules are successful and don’t unintentionally open new vulnerabilities.
  14. The false positive rate in threat detection: False positives can be as damaging as missed threats. This metric helps ensure your detection system isn’t generating too many unnecessary alerts.
  15. Third-party vendor risk assessments: Third-party vendors can pose significant risks. This tracking tool measures how well you evaluate and manage the security risks they introduce.

How to Analyze Cybersecurity KPIs in Excel?

Why are cybersecurity Key Performance Indicators (KPIs) important? Because guessing your security posture is like playing darts blindfolded—risky and ineffective. KPIs give you clear metrics to measure success and spot vulnerabilities.

But here’s the catch: data is only as good as how you visualize it. Excel? It’s excellent for grids but falls flat when turning numbers into actionable insights. Enter ChartExpo, the superhero of data visualizations. It transforms your dull Excel sheets into vibrant, easy-to-read charts and graphs.

Ready to make your cybersecurity data not just informative but visually stunning? Install ChartExpo!

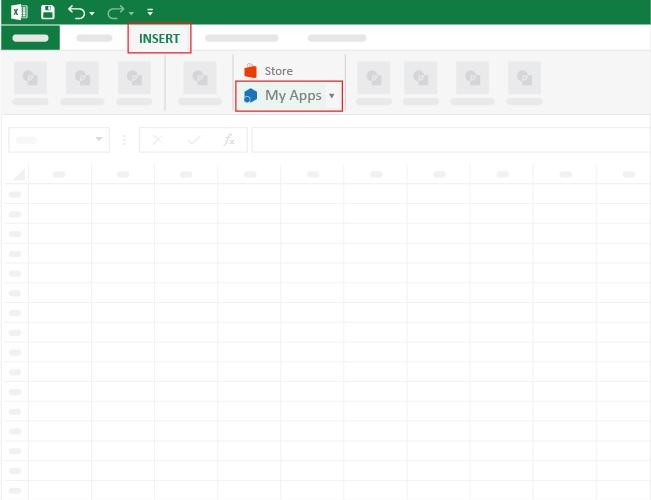
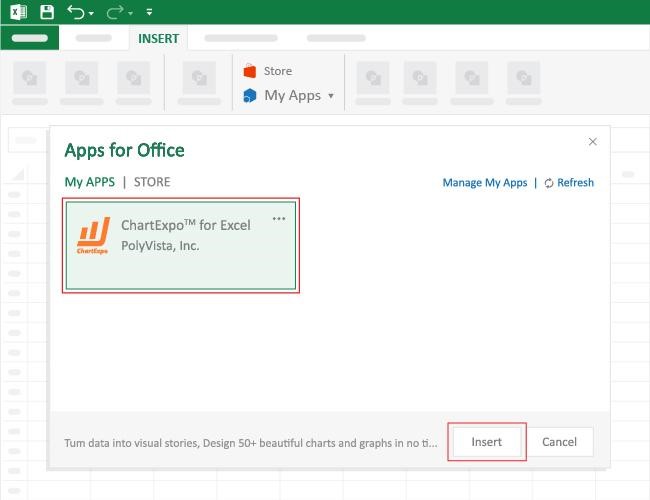
How to Install ChartExpo in Excel?

  1. Open your Excel application.
  2. Open the worksheet and click the “Insert” menu.
  3. You’ll see the “My Apps” option.
  4. In the Office Add-ins window, click “Store” and search for ChartExpo on my Apps Store.
  5. Click the “Add” button to install ChartExpo in your Excel.

ChartExpo charts are available both in Google Sheets and Microsoft Excel. Please use the following CTAs to install the tool of your choice and create beautiful visualizations with a few clicks in your favorite tool.

Example

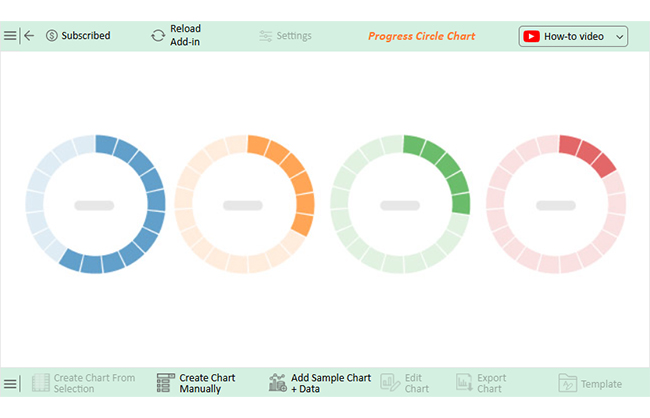
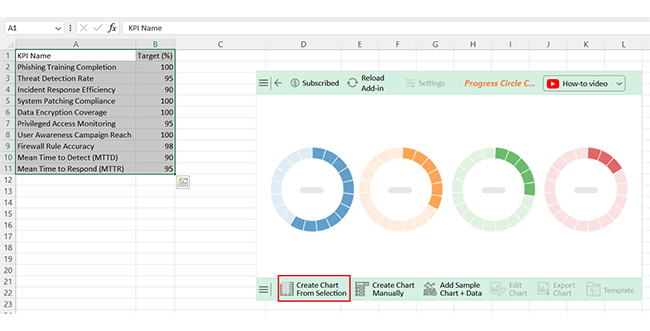
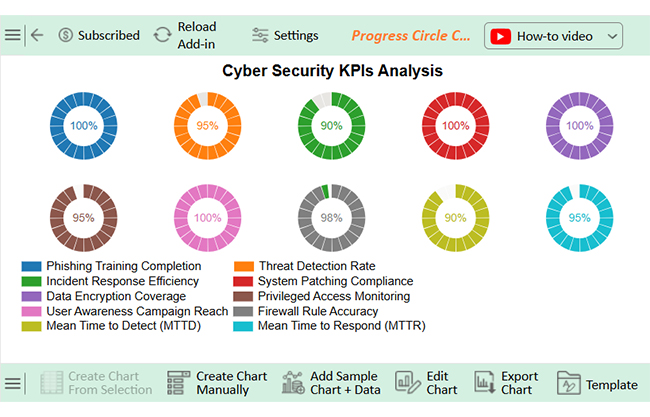
Let’s analyze the KPIs for cyber security sample data below using ChartExpo.

KPI Name Target (%)
Phishing Training Completion 100
Threat Detection Rate 95
Incident Response Efficiency 90
System Patching Compliance 100
Data Encryption Coverage 100
Privileged Access Monitoring 95
User Awareness Campaign Reach 100
Firewall Rule Accuracy 98
Mean Time to Detect (MTTD) 90
Mean Time to Respond (MTTR) 95
  • To get started with ChartExpo, install ChartExpo in Excel.
  • Now Click on My Apps from the INSERT menu.
Cybersecurity key performance indicators
  • Choose ChartExpo from My Apps, then click Insert.
Cybersecurity key performance indicators
  • Once it loads, scroll through the charts list to locate and choose the “Progress Circle Chart”.
Cybersecurity key performance indicators
  • The Progress Circle Chart will appear as below.
Cybersecurity key performance indicators
  • Click the “Create Chart From Selection” button after selecting the data from the sheet, as shown.
Cybersecurity key performance indicators
  • You can change the Data Representation as follows:
Cybersecurity key performance indicators
  • ChartExpo will generate the visualization below for you.
Cybersecurity key performance indicators
  • If you want to add anything to the chart, click the Edit Chart button:
  • Click the pencil icon next to the Chart Header to change the title.
  • It will open the properties dialog. Under the Text section, you can add a heading in Line 1 and enable Show.
  • Give the appropriate title of your chart and click the Apply button.
Cybersecurity key performance indicators
  • You can add the (%) with all values:
Cybersecurity key performance indicators
  • Click the “Save Changes” button to persist the changes made to the chart.
Cybersecurity key performance indicators
  • Your final Progress Circle Chart will look like the one below.
Cybersecurity key performance indicators

Insights

High-Security Targets:
  • Complete phishing training for all employees
  • Perform regular system patching to maintain security
  • Ensure data encryption for sensitive information
Key Focus Areas:
  • Improve privileged access monitoring
  • Enhance incident response efficiency for a more assertive cybersecurity posture and resilience

Benefits of Cyber Security KPI Dashboards

Cyber threats don’t wait, and neither should your security strategy. It keeps you ahead with real-time insights and more intelligent decision-making. By incorporating visual analytics, you can easily interpret data and spot potential risks faster.

Here’s why cyber security KPI dashboards are essential:

  • Instant visibility: Real-time monitoring provides immediate insight into security events. Detecting threats allows teams to act before they escalate into serious breaches.
  • Smarter decisions: Data-driven insights help security teams focus on the most pressing risks. Clear metrics ensure that resources are allocated effectively to strengthen the defense.
  • Faster incident response: Quick access to security data speeds up threat investigation and resolution. Reducing response time minimizes damage and operational disruptions.
  • Compliance made easy: Tracking security KPIs ensures organizations meet industry regulations and legal requirements. A well-maintained dashboard helps prevent compliance violations and costly penalties.
  • Continuous improvement: Cyber threats constantly evolve, requiring security strategies to adapt. Regular performance evaluations help refine policies, improve defenses, and enhance resilience.

How to Choose the Right Cybersecurity Metrics or KPIs?

Choosing the right cybersecurity metrics or KPIs can make or break your security strategy. Tracking the wrong data leads to information overload, making it harder to focus on critical threats. The right metrics drive real protection and improve overall security efficiency.

Here’s how to pick KPIs that truly matter.

  • Align with business priorities: Cybersecurity isn’t just an IT issue but a business necessity. KPIs should protect assets, maintain uptime, and minimize financial risks.
  • Focus on threats that matter: To prevent major breaches, prioritize metrics highlighting critical vulnerabilities and emerging risks.
  • Measure what drives action: A KPI should provide insights that lead to real security improvements. Tracking data that doesn’t influence decision-making wastes time and resources.
  • Stay compliant: Regulatory fines and legal consequences can be severe. Choosing KPIs that align with industry standards ensures ongoing compliance and avoids penalties.
  • Keep it clear and evolving: Use relevant metrics and adjust them as threats and business priorities change.

Tips for Tacking Cyber Security Key Performance Indicators

Tracking cyber security Key Performance Indicators shouldn’t be a guessing game. Clear, actionable metrics, backed by strong information design, simplify understanding and decision-making with security data. Follow these tips to keep your defenses strong and your strategy sharp.

  • Set clear goals: Every KPI should serve a specific purpose. Defining clear objectives ensures your security efforts align with real risks and business needs.
  • Focus on relevant metrics: Tracking too many metrics creates noise. Prioritize KPIs that reflect key vulnerabilities, compliance requirements, and overall security performance.
  • Automate where possible: Manual tracking wastes time and increases errors. Automating data collection ensures accuracy, speeds up analysis, and provides real-time insights.
  • Monitor trends, not just numbers: One-time data points can be misleading. Observing patterns over time helps spot vulnerabilities, assess improvements, and predict future risks.
  • Continuously improve: Cyber threats constantly change – static KPIs won’t cut it. Regularly reviewing and adjusting metrics keeps your cybersecurity strategy effective.

FAQs

What are KPIs and KRIs in cyber security?

KPIs (Key Performance Indicators) measure how well security objectives are being achieved. Examples include response time and patch compliance. Conversely, KRIs (Key Risk Indicators) identify potential risks to security. It helps predict issues before they become significant threats.

What are the KPIs for a security officer?

The KPIs for a security officer measure their effectiveness in safeguarding assets. They include incident response times, threat detection rates, and compliance with security protocols. Training completion and audit results also reflect performance. These metrics ensure proactive and efficient security management.

What should be on a KPI dashboard?

A KPI dashboard should include metrics like threat detection rates, response times, patch compliance, and incident success rates. It should display real-time data, trends, and alerts. Visuals like graphs and charts help make the data easily understandable and actionable.

Wrap Up

Cybersecurity Key Performance Indicators are essential for maintaining strong defenses. They provide measurable insights into security performance. Without them, risks go unnoticed, and threats escalate. Tracking the right KPIs ensures proactive threat management and data protection.

Understanding metrics vs. KPIs is key to effective cybersecurity. Metrics measure specific activities, while KPIs track overall security performance. Combining both helps teams focus on the most critical security gaps and make informed decisions.

The best-designed dashboards turn complex data into clear, actionable insights. A well-structured dashboard allows teams to visualize risks, monitor trends, and respond to threats efficiently. Effective dashboards improve situational awareness and decision-making.

Using a chart maker enhances security reporting. It transforms raw data into graphs and reports, making it easier to analyze trends. Visualizing KPIs helps stakeholders grasp security performance at a glance and justify cybersecurity investments.

Cyber threats are constantly changing, and security strategies must keep up. Consistently evaluating KPIs drives ongoing improvements. Companies focusing on strong cybersecurity metrics strengthen their defenses and ensure lasting protection.

Install ChartExpo to enhance the data visualization of your cybersecurity KPIs.

How much did you enjoy this article?

GSAd1
Start Free Trial!
149544

Related articles

next previous
Data Analytics31 min read

Data Analysis Without Nonsense: Fix the Right Problem, Fast

Data analysis can mislead when metrics look right but outcomes fail. Learn how to spot red flags, fix failures, and make better decisions. Read on!

Data Analytics29 min read

Variance Analysis Isn’t a Math Problem, It’s a Trust Problem

Variance analysis helps identify what went wrong, who owns it, and what to do next. Use it to drive decisions, not just reports. Learn more!

Data Analytics10 min read

Supplier Comparison Template: Download It Now

A supplier comparison template streamlines vendor evaluation by comparing cost and quality. Click here to learn its benefits and how to analyze them.

Data Analytics32 min read

Ecommerce Analytics: How to Fix What It Often Gets Wrong

Ecommerce analytics often lead to mixed signals and costly misreads. Fix attribution gaps, align teams, and act on the right data. Get started now!

Data Analytics30 min read

When Sales Funnel Breaks: Failures, Fixes, & Funnel Debt

Is your sales funnel hiding costly gaps? Learn how pipeline stalls, false metrics, and handoff chaos could be draining revenue. Get started now!

ChartExpo logo

Turn Data into Visual
Stories

CHARTEXPO

  • Home
  • Gallery
  • Videos
  • Services
  • Pricing
  • Contact us
  • FAQs
  • Privacy policy
  • Terms of Service
  • Sitemap

TOOLS

  • ChartExpo for Google Sheets
  • ChartExpo for Microsoft Excel
  • Power BI Custom Visuals by ChartExpo
  • Word Cloud

CATEGORIES

  • Bar Charts
  • Circle Graphs
  • Column Charts
  • Combo Charts
  • Comparison Charts
  • Line Graphs
  • PPC Charts
  • Sentiment Analysis Charts
  • Survey Charts

TOP CHARTS

  • Sankey Diagram
  • Likert Scale Chart
  • Comparison Bar Chart
  • Pareto Chart
  • Funnel Chart
  • Gauge Chart
  • Radar Chart
  • Radial Bar Chart
  • Sunburst Chart
  • see more
  • Scatter Plot Chart
  • CSAT Survey Bar Chart
  • CSAT Survey Chart
  • Dot Plot Chart
  • Double Bar Graph
  • Matrix Chart
  • Multi Axis Line Chart
  • Overlapping Bar Chart
  • Control Chart
  • Slope Chart
  • Clustered Bar Chart
  • Clustered Column Chart
  • Box and Whisker Plot
  • Tornado Chart
  • Waterfall Chart
  • Word Cloud
  • see less

RESOURCES

  • Blog
  • Resources
  • YouTube
SIGN UP FOR UPDATES

We wouldn't dream of spamming you or selling your info.

© 2025 ChartExpo, all rights reserved.