• Home
  • Tools dropdown img
    • Spreadsheet Charts

      • ChartExpo for Google Sheets
      • ChartExpo for Microsoft Excel
    • Power BI Charts

      • Power BI Custom Visuals by ChartExpo
    • Word Cloud

  • Charts dropdown img
    • Chart Category

      • Bar Charts
      • Circle Graphs
      • Column Charts
      • Combo Charts
      • Comparison Charts
      • Line Graphs
      • PPC Charts
      • Sentiment Analysis Charts
      • Survey Charts
    • Chart Type

      • Box and Whisker Plot
      • Clustered Bar Chart
      • Clustered Column Chart
      • Comparison Bar Chart
      • Control Chart
      • CSAT Survey Bar Chart
      • CSAT Survey Chart
      • Dot Plot Chart
      • Double Bar Graph
      • Funnel Chart
      • Gauge Chart
      • Likert Scale Chart
      • Matrix Chart
      • Multi Axis Line Chart
      • Overlapping Bar Chart
      • Pareto Chart
      • Radar Chart
      • Radial Bar Chart
      • Sankey Diagram
      • Scatter Plot Chart
      • Slope Chart
      • Sunburst Chart
      • Tornado Chart
      • Waterfall Chart
      • Word Cloud
    • Google Sheets
      Microsoft Excel
  • Services
  • Pricing
  • Contact us
  • Blog
  • Support dropdown img
      • Gallery
      • Videos
      • Contact us
      • FAQs
      • Resources
    • Please feel free to contact us

      atsupport@chartexpo.com

Categories
All Data Visualizations Data Analytics Surveys
Add-ons/
  • Google Sheets
  • Microsoft Excel
  • Power BI
All Data Visualizations Data Analytics Surveys
Add-ons
  • Google Sheets
  • Microsoft Excel
  • Power BI

We use cookies

This website uses cookies to provide better user experience and user's session management.
By continuing visiting this website you consent the use of these cookies.

Ok

ChartExpo Survey


Home > Blog > Google Sheets

Google Sheets Add-Ons for Modern Spreadsheet Users

What are Google Sheets Add-Ons? Imagine handling a vast spreadsheet with thousands of rows and columns. Hours fly by as you manually format, calculate, or input data. This is where Google Sheets Add-Ons can save your day. They make Google Sheets more powerful.

Google Sheets Add-Ons

Add-ons are mini-apps within Google Sheets that help you streamline tasks. These tools offer solutions tailored to real needs, from advanced data analysis to project management. They help you automate repetitive tasks, organize information, or visualize data without leaving Google Sheets.

Companies and individuals alike are adopting these tools. Why? They reduce time spent on monotonous work and boost productivity. Google Sheets Add-Ons have a range of uses, such as quick data clean-up, complex analysis, etc. Take the add-on “Autocrat”, for instance; This add-on is popular for creating personalized documents in seconds. Or “Power Tools”, – it simplifies common tasks like removing duplicates or merging sheets.

The possibilities with Google Sheets Add-Ons keep growing as developers create new, innovative options to meet demand. Let’s explore these add-ons and transform how you manage and process data.

Table of Contents:

  1. What are Google Sheet Add-Ons?
  2. Benefits of Using Google Sheets Add-Ons
  3. Best Google Sheets Add-Ons to Enhance Your Work
  4. How to Create Charts Using the Best Google Sheets Add-Ons for Analysis?
  5. FAQs
  6. Wrap Up

What are Google Sheet Add-Ons?

Definition: Google Sheets Add-Ons are tools that expand what you can do in Google Sheets. They let you automate tasks, analyze data, and connect with other apps.

Do you need to send mass emails, create invoices, or track projects? There’s likely an add-on for that. With over 500 available, Google Sheets Add-Ons bring flexibility and power to your spreadsheets. They’re essential for saving time and boosting productivity, transforming Google Sheets into a customized workspace for any task.

Top 10 Charts using Google Sheets Add-Ons

Below are the top ten charts, as well as a Scatter plot in Google Sheets, all created using ChartExpo in Google Sheets:

Horizontal Waterfall Chart:

Google Sheets Add-Ons

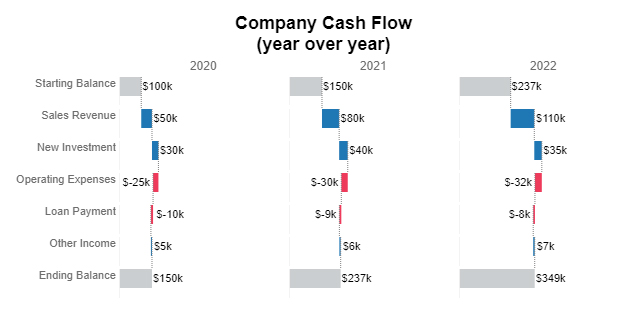
Google Sheets add-ons make it easy to create advanced visuals, including a Waterfall chart in Google Sheets, without complex formulas. These tools help turn raw data into clear insights with just a few clicks.

Comparison Bar Chart:

Google Sheets Add-Ons

Likert Scale Chart:

Google Sheets Add-Ons

Circular Org Chart:

Google Sheets Add-Ons

Multi Axis Line Chart:

Google Sheets Add-Ons

Mosaic Plot (aka Mekko)

Google Sheets Add-Ons

Gauge Chart:

Google Sheets Add-Ons

Slope Chart:

Google Sheets Add-Ons

Progress Chart:

Google Sheets Add-Ons

Sankey Chart:

Google Sheets Add-Ons

Benefits of Using Google Sheets Add-Ons

Imagine turning a simple spreadsheet into a dynamic, versatile workspace. That’s the magic of Google Sheets Add-Ons. They take familiar Google Sheets charts and supercharge them with powerful, practical tools for deeper analysis and clearer insights.

Here are the benefits of using Google Sheets add-ons.

  • Extended functionality: Google Sheets Add-Ons let you do more. From financial tracking to project management, there’s an add-on for almost every need. It’s not just spreadsheets; it’s your ultimate productivity hub.
  • Time savings: By automating repetitive tasks, add-ons free up valuable time. You can schedule emails, generate reports, and update data with a few clicks. It’s a huge boost for productivity.
  • Improved data management: Handling large data sets? Add-ons simplify sorting, filtering, and analyzing, making it easier to keep track of important information. With clear visuals like a Pareto chart in Google Sheets, along with features such as BigQuery integration, data processing becomes smoother and more actionable.
  • Enhanced collaboration: Google Sheets is already great for teamwork. But add-ons take it further. With options to sync with project management tools, your team stays aligned and informed.
  • Customizability: Add-ons let you shape Google Sheets to fit your needs. You can integrate other apps, add specialized formulas, and design workflows that match your unique processes.
  • Cost-effective solutions: Most add-ons are free or affordable. They bring premium features without the high cost, making optimizing their workflows easier for individuals and small businesses.
  • User-friendly: Google Sheets Add-Ons are simple to install and easy to use. Even if you’re not a tech expert, you can quickly learn to use them and enjoy all the added benefits.

Best Google Sheets Add-Ons to Enhance Your Work

Sometimes, a spreadsheet needs a little extra power. That’s where Google Sheets add-ons come in. These tools make doing more than you ever thought possible in a spreadsheet possible.

Let’s explore some of the best Google Sheets add-ons to enhance productivity. And we’ll save the best for last!

  1. Supermetrics: This add-on is ideal for marketers. It pulls data from Google Analytics, Facebook Ads, and other sources into Google Sheets. This makes it easy to analyze and report on all your marketing metrics in one place.
  2. Power Tools: For those managing big data sets, Power Tools simplifies bulk changes. You can clean data, remove duplicates, or perform advanced calculations with one click. It’s a massive time-saver.
  3. Yet Another Mail Merge: Need to send personalized emails? Yet Another Mail Merge lets you quickly send bulk, customized emails from Google Sheets. It’s perfect for email campaigns or business communications.
  4. AutoCrat: This tool is a favorite for creating documents. AutoCrat can automatically generate PDFs or Google Docs based on data from your Sheets. It’s great for creating invoices, certificates, and personalized reports.
  5. Data Connector for Salesforce: For those using Salesforce, this add-on syncs your CRM data directly with Google Sheets. It analyzes sales performance, manages contacts, and streamlines data.
  6. ChartExpo: And now, for the best. ChartExpo turns Google Sheets into a powerful data visualization tool. With ChartExpo, you can create stunning, interactive charts and graphs far beyond Google Sheets’ basic offerings.

Why is ChartExpo the best? It’s easy to use, requires no coding, and offers a wide variety of chart types that make your data stand out. ChartExpo transforms numbers into clear, engaging visuals, helping you make data-driven decisions with ease.

How to Create Charts Using the Best Google Sheets Add-Ons for Analysis?

Data is everywhere, but making sense of it? That’s a different story. Effective data analysis depends on visualization—turning raw numbers into insights we can see and understand.

Google Sheets has limitations when it comes to intuitive, dynamic charts. But here’s the good news: Google Sheets Add-Ons can fill the gap.

Meet ChartExpo, a powerful add-on that transforms data into eye-catching, insightful visuals. Whether you’re tracking sales trends, comparing campaign results, or creating an online Sankey diagram, ChartExpo makes it simple to bring your data to life.

How?

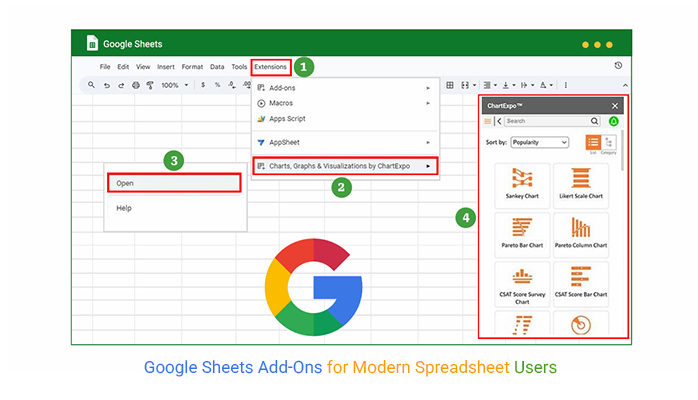
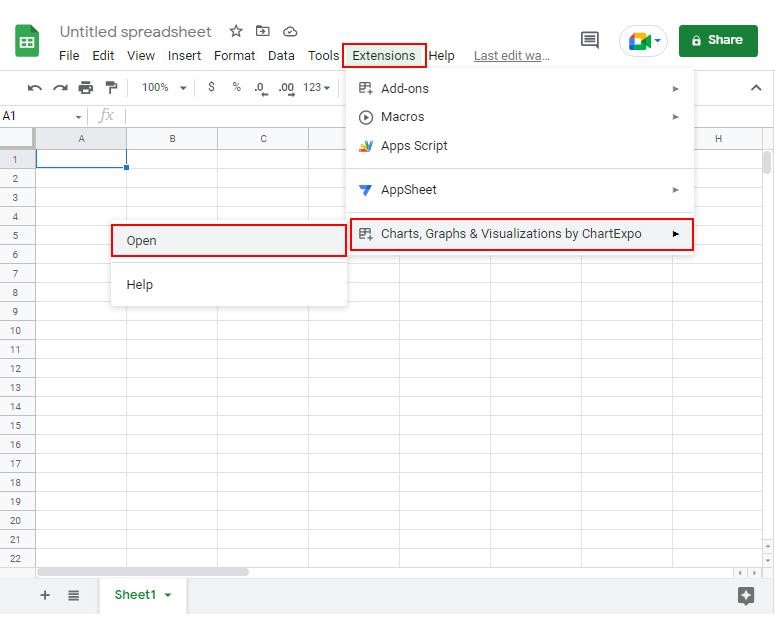
How to Install ChartExpo in Google Sheets?

  1. To start using ChartExpo, download it directly from the Google Sheets program. To do this, select Extensions from the top toolbar.
  2. A menu will appear. Click the Get add-ons option.
  3. Search for ChartExpo, and click on Charts, Graphs & Visualizations by ChartExpo when it appears in the results.
  4. Click the Install button. You will have to confirm your Google account and accept some permissions.

ChartExpo charts are available both in Google Sheets and Microsoft Excel. Please use the following CTAs to install the tool of your choice and create beautiful visualizations in a few clicks in your favorite tool.

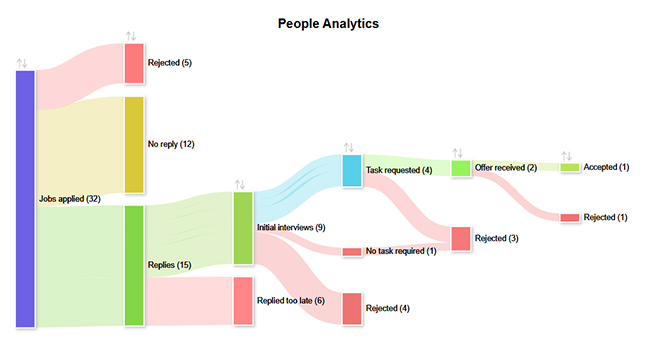
Let’s use the data sample below for demonstration.

Level 1 Level 2 Level 3 Level 4 Level 5 Level 6 Count
Jobs applied Replies Initial interviews Task requested Offer received Accepted 1
Jobs applied Replies Initial interviews Task requested Offer received Rejected 1
Jobs applied Replies Initial interviews Task requested Rejected 2
Jobs applied Replies Initial interviews No task required Rejected 1
Jobs applied Replies Initial interviews Rejected 4
Jobs applied Replies Replied too late 6
Jobs applied Rejected 5
Jobs applied No reply 12
  • To get started with ChartExpo, install ChartExpo in Google Sheets.
  • Go to Extensions > Charts, Graphs & Visualizations by ChartExpo > Open.
Google Sheets Add-Ons
  • To access the charts library, click the Add new chart button.
Google Sheets Add-Ons
  • Once ChartExpo is loaded. Click on “Sankey Chart”.
Google Sheets Add-Ons
  • After selecting the sheet that contains your data, choose the Metrics option. Add the corresponding numbers.
  • To add dimensional data, click the Dimensions button and enter the desired values:
Google Sheets Add-Ons
  • Click the Create chart button to complete the process.
Google Sheets Add-Ons
  • Click the Edit chart button to make custom changes.
  • To change the chart’s title, click the pencil icon next to the Chart Header.
  • It will open the properties dialog. Under the Text section, you can add a heading in Line 1 and enable the Show option. Give the appropriate title of your chart and click the Apply button.
Google Sheets Add-Ons
  • You can disable the percentage by clicking on the small pencil icon:
Google Sheets Add-Ons
  • You can disable the percentage sign with all values as follows:
Google Sheets Add-Ons
  • You can disable the footer label as follows:
Google Sheets Add-Ons
  • You can add the colors of all Nodes as follows:
Google Sheets Add-Ons
  • Change all the legend shapes into circles and click the “Save” button:
Google Sheets Add-Ons
  • Your final chart will appear as shown below.
Google Sheets Add-Ons

Insights

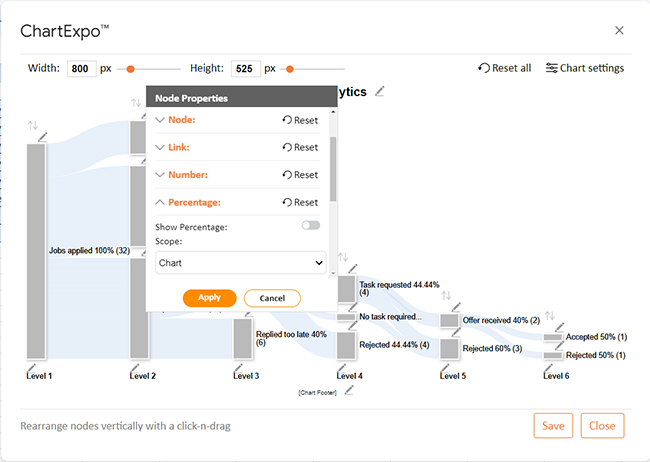
Total job applications: 32

  • Offers received: 2
  • Offers accepted: 1

Outcomes:

  • No replies: 12
  • Direct rejections: 5
  • Late replies: 6

FAQs

How do I get add-ons in Google Sheets?

To get add-ons in Google Sheets:

  • Open any sheet and go to “Extensions” in the top menu.
  • Click “Add-ons” and select “Get add-ons.”
  • Browse or search for the desired add-on, then install it.

Are Google Sheets add-ons safe?

Yes, Google Sheets add-ons are generally safe, but caution is key. Only install add-ons from trusted developers and those with high ratings. Google reviews add-ons, but permissions vary. Always review the permissions before adding one to your Sheets.

How do I manage Google Sheets add-ons?

To manage Google Sheets add-ons, open any sheet and go to “Extensions”. Select “Add-ons” and click “Manage add-ons”. From there, you can view, disable, or remove add-ons. This helps keep your workspace organized and secure.

Wrap Up

Google Sheets Add-Ons are more than just extra features; they’re game-changers for productivity. They expand Google Sheets’ basic tools, making it easy to automate, organize, and analyze. From sending bulk emails to managing large datasets, these add-ons are designed to save time and improve workflow.

Using Google Sheets Add-Ons, you can customize your workspace to fit specific needs. This flexibility is especially helpful for teams that need to collaborate and keep data accessible. Each add-on focuses on different tasks, making it easy to pick tools that fit perfectly with your goals.

Many add-ons offer automation features. Tasks that once took hours can now be completed in minutes. With add-ons like Yet Another Mail Merge and AutoCrat, you can effortlessly streamline emails, reports, and other routine processes.

Data analysis also becomes much more intuitive with add-ons. Tools like Data Connector for Salesforce bring in essential CRM data, while Supermetrics collects marketing metrics from multiple sources.

ChartExpo stands out when it comes to visualizing data. This add-on makes creating insightful, interactive charts without any technical skills easy.

If you’re ready to take your data analysis further, install ChartExpo today. It will bring clarity to your data in Google Sheets and help you make smarter decisions.

How much did you enjoy this article?

GSAd2
Start Free Trial!
152107

Related articles

next previous
Google Sheets24 min read

Google Sheets Charts: Types, Examples, and Best Practices

Discover how Google Sheets charts can simplify data visualization and help you make data-driven decisions quickly.

Google Sheets13 min read

Sales Projection Template in Google Sheets for Clear Insights

A sales projection template helps predict revenue with clarity. Learn best practices, examples, and tips in Google Sheets to improve planning and growth.

Google Sheets11 min read

Google Sheets Apps for Presentable Insights

Google Sheets apps boost productivity with smarter data handling. Click here to learn how to use them for better charts, faster analysis, and smarter decisions.

Google Sheets14 min read

Google Sheets Query Function: A Visual Approach

The Google Sheets query function filters and analyzes data fast. Click here to learn the syntax with examples and best practices to boost your data analysis.

Google Sheets14 min read

Google Sheets Automation: Practical Use Cases

Google Sheets automation helps you save time and reduce errors with smart tools. Learn how to automate, analyze, and visualize your data with ease.

ChartExpo logo

Turn Data into Visual
Stories

CHARTEXPO

  • Home
  • Gallery
  • Videos
  • Services
  • Pricing
  • Contact us
  • FAQs
  • Privacy policy
  • Terms of Service
  • Sitemap

TOOLS

  • ChartExpo for Google Sheets
  • ChartExpo for Microsoft Excel
  • Power BI Custom Visuals by ChartExpo
  • Word Cloud

CATEGORIES

  • Bar Charts
  • Circle Graphs
  • Column Charts
  • Combo Charts
  • Comparison Charts
  • Line Graphs
  • PPC Charts
  • Sentiment Analysis Charts
  • Survey Charts

TOP CHARTS

  • Sankey Diagram
  • Likert Scale Chart
  • Comparison Bar Chart
  • Pareto Chart
  • Funnel Chart
  • Gauge Chart
  • Radar Chart
  • Radial Bar Chart
  • Sunburst Chart
  • see more
  • Scatter Plot Chart
  • CSAT Survey Bar Chart
  • CSAT Survey Chart
  • Dot Plot Chart
  • Double Bar Graph
  • Matrix Chart
  • Multi Axis Line Chart
  • Overlapping Bar Chart
  • Control Chart
  • Slope Chart
  • Clustered Bar Chart
  • Clustered Column Chart
  • Box and Whisker Plot
  • Tornado Chart
  • Waterfall Chart
  • Word Cloud
  • see less

RESOURCES

  • Blog
  • Resources
  • YouTube
SIGN UP FOR UPDATES

We wouldn't dream of spamming you or selling your info.

© 2026 ChartExpo, all rights reserved.