• Home
  • Tools dropdown img
    • Spreadsheet Charts

      • ChartExpo for Google Sheets
      • ChartExpo for Microsoft Excel
    • Power BI Charts

      • Power BI Custom Visuals by ChartExpo
    • Word Cloud

  • Charts dropdown img
    • Chart Category

      • Bar Charts
      • Circle Graphs
      • Column Charts
      • Combo Charts
      • Comparison Charts
      • Line Graphs
      • PPC Charts
      • Sentiment Analysis Charts
      • Survey Charts
    • Chart Type

      • Box and Whisker Plot
      • Clustered Bar Chart
      • Clustered Column Chart
      • Comparison Bar Chart
      • Control Chart
      • CSAT Survey Bar Chart
      • CSAT Survey Chart
      • Dot Plot Chart
      • Double Bar Graph
      • Funnel Chart
      • Gauge Chart
      • Likert Scale Chart
      • Matrix Chart
      • Multi Axis Line Chart
      • Overlapping Bar Chart
      • Pareto Chart
      • Radar Chart
      • Radial Bar Chart
      • Sankey Diagram
      • Scatter Plot Chart
      • Slope Chart
      • Sunburst Chart
      • Tornado Chart
      • Waterfall Chart
      • Word Cloud
    • Google Sheets
      Microsoft Excel
  • Services
  • Pricing
  • Contact us
  • Blog
  • Support dropdown img
      • Gallery
      • Videos
      • Contact us
      • FAQs
      • Resources
    • Please feel free to contact us

      atsupport@chartexpo.com

Categories
All Data Visualizations Data Analytics Surveys
Add-ons/
  • Google Sheets
  • Microsoft Excel
  • Power BI
All Data Visualizations Data Analytics Surveys
Add-ons
  • Google Sheets
  • Microsoft Excel
  • Power BI

We use cookies

This website uses cookies to provide better user experience and user's session management.
By continuing visiting this website you consent the use of these cookies.

Ok

ChartExpo Survey


Home > Blog > Microsoft Excel

How to Clean Data in Excel for Insightful Visuals?

Learning how to clean data in Excel is essential for individuals working with disorganized data sets. Data cleansing is integral to data analysis, guaranteeing precision and dependability.

Are you aware that businesses lose an average of $15 million annually due to poor data quality? This highlights the essential importance of becoming proficient in data cleansing. Excel continues to be widely used for this purpose, with a global user base exceeding 750 million people. Its durability characteristics make it perfect for converting crude data into valuable insights.

How to Clean Data in Excel

Understanding how to clean data in Excel helps save time and reduce errors. Common issues include duplicates, missing values, and inconsistent formatting. Tackling these issues can significantly enhance quality. For example, removing duplicates ensures unique entries, while filling in missing values prevents gaps in analysis.

Excel offers various tools to streamline the cleaning process. Functions like TRIM, CLEAN, and VLOOKUP simplify data correction. The Text to Columns feature can separate data into different cells, enhancing clarity. Learning these techniques can boost your productivity and analytical capabilities.

In an era focused on data, knowing how to clean data in Excel is a valuable asset. It enables individuals to make well-informed decisions using precise information.

So, let’s explore Excel features and transform your data-cleaning process today.

Table of Contents:

  1. What are the Components for Clean Data in Excel?
  2. How to Clean Data in Excel?
  3. How to Visualize Your Data in Excel?
  4. Wrap Up

First…

What are the Components for Clean Data in Excel?

Clean data makes Excel work better. It ensures accuracy and helps avoid mistakes. But what does clean data mean? It’s about more than fixing errors. It means organizing and preparing data for valuable insights. Here are the key components for clean data.

  • Consistency: Data must be uniform. Use the same formats, units, and labels throughout. For example, stick to one date format, like “MM/DD/YYYY.”
  • Accuracy: Data should reflect the real world. Inaccurate data leads to wrong conclusions. So, double-check your entries and formulas.
  • Completeness: Missing data can cause errors. Make sure all required fields are filled. If something is missing, mark it.
  • Uniqueness: Each entry should appear only once. Duplicates can skew your results, so always check to eliminate duplicates in Excel. This ensures your data is accurate and ready for analysis.
  • Validity: Data must follow the rules. For example, if a field is for percentages, only enter percentages – stick to the correct format.
  • Relevance: Only collect the data you need. Irrelevant data clutters your sheet. Focus on what matters for your data analysis.

How to Clean Data in Excel?

Working with messy data can be frustrating. Whether preparing a report or analyzing trends, clean data is key to accurate results. Fortunately, Excel offers powerful tools to tidy up your dataset quickly. Let’s walk through some simple yet effective steps to clean and prepare your data for analysis.

  1. Remove duplicates: Duplicate entries can distort your results. Use the “Remove Duplicates” feature under the Data tab to clean up repeated rows instantly.
  2. Handle missing data: Missing data can affect calculations. You can fill in the gaps, delete rows with missing values, or use functions like IFERROR to manage them properly.
  3. Text to columns: Sometimes, data gets crammed into one column. Use “Text to Columns” to split it into separate fields. This is great for separating names, addresses, or dates.
  4. Trim spaces: Extra spaces make sorting and filtering tricky. Use the TRIM function to remove unnecessary spaces from your data.
  5. Correct data formats: Ensure your data is in the proper format. Dates should be formatted as dates, numbers as numbers, and text as text to avoid calculation errors.
  6. Use Find and Replace: Find and Replace helps you fix consistent errors across large datasets. For example, you can replace all occurrences of “N/A” with blank cells.
  7. Remove unwanted characters: Symbols or special characters can disrupt analysis. Use functions like SUBSTITUTE to remove or replace them with clean data.
  8. Standardize data: Ensure your data follows a uniform format. For example, if one part of the dataset uses “CA” for California, ensure the rest does the same.
  9. Spell check: Typos are common in large datasets. Use Excel’s spell-check tool to catch errors in text fields.
  10. Conditional formatting for errors: Highlight possible errors using conditional formatting. It helps flag numbers out of range or cells that don’t meet certain criteria.
  11. Remove blank rows and columns: Blank rows and columns can clutter your sheet. Delete them to keep your data organized and easier to navigate.
  12. Use data validation: Use data validation to set rules for data entry. This will ensure future entries follow the correct format, such as restricting input to dates or numbers.

How to Visualize Your Data in Excel?

In data analysis, visuals speak louder than numbers. Data visualization transforms raw data into compelling stories.

However, Excel, the go-to tool for many, often struggles with complex visualizations. Its basic charts can leave your data looking dull and uninspired.

Enter ChartExpo, a powerful add-on that breathes life into your spreadsheets. It turns ordinary data into extraordinary insights, bridging the gap where Excel falls short. With ChartExpo, your data isn’t just seen; it’s understood.

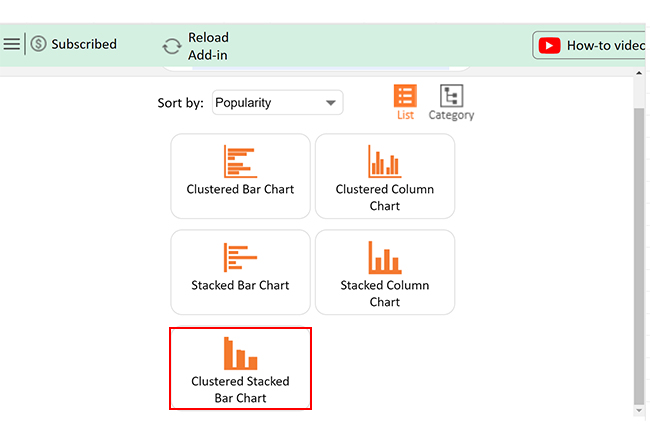
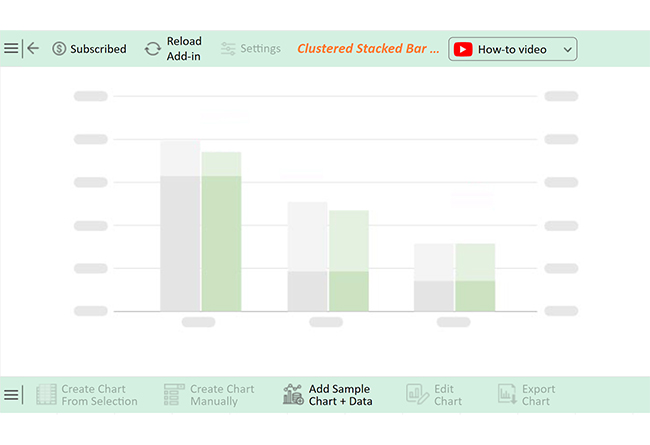
Let’s learn how to install ChartExpo in Excel.

  1. Open your Excel application.
  2. Open the worksheet and click the “Insert” menu.
  3. You’ll see the “My Apps” option.
  4. In the Office Add-ins window, click “Store” and search for ChartExpo on my Apps Store.
  5. Click the “Add” button to install ChartExpo in your Excel.

ChartExpo charts are available both in Google Sheets and Microsoft Excel. Please use the following CTAs to install the tool of your choice and create beautiful visualizations with a few clicks in your favorite tool.

Data Cleaning in Excel Example

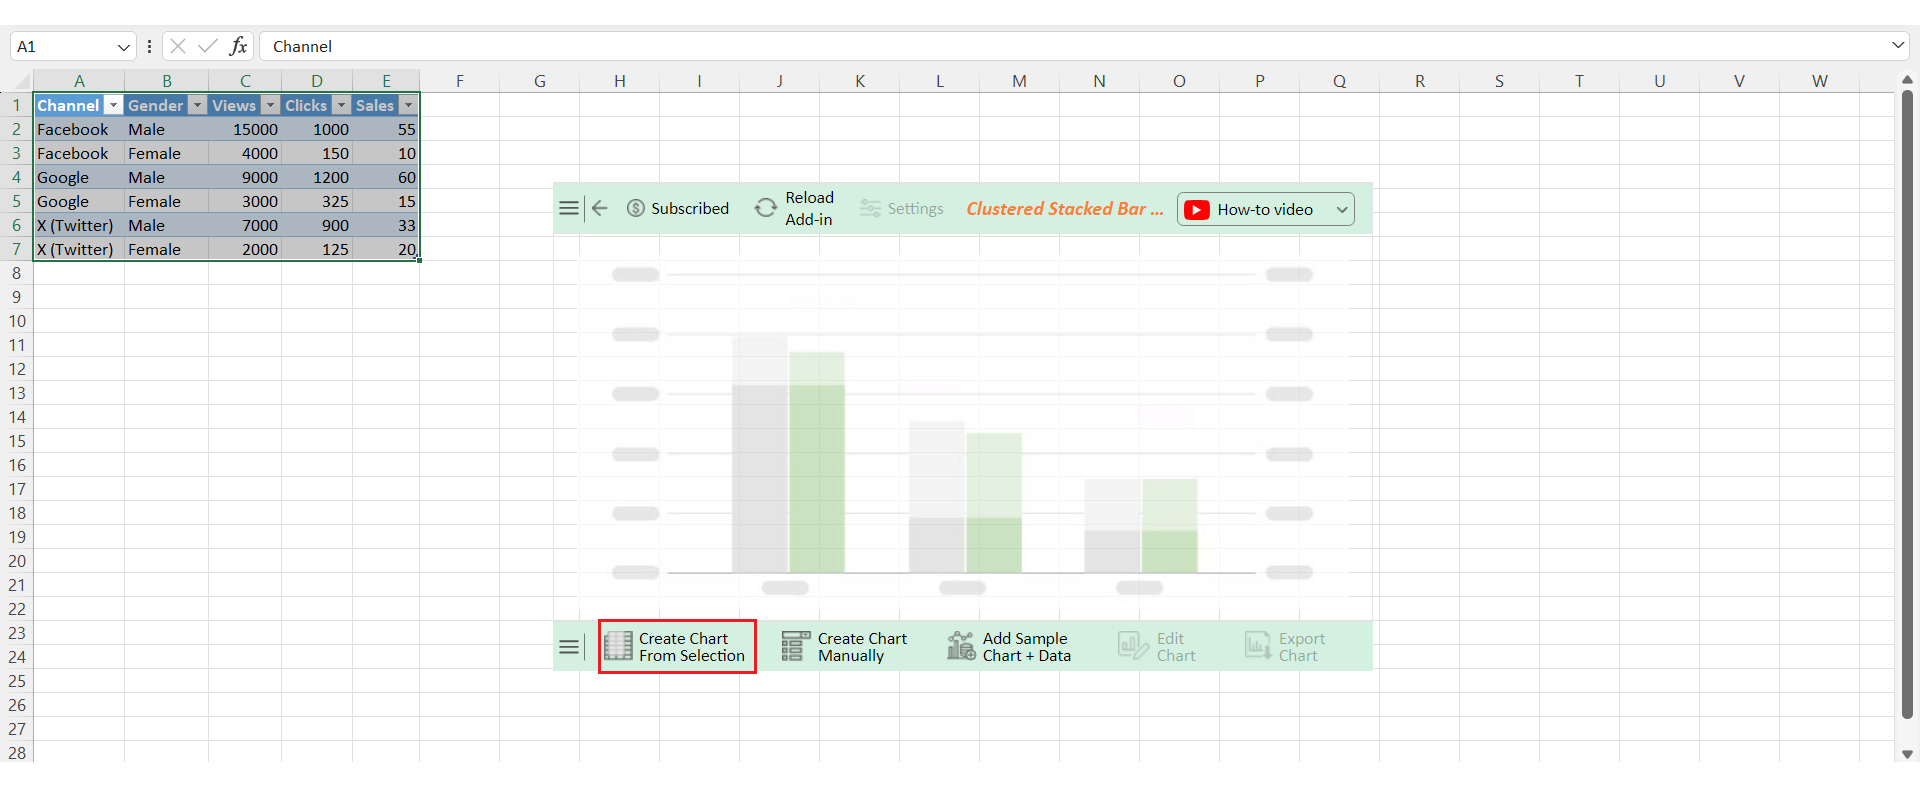
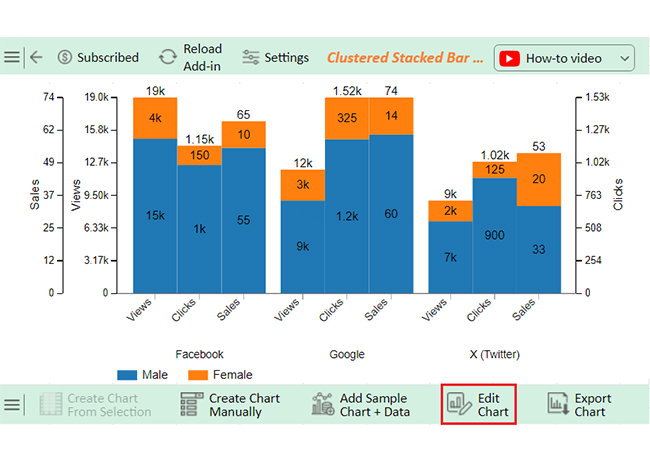
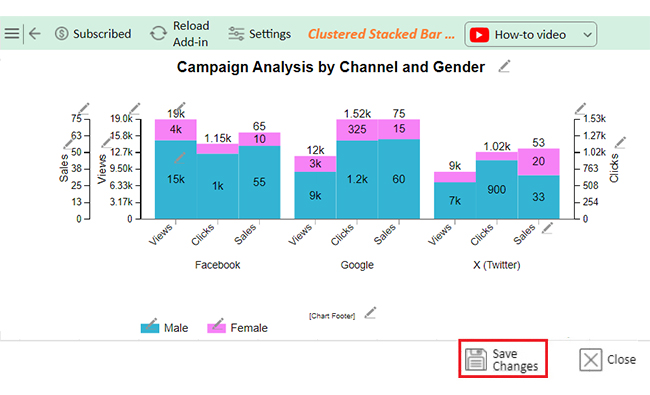
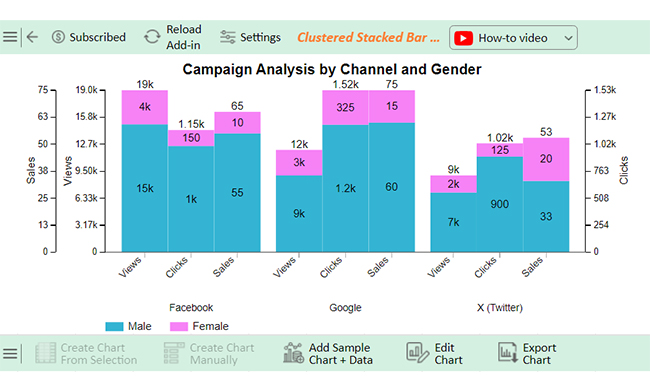
Let’s visualize and analyze the sample data below using ChartExpo.

Channel Gender Views Clicks Sales
Facebook Male 15000 1000 55
Facebook Female 4000 150 10
Google Male 9000 1200 60
Google Female 3000 325 15
X (Twitter) Male 7000 900 33
X (Twitter) Female 2000 125 20
  • To get started with ChartExpo, install ChartExpo in Excel.
  • Now Click on My Apps from the INSERT menu.
insert chartexpo in excel
  • Choose ChartExpo from My Apps, then click Insert.
open chartexpo in excel
  • Once it loads, scroll through the charts list to locate and choose the “Clustered Stacked Bar Chart”. This chart is best suited to this scenario.
search clustered stacked bar chart in excel
  • You will see a Clustered Stacked Bar Chart on the screen.
Chart Page After Learning How to Clean Data in Excel
  • Click the “Create Chart From Selection” button after selecting the data from the sheet, as shown.
Click Create Chart From Selection After Learning How to Clean Data in Excel
  • ChartExpo will generate the visualization below for you.
Initial Visual After Learning How to Clean Data in Excel
  • If you want to have the chart’s title, click Edit Chart, as shown in the above image.
  • Click the pencil icon next to the Chart Header to change the title.
  • It will open the properties dialog. Under the Text section, you can add a heading in Line 1 and enable Show.
  • Give the appropriate title of your chart and click the Apply button.
Add Chart Header After Learning How to Clean Data in Excel
  • You can change the color of the Male section by clicking on the Legend small pencil icon:
Change Color of Male After Learning How to Clean Data in Excel
  • You can change the color of the Female section by clicking on the Legend small pencil icon:
Change Color of Female After Learning How to Clean Data in Excel
  • Click the “Save Changes” button to persist the changes.
Click Save Changes After Learning How to Clean Data in Excel
  • Your Clustered Stacked Bar Chart will appear as below.
Final How to Clean Data in Excel

Insights

  • Male users outperform female users in views, clicks, and sales across all channels.
  • Google excels in driving sales, particularly among male users.
  • Facebook garners the highest overall views but shows lower efficiency in converting those views into sales.

FAQs

Which Excel tools are best for cleaning data before creating charts or graphs?

Excel offers several tools to clean data before creating charts:

  • Use Remove Duplicates to eliminate repeated entries
  • Text to Columns for separating data
  • Trim for extra spaces
  • Conditional Formatting and Data Validation also help ensure clean, accurate data.

How do you clean data in Excel before performing the statistical analysis?

  1. Remove duplicates to avoid skewed results.
  2. Handle missing data by filling, deleting, or using IFERROR.
  3. Standardize data formats (dates, numbers, text).
  4. Trim extra spaces using TRIM.
  5. Use Data Validation to ensure accurate entries.
  6. Remove unwanted characters.

How to clean data in Excel for accurate multi-axis line charts?

  1. Remove duplicates to prevent misleading trends.
  2. Ensure consistent data formats (numbers, dates).
  3. Use TRIM to remove extra spaces.
  4. Handle missing data by filling gaps or removing rows.
  5. Standardize labels and categories.
  6. Remove unnecessary columns or rows.

Wrap Up

Cleaning data in Excel is a critical step in ensuring the accuracy of your analysis. Messy data leads to errors, so it’s important to get it right.

First, remove duplicates. This avoids double-counting and keeps your results clean. Excel’s “Remove Duplicates” tool makes this easy.

Next, handle missing data. You can fill in gaps or remove incomplete rows. This ensures your analysis isn’t thrown off by missing information.

Correct data formats are key. Dates, numbers, and text should be in their proper formats. Inconsistent formats can mess up calculations and charts.

Use TRIM to remove extra spaces. These can cause problems when sorting or filtering data. It’s a quick fix for a common issue.

Lastly, check for unwanted characters and standardize entries. Uniform labels and categories make your data clearer and easier to analyze, and removing any unnecessary characters keeps the data clean.

By following these steps, your Excel data will be reliable. Clean data ensures that your charts, graphs, and analysis are accurate. With just a bit of effort, you can transform messy data into a powerful tool for insights.

How much did you enjoy this article?

ExcelAd2
Start Free Trial!
141331

Related articles

next previous
Microsoft Excel12 min read

Weighted Average on Excel Simplified for Accurate Analysis

Improve your analysis with the weighted average on Excel. This guide explains how to apply it for more accurate insights in grading, finance, and performance.

Microsoft Excel9 min read

Interpolate in Excel: A Complete Walkthrough

Interpolate in Excel to estimate missing values accurately. This blog shows you how to apply linear interpolation, analyze data, and visualize trends with a chart.

Microsoft Excel9 min read

How to Create a Stacked Waterfall Chart in Excel?

Discover how to build and customize a stacked waterfall chart in Excel. Ideal for showing positive and negative values across categories or time.

Microsoft Excel10 min read

Excel Bookkeeping for Small Business: Insights at a Glance

Excel bookkeeping for small businesses helps track income, expenses, and cash flow. Learn about templates and financial analysis to simplify bookkeeping.

Microsoft Excel10 min read

Compound Interest in Excel for Smarter Reporting

Discover compound interest in Excel and how it works. Learn its formulas, calculation tips, and common errors to avoid for more accurate financial analysis.

ChartExpo logo

Turn Data into Visual
Stories

CHARTEXPO

  • Home
  • Gallery
  • Videos
  • Services
  • Pricing
  • Contact us
  • FAQs
  • Privacy policy
  • Terms of Service
  • Sitemap

TOOLS

  • ChartExpo for Google Sheets
  • ChartExpo for Microsoft Excel
  • Power BI Custom Visuals by ChartExpo
  • Word Cloud

CATEGORIES

  • Bar Charts
  • Circle Graphs
  • Column Charts
  • Combo Charts
  • Comparison Charts
  • Line Graphs
  • PPC Charts
  • Sentiment Analysis Charts
  • Survey Charts

TOP CHARTS

  • Sankey Diagram
  • Likert Scale Chart
  • Comparison Bar Chart
  • Pareto Chart
  • Funnel Chart
  • Gauge Chart
  • Radar Chart
  • Radial Bar Chart
  • Sunburst Chart
  • see more
  • Scatter Plot Chart
  • CSAT Survey Bar Chart
  • CSAT Survey Chart
  • Dot Plot Chart
  • Double Bar Graph
  • Matrix Chart
  • Multi Axis Line Chart
  • Overlapping Bar Chart
  • Control Chart
  • Slope Chart
  • Clustered Bar Chart
  • Clustered Column Chart
  • Box and Whisker Plot
  • Tornado Chart
  • Waterfall Chart
  • Word Cloud
  • see less

RESOURCES

  • Blog
  • Resources
  • YouTube
SIGN UP FOR UPDATES

We wouldn't dream of spamming you or selling your info.

© 2025 ChartExpo, all rights reserved.