• Home
  • Tools dropdown img
    • Spreadsheet Charts

      • ChartExpo for Google Sheets
      • ChartExpo for Microsoft Excel
    • Power BI Charts

      • Power BI Custom Visuals by ChartExpo
    • Word Cloud

  • Charts dropdown img
    • Chart Category

      • Bar Charts
      • Circle Graphs
      • Column Charts
      • Combo Charts
      • Comparison Charts
      • Line Graphs
      • PPC Charts
      • Sentiment Analysis Charts
      • Survey Charts
    • Chart Type

      • Box and Whisker Plot
      • Clustered Bar Chart
      • Clustered Column Chart
      • Comparison Bar Chart
      • Control Chart
      • CSAT Survey Bar Chart
      • CSAT Survey Chart
      • Dot Plot Chart
      • Double Bar Graph
      • Funnel Chart
      • Gauge Chart
      • Likert Scale Chart
      • Matrix Chart
      • Multi Axis Line Chart
      • Overlapping Bar Chart
      • Pareto Chart
      • Radar Chart
      • Radial Bar Chart
      • Sankey Diagram
      • Scatter Plot Chart
      • Slope Chart
      • Sunburst Chart
      • Tornado Chart
      • Waterfall Chart
      • Word Cloud
    • Google Sheets
      Microsoft Excel
  • Services
  • Pricing
  • Contact us
  • Blog
  • Support dropdown img
      • Gallery
      • Videos
      • Contact us
      • FAQs
      • Resources
    • Please feel free to contact us

      atsupport@chartexpo.com

Categories
All Data Visualizations Data Analytics Surveys
Add-ons/
  • Google Sheets
  • Microsoft Excel
  • Power BI
All Data Visualizations Data Analytics Surveys
Add-ons
  • Google Sheets
  • Microsoft Excel
  • Power BI

We use cookies

This website uses cookies to provide better user experience and user's session management.
By continuing visiting this website you consent the use of these cookies.

Ok

ChartExpo Survey


Home > Blog > Microsoft Excel

How to Connect Online Forms to Excel to Analyze Data?

You’ve just conducted an online survey using free tools like Microsoft Forms.

The next logical stage is exporting data into a tool that can help you visualize it for actionable insights.

online forms to excel

This is where survey-based charts, such as Likert, come in handy.

These charts are designed specifically to help you extract hidden insights into your survey data from online forms. Besides, they’re incredibly easy to read and interpret, irrespective of your experience with charts.

Also, you can use survey-based charts as a backdrop for your data stories.

Excel lacks specialized online survey-oriented charts for your data stories. You don’t have to discard Excel in favor of other expensive data visualization tools.

You can download and install a particular add-in to access ready-made survey-based for visualizing online forms data.

In this blog, you’ll learn the following:

  • How to connect online forms to Excel?
  • What is an online form?
  • Linking existing online form to Excel
  • Best online forms for data collection
  • How to analyze data collected from an online form to excel?
  • Also, we’ll recommend the proven add-in you can install in Excel to access ready-made survey-based charts

How to Connect Online Forms to Excel?

Before jumping right into the how-to guide, we’ll address the following question: what is an online form?

What is an Online Form?

An online form is an interactive web page you can use to collect input information from a particular target audience.

Once your target users have hit the Submit button, their responses are sent to servers for processing, organizing, and analysis.

There are multiple types of online forms you can embed in your website or share via email, pay-per-click ads, or social media. The most common format of an online form is a text box.

You can easily ask a simple question using a text box format for responses. If you’re not looking for open-ended data, use:

  • Checkboxes with multiple-choice questions
  • Drop-down menus with submit buttons.

Every business needs reliable data to make better decisions.

As a business owner, you can easily collect data from the target market by creating and distributing an online form. This form will provide you with data for further analysis using charts and graphs like the Likert Scale.

Designing and implementing online forms is simple with the right tool. You can use many tools to create online forms for data collection.

Keep reading because we’ll show you how to export online forms to Excel for easy analysis in the coming section. Also, we’ll address the best online forms for data collection.

Best Online Forms for Data Collection

As we said, web forms are critical to your business.

You can collect data from customers using contact and registration forms.

Are you looking to gather the voice of customer data?

In this section, we’ve put together a list of online form builders you can access for free.

Let’s check them out.

  1. Google Forms

Google Forms is a free application you can use to create shareable online web forms.

You can use this platform to ask questions and collect data in a simple and efficient way. Google Forms are flexible and have attributes such as:

  • Short answers
  • Paragraphs
  • Multiple selections
  • Verification boxes
  • Linear scale

Advantages of Google Forms

  • Google Forms is a free online tool you can use to collect data faster.
  • You can put together forms or surveys in a few minutes to gather the voice of customer data.
  • You only need a Gmail account to access this application.
  • Google Forms has a user-friendly interface for everyone to use. Also, it has drag-and-drop form elements, which means you don’t need coding skills.
  • Google Forms gathers and stores your data in Google Drive, which is free for up to 15 gigabytes.
  • You can easily integrate Google Forms with Google Sheets and Excel for detailed analysis.
  • Google Forms has a flexible user interface that allows you to see how the web form looks before sending it via email or embedding it on a website.
  • Also, you can easily share Google Forms using Gmail.
  1. Microsoft Forms

Microsoft Forms is a free application you can use to create shareable online web forms for data collection.

Advantages of Microsoft Forms

  • You can easily configure the app to generate a quiz or survey for data collection. More so, Microsoft Forms can generate a report using real-time analytics.
  • The application can easily integrate with the Office 365 suite.
  • You can customize and embed Microsoft Forms on websites or landing pages.
  • The forms are shareable either via email or URL options.
  • It has features for modifying and deleting form data easily.
  • The app allows you to create duplicate forms from a template.
  • Microsoft Forms data is secure and aligned with Office 365 terms and conditions.

So, how can you go about linking the existing online form to Excel?

Linking Existing Online Form to Excel

Free form builders like Microsoft and Google Forms are changing the online data collection game.

These tools eliminate the need to physically distribute questionnaires and other types of forms to the intended audience.

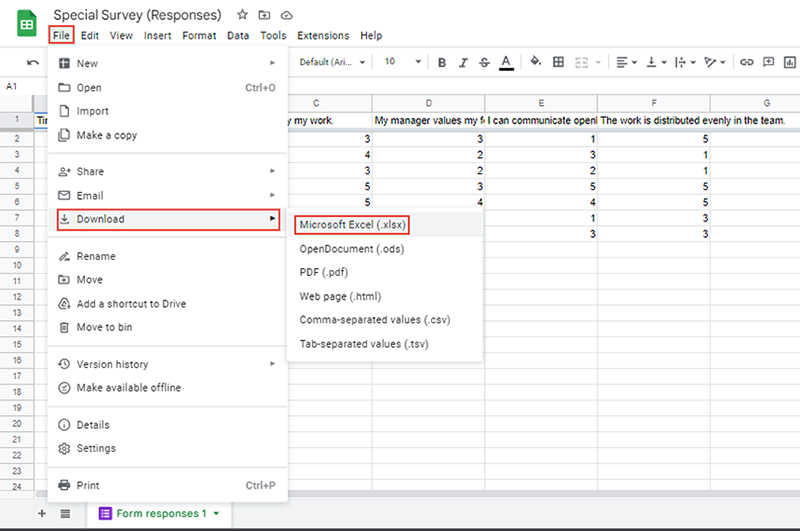
This section will take you through how to link Google and Microsoft online forms to Excel.

Linking existing Microsoft Online Forms to Excel

Imagine you’ve created an online form for data collection. You’ve also created a questionnaire to share with the intended audience. You intend to export your data to Excel for visualization.

Follow the easy steps below.

  • Click the Send or Copy your Form Link to share your form with the intended audience.
copy form link in online forms to excel
  • Once you’ve gathered all the responses, click the Open in Excel button, as shown below.
open from in excel in online forms to excel
  • Your final data will be exported to Excel, as shown below.
export data in excel in online forms to excel

Linking existing Google Online Forms to Excel

Imagine you’ve created an online form for data collection. You’ve also created a questionnaire to share with the intended audience. You intend to export your data to Excel for visualization.

Follow the easy steps below.

  • Click the Send button to share your form with the intended audience.
send from in excel in online forms to excel
  • Alternatively, generate an URL and share it on your social media pages and other platforms, as shown below.
generate url in excel in online forms to excel
  • Click the  icon, as shown.
click icon in excel in online forms to excel
  • The results will be exported to Google Sheets.
export result to Google Sheets in online forms to excel
  • Now either you can copy the result and directly paste in your Excel or you can download by clicking the File tab. Once the dropdown shows, click the Download button and then Microsoft Excel.
  • Your data will be downloaded and opened using the Excel application.
open data in excel in online forms to excel

In the coming section, we’ll take you through how to analyze data collected from Online Form to Excel.

How to Analyze Data Collected from Online Forms to Excel?

Excel is one of the most-used visualization instruments. However, the spreadsheet application lacks ready-made online form data visualization charts, such as Likert.

We’re not advising you to do away with Excel in favor of other expensive tools.

And this is because there’s an amazingly affordable visualization tool that comes as an add-in you can easily install in Excel to access insightful and ready-to-go online forms data visualization charts. The tool is called ChartExpo.

So, what is ChartExpo?

ChartExpo is an add-in you can easily install in your Excel without needing tutorials.

With different and amazing ready-to-go and insightful excel charts, graphs, and maps, the ChartExpo turns your complex, raw data into easy-to-interpret and visually appealing online form survey charts that tell data stories in real-time.

More benefits

  • ChartExpo is a software-as-a-service (SaaS) product, which makes it extremely light. You have a 100% guarantee that your Excel won’t be slowed down.
  • You can export your charts in JPEG, PDF, SVG, and PNG formats.
  • ChartExpo add-in is only $10 a month after the end of the trial period.

Example

This section will use a Likert Scale Chart to visualize the survey data below.

visualize the survey data online forms to excel
  • To install ChartExpo into your Excel, click this link.
  • Open the worksheet and click the Insert button to access the My Apps option.
insert chartexpo in excel
  • Select ChartExpo add-in and click the Insert button.
open chartexpo in excel
  • Once the interface below loads, click the Search box and type your preferred chart.
search likert scale chart in excel
  • In this case, look for “Likert Scale Chart” in the list of charts, as shown above.
create likert scale chart in excel
  • Select the data in the worksheet and click the Create Chart From Selection button, as shown above.
  • Check out the final chart.
online surveys to excel

The result is amazingly presented above. It is very hard to analyze the data in table format but in the above visualization, you can easily check how different colors depict the nature of responses received during the feedback.

Likert Scale Chart in Power BI

Likert Scale Chart in Microsoft Excel

Likert Scale Chart in Google Sheets

FAQs:

Do forms work in Excel online?

Yes, you can easily export your data from web forms to Excel online. Go to the setting and set Excel online as the default spreadsheet application on your PC.

Excel online can help you extract insights into data gathered via online forms, such as Google Forms.

What is the meaning of an online form?

An online form is an interactive landing page you can use to collect input information from a particular target audience.

There’re multiple types of online forms you can embed in your website or share via email or social media. The most common format of an online form is the text boxes.

Wrap Up

You’ve just conducted an online survey using free tools like Microsoft Forms.

The next stage is exporting data into a tool that can help you visualize it for actionable insights. This is where survey-based charts, such as Likert, come in handy.

These charts are designed specifically to help you extract hidden insights into your raw survey data from online forms. Besides, they’re incredibly easy to read and interpret, irrespective of your experience with charts.

Also, you can use survey-based charts as a backdrop for your data stories.

Excel lacks specialized online survey-oriented charts for your data stories.

ChartExpo is an add-in for Excel that’s loaded with insightful and ready-to-go online form data visualization charts. You don’t need programming or coding skills to use ChartExpo.

How to export your online form to Excel for visualization should never be overwhelming or time-consuming.

Sign up for a 7-day free trial today to access ready-made charts for analyzing online forms data.

How much did you enjoy this article?

ExcelAd2
Start Free Trial!
121433

Related articles

next previous
Microsoft Excel13 min read

How to Analyze Survey Data in Excel? Easy-to-Follow Steps

Discover step-by-step methods on how to analyze survey data in Excel. Explore how to organize, compute, examine, and interpret survey results effectively.

Microsoft Excel9 min read

Advanced Excel Charts: Create Impactful Data Visuals

Excel has a wide range of advanced charts and graphs to present your data comprehensively. Learn about top advanced Excel charts and how to create them.

Microsoft Excel13 min read

How to Parse Data in Excel: A Complete Guide

How to parse data in Excel? It’s the process of breaking data into structured segments. Learn the techniques, formulas, and best practices for efficiency.

Microsoft Excel13 min read

How to Make Cool Excel Charts & Graphs?

Explore cool Excel charts and graphs that turn your data into engaging visuals. Perfect for making your reports clear, creative, and impactful.

Microsoft Excel9 min read

Workout Tracking Spreadsheet for Smarter Workout Insights

A workout tracking spreadsheet helps record and track your fitness progress. This blog demonstrates how to utilize it, providing tips, templates, and benefits.

ChartExpo logo

Turn Data into Visual
Stories

CHARTEXPO

  • Home
  • Gallery
  • Videos
  • Services
  • Pricing
  • Contact us
  • FAQs
  • Privacy policy
  • Terms of Service
  • Sitemap

TOOLS

  • ChartExpo for Google Sheets
  • ChartExpo for Microsoft Excel
  • Power BI Custom Visuals by ChartExpo
  • Word Cloud

CATEGORIES

  • Bar Charts
  • Circle Graphs
  • Column Charts
  • Combo Charts
  • Comparison Charts
  • Line Graphs
  • PPC Charts
  • Sentiment Analysis Charts
  • Survey Charts

TOP CHARTS

  • Sankey Diagram
  • Likert Scale Chart
  • Comparison Bar Chart
  • Pareto Chart
  • Funnel Chart
  • Gauge Chart
  • Radar Chart
  • Radial Bar Chart
  • Sunburst Chart
  • see more
  • Scatter Plot Chart
  • CSAT Survey Bar Chart
  • CSAT Survey Chart
  • Dot Plot Chart
  • Double Bar Graph
  • Matrix Chart
  • Multi Axis Line Chart
  • Overlapping Bar Chart
  • Control Chart
  • Slope Chart
  • Clustered Bar Chart
  • Clustered Column Chart
  • Box and Whisker Plot
  • Tornado Chart
  • Waterfall Chart
  • Word Cloud
  • see less

RESOURCES

  • Blog
  • Resources
  • YouTube
SIGN UP FOR UPDATES

We wouldn't dream of spamming you or selling your info.

© 2025 ChartExpo, all rights reserved.