Categories
How do I eliminate duplicates in Excel? This question plagues many spreadsheet users daily. Why? Excel, a powerhouse for data management, often becomes cluttered with redundant information.
Duplicate entries can skew analyses, waste storage space, and lead to errors. Removing duplicates is essential for ensuring data integrity and efficiency in Excel.
It is estimated that about 30% of business data becomes outdated every year. This indicates the imperativeness of periodic data cleanup. Excel already has built-in tools to make this easy and quick.


Excel 2007 introduced a ”˜Remove Duplicates’ feature that streamlines the process. It permits the removal of some columns or rows along with all others. Thousands of lines can be processed in seconds, and this means hours instead of days processing that data manually.
A survey of Excel users revealed that 65% weren’t aware of this feature’s full potential. Learning to eliminate duplicates in Excel effectively can boost productivity significantly. Companies report up to 20% time savings in data preparation tasks after mastering this skill.
Excel’s duplicate removal capabilities extend beyond simple deletion. You can highlight duplicates for review before removal. This approach ensures critical data isn’t lost accidentally. Advanced users leverage formulas and VBA scripts for more complex duplicate management scenarios.
Learning how to remove duplicates in Excel is crucial for both data professionals and casual users. In today’s data-centric world, this skill is essential. With enough practice, anyone can effectively clean and optimize their spreadsheets for improved analysis and decision-making.
Let’s get started.
First…
Definition: Duplicate values in Excel are identical entries in a dataset. They occur when the same data appears more than once in a column or row. Duplicates can cause errors in data analysis and calculations. They may include repeated numbers, text, dates, or entire rows.
Identifying and removing duplicates is essential for accurate data processing. Excel offers built-in tools to find and remove these duplicates, ensuring the dataset remains clean and reliable.
Regularly checking for duplicates helps maintain data integrity.
Eliminating duplicate data in Excel is not just a good habit, it’s essential for keeping your work accurate and reliable. Here’s why:
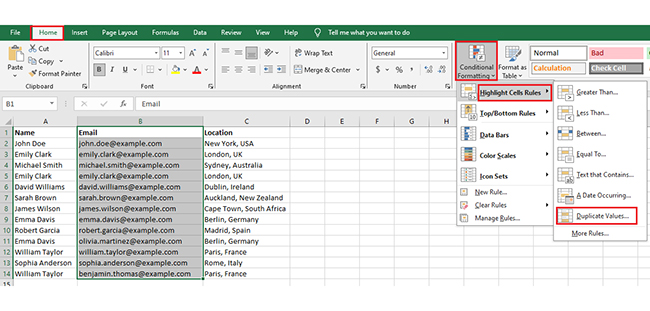
Select the Data Range
Open Conditional Formatting
Choose Duplicate Values
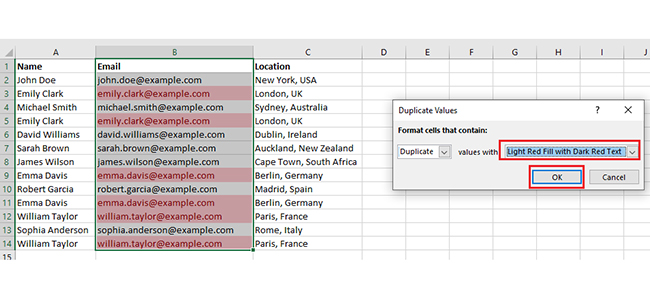
Pick a Formatting Style
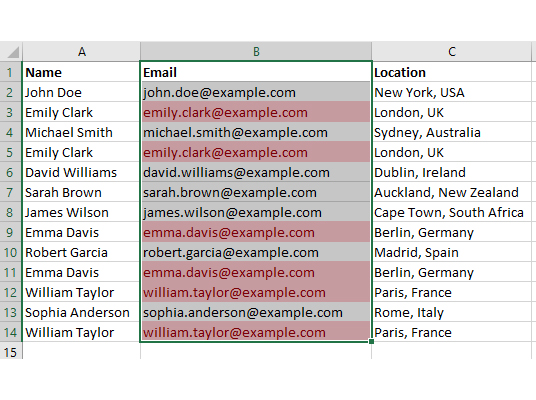
Apply and Confirm
Select the Data Range
Open Remove Duplicates Tool
Choose Columns to Check
Confirm and Remove
View Results
To find duplicates in Excel, use conditional formatting to highlight them:
Here are the steps to use Power Query to remove duplicates in Excel:
Here are two simple ways to automatically remove duplicates in Excel without needing to manually review them first:
Choose a formatting style to highlight duplicates.
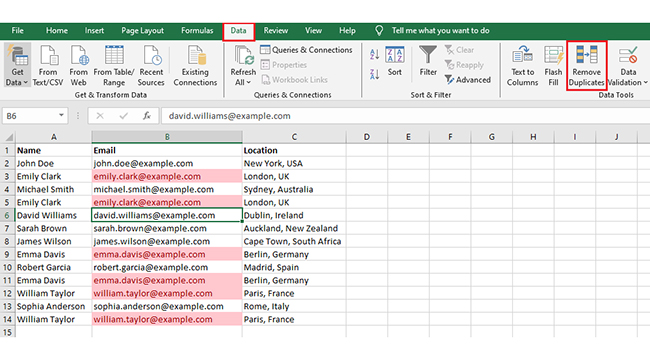
Click and highlight the column or table where you want to remove duplicates. Make sure your data has headers for better selection.
Press Alt + A + M on your keyboard to open the Remove Duplicates window. You can also access it from the Data tab.
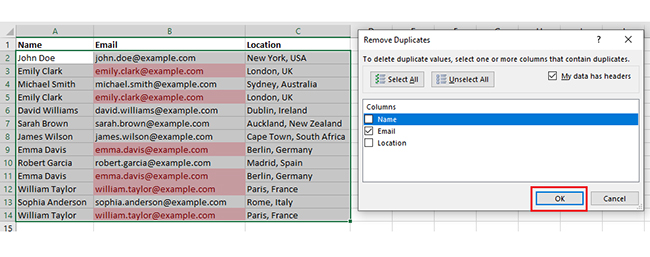
Check or uncheck the columns where you want to find and remove duplicate values. If your data has multiple columns, Excel will compare them accordingly.
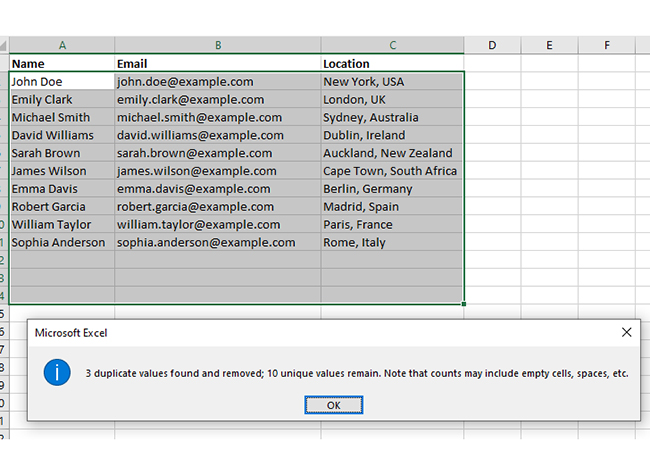
Click OK, and Excel will remove the duplicates. A pop-up message will show how many duplicates were deleted and how many unique values remain.
Data analysis can be a real headache. But don’t worry; we have data visualization, which turns boring numbers into exciting stories.
Excel tries but often falls short. Its charts can be basic, and complex data needs more.
That’s where ChartExpo comes in. It’s Excel’s cool new friend. ChartExpo takes visualization to the next level. It makes unique data pop. No more squinting at rows and columns.
ChartExpo transforms data into clear, compelling visuals. Suddenly, patterns emerge. Trends become obvious. Insights jump out at you.
ChartExpo fills the gap Excel left. Data analysis becomes less of a chore and more of an adventure.
Ready to see your data in a whole new light? Install ChartExpo.
Let’s learn how to install ChartExpo in Excel.
ChartExpo charts are available both in Google Sheets and Microsoft Excel. Please use the following CTAs to install the tool of your choice and create beautiful visualizations with a few clicks in your favorite tool.


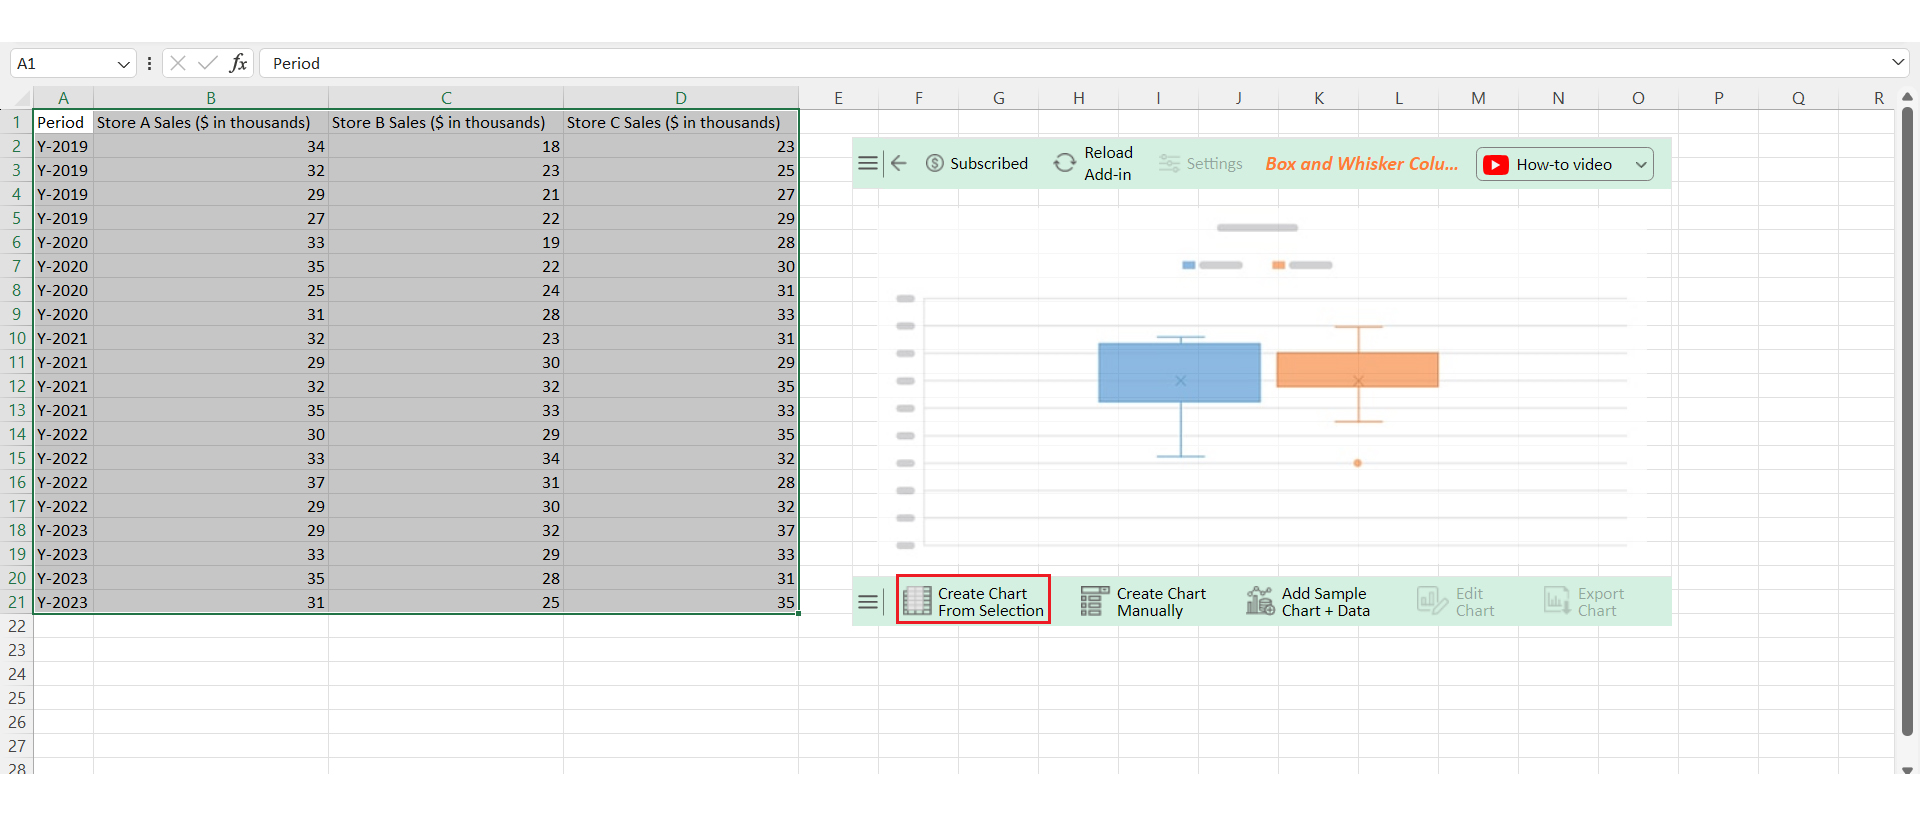
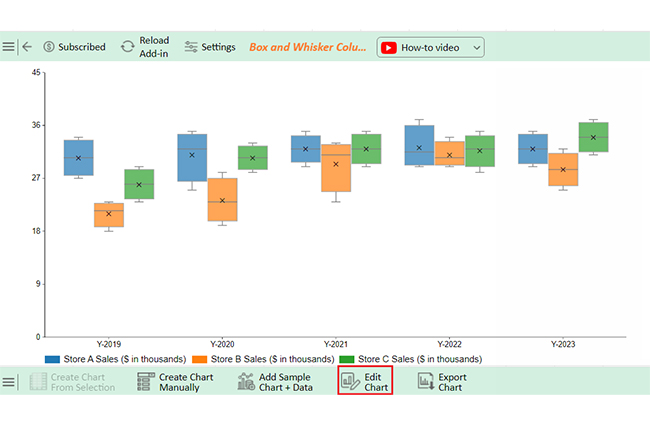
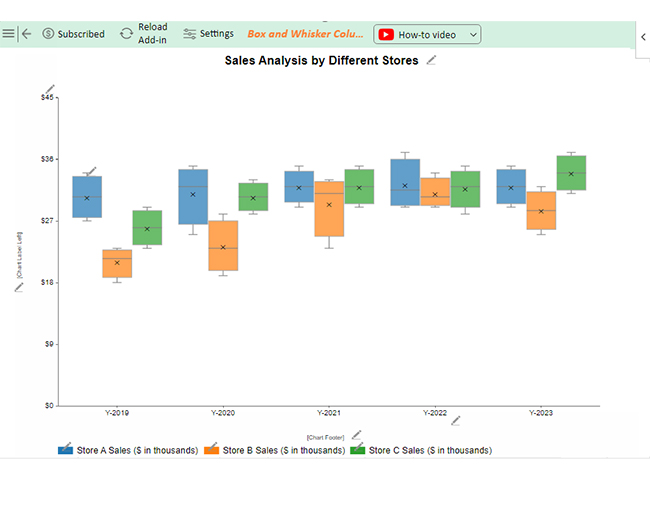
Let’s analyze the data below in Excel using ChartExpo.
| Period | Store A Sales
($ in thousands) |
Store B Sales
($ in thousands) |
Store C Sales
($ in thousands) |
| Y-2019 | 34 | 18 | 23 |
| Y-2019 | 32 | 23 | 25 |
| Y-2019 | 29 | 21 | 27 |
| Y-2019 | 27 | 22 | 29 |
| Y-2020 | 33 | 19 | 28 |
| Y-2020 | 35 | 22 | 30 |
| Y-2020 | 25 | 24 | 31 |
| Y-2020 | 31 | 28 | 33 |
| Y-2021 | 32 | 23 | 31 |
| Y-2021 | 29 | 30 | 29 |
| Y-2021 | 32 | 32 | 35 |
| Y-2021 | 35 | 33 | 33 |
| Y-2022 | 30 | 29 | 35 |
| Y-2022 | 33 | 34 | 32 |
| Y-2022 | 37 | 31 | 28 |
| Y-2022 | 29 | 30 | 32 |
| Y-2023 | 29 | 32 | 37 |
| Y-2023 | 33 | 29 | 33 |
| Y-2023 | 35 | 28 | 31 |
| Y-2023 | 31 | 25 | 35 |


Removing duplicates ensures data integrity, preventing miscalculations and inconsistencies in reports and analysis.
Streamlining data eliminates redundancy, making it easier to navigate, sort, and analyze large datasets.
Eliminating unnecessary records reduces file size, improving Excel’s performance and preventing slowdowns.
Clean, unique data allows for more accurate insights, reducing confusion caused by repeated values that may distort results.
Ensures reports reflect valid data, leading to better business strategies and more informed decision-making.
Avoids errors in calculations, such as sum totals or averages, that may be inflated by duplicate entries.
Ensures charts and graphs represent accurate figures without unnecessary repetition, leading to clearer insights.
Dealing with duplicate entries in Excel can be frustrating. But with a few smart strategies, you can keep your data clean and accurate. Here are some tips to help you eliminate duplicates efficiently:
Yes, you can remove duplicates from multiple columns simultaneously. Use functions like drop_duplicates() in Python’s pandas or REMOVE DUPLICATES in Excel. Specify the columns where duplicates should be checked, and the function will handle them together.
Yes, you can remove duplicates without deleting data by creating a filtered view or copying the unique data to a new location. Tools like Excel’s “Advanced Filter” or Python’s Pandas can help preserve the original dataset.
To remove duplicates while retaining the original order, use tools like Python’s pandas drop_duplicates(keep=’first’) or Excel’s “Remove Duplicates” without sorting. These methods keep the first occurrence of each unique entry and maintain the initial order.
Eliminating duplicates in Excel is crucial for maintaining accurate and reliable data. It ensures your calculations and analyses are based on clean, consistent information. This practice enhances the quality of your work and improves efficiency.
By using Excel’s built-in tools, such as the Remove Duplicates feature, you can quickly identify and delete redundant entries. These tools are easy to use and can save you a lot of time. Formulas like COUNTIF also help in spotting duplicates, providing an additional layer of accuracy.
Regularly checking your data for duplicates is essential. It prevents errors from accumulating and keeps your datasets streamlined. Routine checks are a simple yet effective way to maintain data integrity.
Learning more about Excel’s features can greatly improve your ability to manage data. Exploring advanced tools like Power Query can offer even more control over your datasets. Knowledge is key to avoiding duplicate-related issues.
In summary, eliminating duplicates is a critical step in data management. It leads to more accurate results, efficient workflows, and a higher level of confidence in your data.
How much did you enjoy this article?


Learn how to use sparklines in Excel to quickly visualize trends inside cells. Discover types, creation steps, customization, use cases, benefits, and best practices.

Learn what a confidence interval graph is, how to create it in Excel, and how to interpret results to make more reliable, data-driven decisions.

A correlation matrix in Excel helps identify relationships between variables. Learn how to create, read, and use it for effective data analysis.


