• Home
  • Tools dropdown img
    • Spreadsheet Charts

      • ChartExpo for Google Sheets
      • ChartExpo for Microsoft Excel
    • Power BI Charts

      • Power BI Custom Visuals by ChartExpo
    • Word Cloud

  • Charts dropdown img
    • Chart Category

      • Bar Charts
      • Circle Graphs
      • Column Charts
      • Combo Charts
      • Comparison Charts
      • Line Graphs
      • PPC Charts
      • Sentiment Analysis Charts
      • Survey Charts
    • Chart Type

      • Box and Whisker Plot
      • Clustered Bar Chart
      • Clustered Column Chart
      • Comparison Bar Chart
      • Control Chart
      • CSAT Survey Bar Chart
      • CSAT Survey Chart
      • Dot Plot Chart
      • Double Bar Graph
      • Funnel Chart
      • Gauge Chart
      • Likert Scale Chart
      • Matrix Chart
      • Multi Axis Line Chart
      • Overlapping Bar Chart
      • Pareto Chart
      • Radar Chart
      • Radial Bar Chart
      • Sankey Diagram
      • Scatter Plot Chart
      • Slope Chart
      • Sunburst Chart
      • Tornado Chart
      • Waterfall Chart
      • Word Cloud
    • Google Sheets
      Microsoft Excel
  • Services
  • Pricing
  • Contact us
  • Blog
  • Support dropdown img
      • Gallery
      • Videos
      • Contact us
      • FAQs
      • Resources
    • Please feel free to contact us

      atsupport@chartexpo.com

Categories
All Data Visualizations Data Analytics Surveys
Add-ons/
  • Google Sheets
  • Microsoft Excel
  • Power BI
All Data Visualizations Data Analytics Surveys
Add-ons
  • Google Sheets
  • Microsoft Excel
  • Power BI

We use cookies

This website uses cookies to provide better user experience and user's session management.
By continuing visiting this website you consent the use of these cookies.

Ok

ChartExpo Survey


Home > Blog > Google Sheets

Google Sheets as a Database for Insightful Reports

“Can I use Google Sheets as a database?” More people are asking this question as businesses and teams look for flexible, low-cost tools to manage information. Small businesses use Google Sheets to monitor sales and stock.

Google Sheets as a Database

Why? It’s accessible and it updates in real time. Anyone with a Gmail account can collaborate instantly. With functions, filters, and add-ons, spreadsheets power up data analysis.

You can create a dashboard in Google Sheets to visualize performance metrics or team progress. Live dashboards—from sales to projects—are why you choose Sheets.

Traditional databases require setup, hosting, and often a developer. Google Sheets as a database removes many of those hurdles. You don’t need to know SQL to get started. You can sort, filter, and connect data across tabs or even different files – it’s fast and intuitive.

It doesn’t matter whether you’re tracking leads, orders, or team tasks. Inventory tracking in Google Sheets offers a real-time solution without the overhead of expensive software.

More people demand tools that are easy to use and instantly accessible. As a result, Google Sheets continues to grow in popularity as a database. If your team already uses Sheets, you’re closer to building a data-driven system than you think.

This post explores what that means — how it works, when it works best, and how to make the most of it.

Let’s get right into it…

Table of Contents:

  1. What is a Google Sheets Database?
  2. Why Use Google Spreadsheets as a Database?
  3. When Should You Consider Google Sheets as a Database?
  4. How Many Ways to Use Google Sheets as a Database?
  5. How to Set Up a Database in Google Sheets?
  6. How to Use Google Spreadsheets as Database Reporting?
  7. When Not to Use Google Sheets as a Database?
  8. Limitations of Google Sheets as a Database
  9. Tips for Using Google Sheets Database
  10. FAQs
  11. Wrap Up

What is a Google Sheets Database?

Definition: A Google Sheets database is a spreadsheet that stores, organizes, and manages structured data. It allows you to input, sort, and filter information efficiently. With Google Spreadsheet integration, you can connect data from forms, APIS, or other tools. This setup helps automate tasks and centralize information.

Google Sheets lets you run formulas, link sheets, and share live data. It’s a simple, accessible way to manage data without traditional database software.

Top 10 Charts to Show When Using Google Sheets as a Database

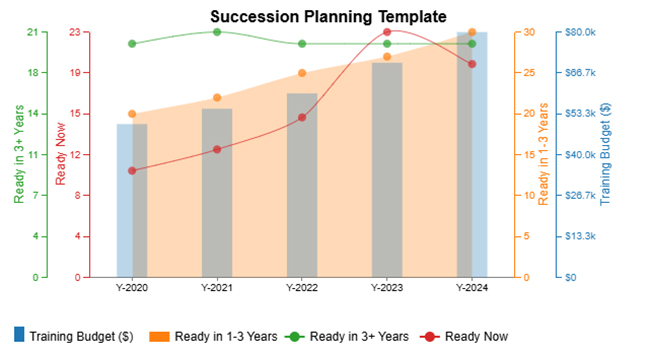
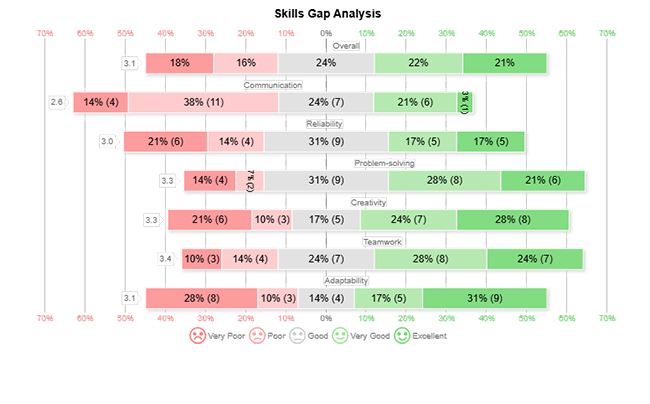
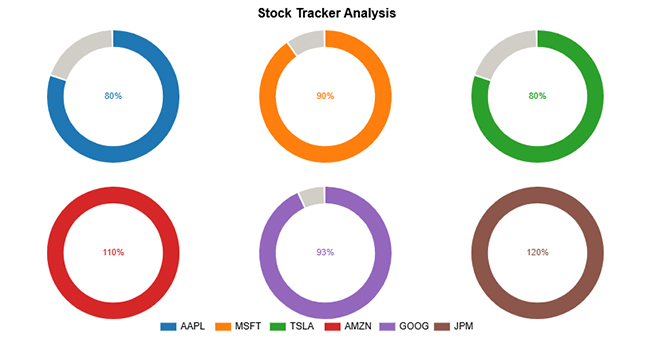
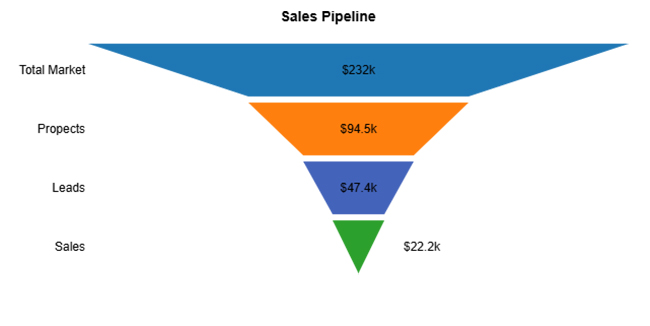
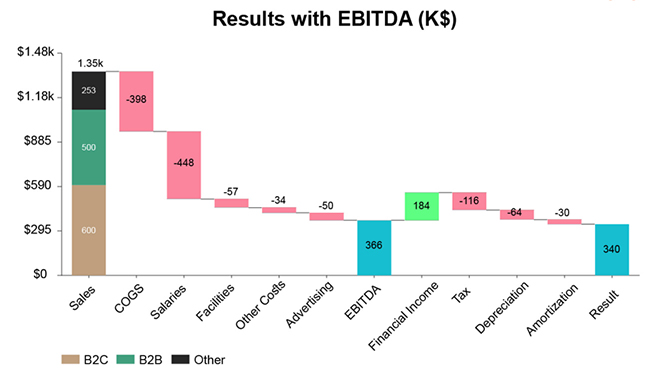
Are you looking to turn your Google Sheets data into powerful visual insights? Check out the Top 10 Charts to use when visualizing your spreadsheet as a database.

These charts were designed using ChartExpo. ChartExpo is a simple yet powerful charting tool that makes it easy to transform raw data into compelling visuals.

Multi Axis Line Chart:

Google Sheets as a Database

Likert Scale Chart:

Google Sheets as a Database

Circular Org Chart:

Google Sheets as a Database

Progress Circle Chart:

Google Sheets as a Database

Funnel Chart (aka Pyramid Chart)

Google Sheets as a Database

Slope Chart:

Google Sheets as a Database

Horizontal Waterfall Chart:

Google Sheets as a Database

Progress Chart:

Google Sheets as a Database

Stacked Waterfall Chart:

Google Sheets as a Database

Sankey Diagram:

Google Sheets as a Database

Why Use Google Spreadsheets as a Database?

Why are so many teams using Google Sheets as a database? The answer is simple—it works without the hassle. No setup. No software installs. You open a tab, and you’re ready to go:

  • Ease of use: You don’t need technical skills to start. Functions, filters, and conditional formatting are easy to apply with a few clicks.
  • Accessibility and collaboration: You can edit and view data from anywhere with an internet connection. Knowledge of how to share a Google Sheet helps teams collaborate in real time—no endless files.
  • Cost-effective: Google Sheets is free for most users and is included in Google Workspace. It eliminates the need for costly database software or IT support.
  • Integration capabilities: With Google Spreadsheet integration, you can connect to tools like Google Forms, Zapier, and external APIS. This enables automated data collection, syncing, and reporting.
  • Quick prototyping: Need a working model fast? You can build and test a database idea using familiar spreadsheet tools within minutes.
  • Backup and export options: Data is automatically saved in the cloud and can be restored with version history. For added flexibility, you can export your sheet to CSV, Excel, or PDF formats anytime.

When Should You Consider Google Sheets as a Database?

Not every project needs a full-blown database. Sometimes, you only need a smart, simple place to manage data. That’s where Google Sheets as a database makes sense. It’s fast, familiar, and doesn’t require a developer on call.

Here are some of the situations when you can consider using it:

  • Small to medium data sets: Google Sheets handles it well if you work with a few hundred or a thousand rows. It’s perfect for tracking customer info, inventory, or leads.
  • Real-time collaboration matters: Do you need your team to view or update data at the same time? With Google Sheets, collaboration is instant and seamless.
  • You need something quickly: Whether it’s a pitch, demo, or test, Google Sheets lets you spin up a working model fast. You won’t waste hours on setup or configuration.
  • Low or no budget: You don’t need to buy new software. Google Sheets functionality gives you a surprising amount of power for free or cheaply.
  • Integration is important. Do you need to connect forms, CRMS, or other tools? Google Spreadsheet integration with add-ons and APIS makes this possible without complex systems.
  • Simple analytics or reporting: You can build dashboards, apply filters, or easily create pivot tables. It’s a visual powerhouse and helps teams stay informed.

How Many Ways to Use Google Sheets as a Database?

Do you think a spreadsheet is only suitable for crunching numbers? Think again. There are multiple ways to turn a Google Sheet into a working, dynamic database. Whether you’re tech-savvy or prefer drag-and-drop tools, there’s a method that fits your style.

Let’s explore how to use a simple sheet for serious data work.

  • Manual data entry and management: This is the most basic approach. Type in your data, sort it, filter it, and manage it directly with built-in tools.
  • Google Apps Script: Use custom scripts to automate workflows, create triggers, or process data. It brings advanced features to your fingertips without leaving the spreadsheet.
  • API Access via Google Sheets API: This is ideal for developers. Pull or push data from other platforms using the API to keep your sheet connected and updated in real time.
  • Integration with no-code tools: Use platforms like Zapier, Make, or Glide. These tools allow you to automate tasks, connect apps, and build systems without writing code.
  • As a backend for prototypes: Are you testing an app or an MVP? Use a sheet as your backend to store data while keeping things fast and simple.
  • Third-party plugins: Extensions and add-ons can transform your sheet into a complete data engine. From form connectors to analytics dashboards, plugins expand your options fast.

How to Set Up a Database in Google Sheets?

Building a database doesn’t have to start with servers and code. Sometimes, all you need is a spreadsheet and a smart setup. Are you wondering how to use Google Sheets to manage your data? Follow these steps:

  1. Create a new Google Sheet: Open Google Sheets from your browser. You can start with a fresh sheet or use a template.
  2. Define column headers: Think of headers as your database fields. Use clear, consistent names like “Name,” “Date,” or “Status”.
  3. Input or import data: You can type data manually or import it from other sources. You can use CSV files, copy-paste, or connect forms.
  4. Apply data validation (optional): Prevent mistakes by setting rules. For example, allow only dates in a “Due Date” column or use drop-downs for fixed options.
  5. Protect important ranges: Lock key cells to prevent accidental edits. This is especially useful when working with teams.
  6. Share and set permissions: Learn how to share a Google Sheet and set permissions properly—view-only access, editing rights, or restricted ranges. Then, share it with your ideal audience, whether individuals or groups.
  7. Connect with Apps Script or APIS: Use Google Sheets functionality to go further. It automates tasks, syncs data from other platforms, or triggers alerts using Google Apps Script.

How to Use Google Spreadsheets as Database Reporting?

Have you ever tried turning a simple spreadsheet into a robust database? It sounds easy until you realize your data looks like a tangled mess.

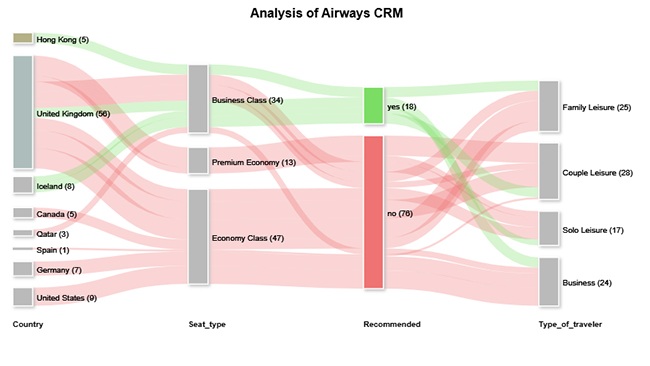
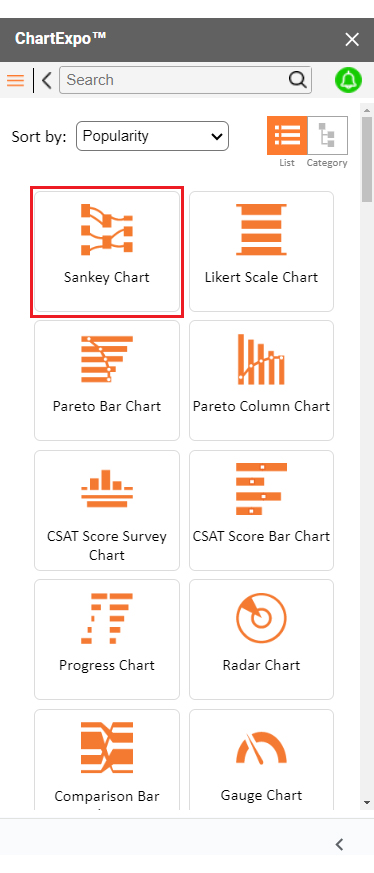
Data visualization is key to understanding numbers, but Google Sheets often fails to deliver basic charts. Enter ChartExpo, a tool that transforms dull sheets into colorful, insightful dashboards.

If Google Sheets leaves you staring at bland graphs, ChartExpo is here to change the game.

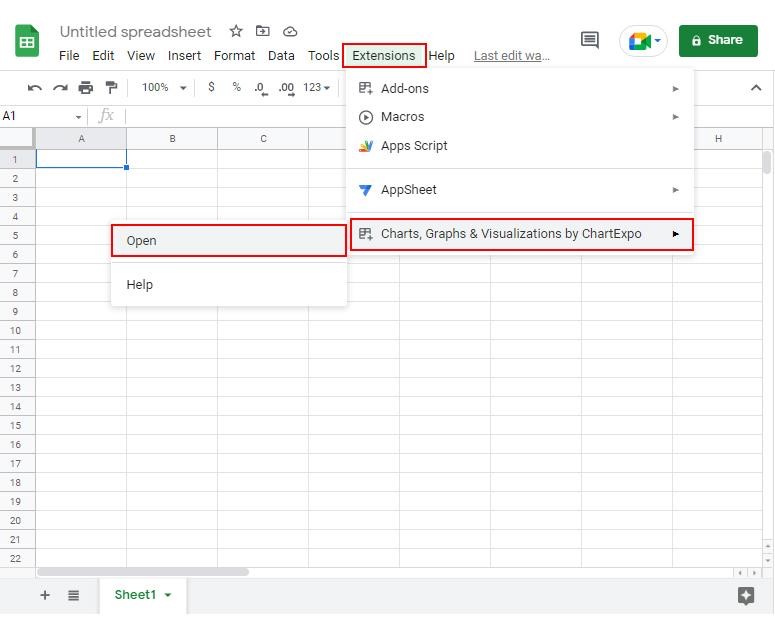
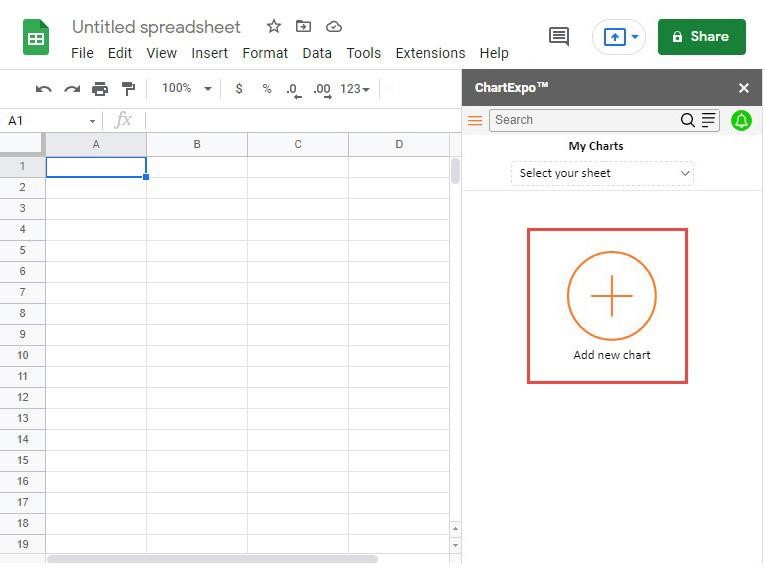
How to Install ChartExpo in Google Sheets?

  1. To start using ChartExpo, download it directly from the Google Sheets program. To do this, select Extensions from the top toolbar.
  2. A menu will appear. Click the Get add-ons option.
  3. Search for ChartExpo, and click on Charts, Graphs & Visualizations by ChartExpo when it appears in the results.
  4. Click the Install button. You will have to confirm your Google account and accept some permissions.

ChartExpo charts are available both in Google Sheets and Microsoft Excel. Please use the following CTAs to install the tool of your choice and create beautiful visualizations in a few clicks in your favorite tool.
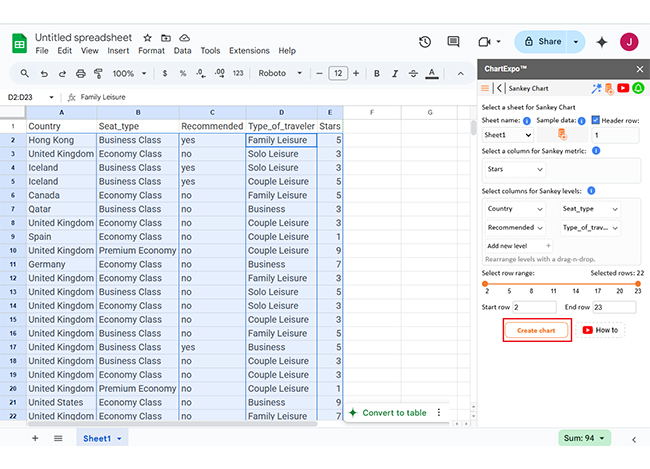
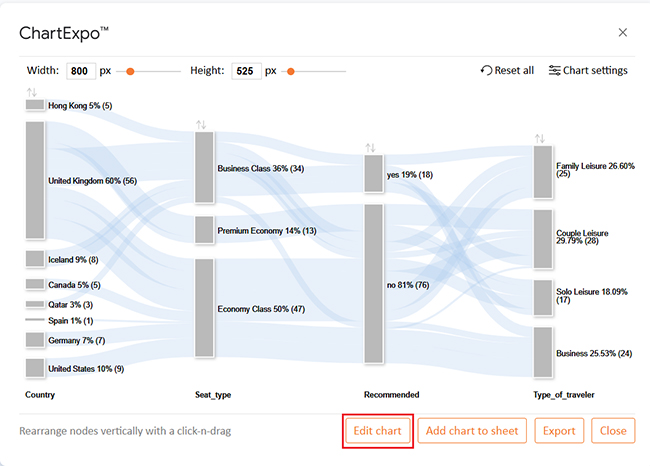
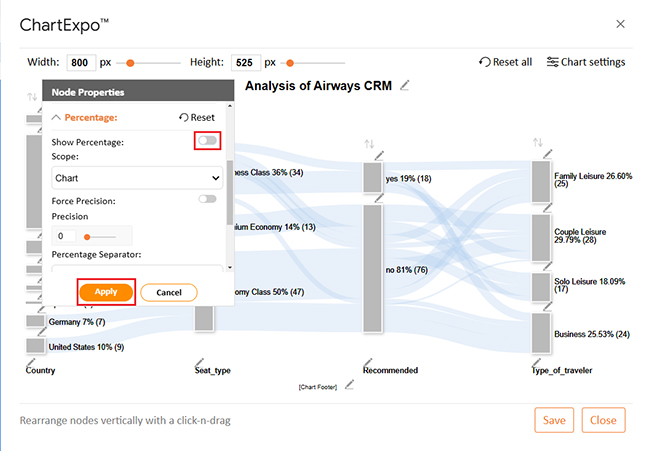
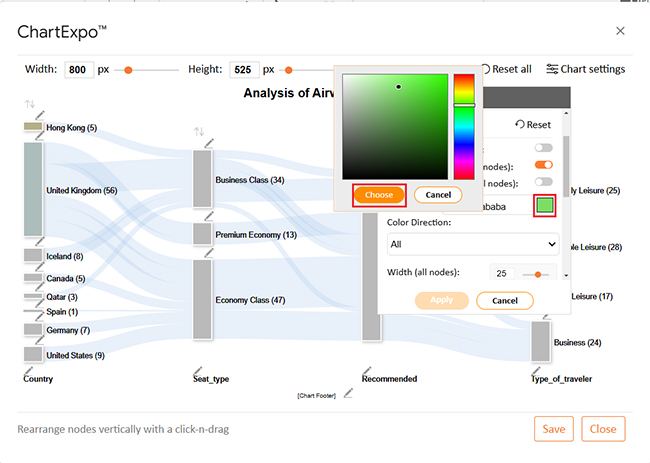
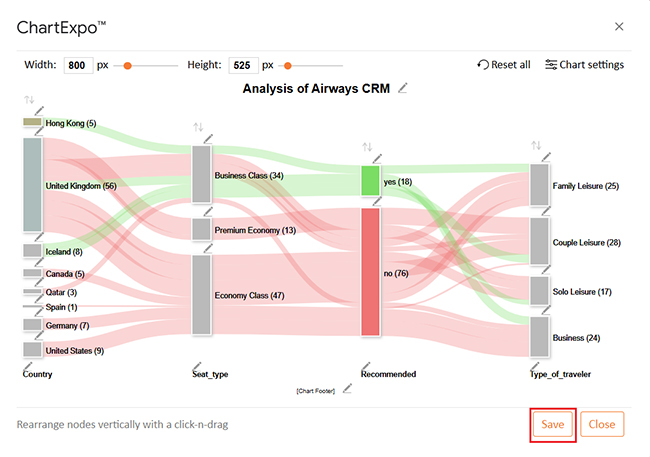
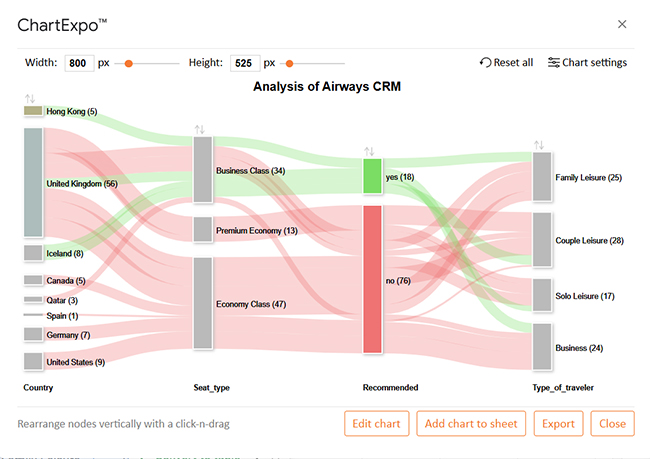
Example

Let’s analyze this sample data in Google Sheets using ChartExpo.

Country Seat_type Recommended Type_of_traveler Stars
Hong Kong Business Class yes Family Leisure 5
United Kingdom Economy Class no Solo Leisure 3
Iceland Business Class yes Solo Leisure 3
Iceland Business Class yes Couple Leisure 5
Canada Economy Class no Family Leisure 5
Qatar Business Class no Business 3
United Kingdom Economy Class no Couple Leisure 3
Spain Economy Class no Couple Leisure 1
United Kingdom Premium Economy no Couple Leisure 9
Germany Economy Class no Business 7
United Kingdom Economy Class no Family Leisure 3
United Kingdom Business Class no Solo Leisure 5
United Kingdom Economy Class no Solo Leisure 3
United Kingdom Economy Class no Couple Leisure 3
United Kingdom Business Class no Family Leisure 5
United Kingdom Business Class yes Business 5
United Kingdom Business Class no Couple Leisure 3
United Kingdom Economy Class no Couple Leisure 3
United Kingdom Premium Economy no Couple Leisure 1
United States Economy Class no Business 9
United Kingdom Economy Class no Family Leisure 7
United Kingdom Premium Economy no Solo Leisure 3
  • To get started with ChartExpo, install ChartExpo in Google Sheets.
  • Go to Extensions > Charts, Graphs & Visualizations by ChartExpo > Open.
Google Sheets as a Database
  • To access the charts library, click the Add new chart button.
Google Sheets as a Database
  • Once ChartExpo is loaded. Click on “Sankey Chart”.
Google Sheets as a Database
  • First, insert the data table into the sheet. Then, select the Sheet name from the drop-down menu in the ChartExpo section.
  • Select the metric column; metric is the numeric column in your data sheet.
  • Select the dimensions column; the dimension is the categorical column in your datasheet that contains text information.
  • Click the Create chart button to complete the process.
Google Sheets as a Database
  • ChartExpo will generate the visualization below for you.
Google Sheets as a Database
  • If you want to have the chart’s title, click Edit Chart, as shown in the above image.
  • Click the pencil icon next to the Chart Header to change the title.
  • It will open the properties dialog. Under the Text section, you can add a heading in Line 1 and enable Show.
  • Give the appropriate title of your chart and click the Apply button.
Google Sheets as a Database
  • You can disable the percentage value as follows:
Google Sheets as a Database
  • You can add color in Nodes and set the direction as follows:
Google Sheets as a Database
  • Click the “Save Changes” button to persist the changes.
Google Sheets as a Database
  • Your final chart will appear as follows.
Google Sheets as a Database

Insights

  • Business Class is highly recommended, especially for Family and Solo Leisure travelers.
  • The United Kingdom appears most frequently, mainly in Economy Class with lower star ratings.
  • Premium Economy shows mixed ratings, reflecting varied traveler experiences.

When Not to Use Google Sheets as a Database?

Sometimes, the simplest tools aren’t the best tools. Spreadsheets can do a lot, but not everything. If your needs grow past a certain point, it might start to show its limits. So, knowing when not to use them can save you time and headaches.

Here’s when to think twice:

  • You’re handling large volumes of data: Performance drops fast if you’re dealing with hundreds of thousands of rows. Sheets may lag, crash, or lock up entirely.
  • You need advanced security: Basic sharing controls are helpful. But if you need role-based access, encryption, or strict audit trails, it’s not enough.
  • You’re running complex relationships: Spreadsheets aren’t built for relational data. Joining tables or building many-to-many relationships gets messy fast.
  • High-concurrency environments: If 20+ people need to edit simultaneously, errors and overwrites can happen. Collaboration works—but only up to a point.
  • Strict data validation required: While you can use drop-downs and formulas, spreadsheets aren’t great at enforcing rules across multiple sheets or files.
  • You need real-time sync with multiple systems. Basic integrations exist, but they are limited. A real database is better for heavy automation or syncing across platforms.

Limitations of Google Sheets as a Database

Spreadsheets are fast, free, and flexible, but they have flaws. Using them as a database works great—until it doesn’t. These limits start to show especially when scaling up or managing complex systems.

Here’s what to watch out for:

  • Size and speed limitations: Google Sheets can handle up to 10 million cells, but performance drops with large datasets. Read/write actions slow down, especially with complex formulas or frequent edits.
  • Limited collaboration at scale: It’s built for teams, but not high-traffic environments. Too many users editing at once can lead to sync issues or overwritten data.
  • Basic security features: You can protect cells and share files without advanced role-based access or encryption. It’s not suitable for sensitive or regulated data.
  • No relational or advanced query support: Spreadsheets don’t support genuine database relationships. You can’t easily link tables or run powerful, structured queries like SQL.
  • Scalability and API Quotas: It’s not made for heavy backend systems. API calls are limited daily, and automation stops cold once you hit those quotas.

Tips for Using Google Sheets Database

Using Google Sheets as a database can be powerful if you follow innovative practices. Planning goes a long way in keeping your data organized and efficient. Here are some tips to help you get the most out of your spreadsheet setup.

  • Keep data clean and organized: Each record should have clear, consistent headers and a unique ID. Organize related data on separate sheets to avoid clutter.
  • Limit your data size: Stay within manageable row limits to keep performance smooth. Large datasets slow things down and cause delays.
  • Automate repetitive tasks: Use Apps Script to handle routine updates or complex calculations. Automation saves time and reduces errors.
  • Control access carefully: Set proper permissions to protect your data. Share with specific people and restrict editing where necessary.
  • Connect with other tools: Integrate your sheet with APIS or no-code platforms to expand functionality. This helps keep data flowing and systems in sync.

FAQs

Can you use a Google Sheet as a database?

Yes, you can use it as a simple database. It works well for small—to medium-sized data entry, record storage, and management. It’s great for basic tracking and lightweight projects.

Does Google offer a database tool?

Google doesn’t have a traditional database tool like MySQL. However, it offers Firebase for real-time databases and BigQuery for large-scale analytics. These tools handle complex queries and big data much better than spreadsheets.

Wrap Up

A Google Sheets database is a simple way to store and manage data. It’s fast to set up, easy to use, and flexible enough for many tasks.

You can organize contacts, track projects, or log sales. For visual insights, use Google Charts to turn raw data into clear visuals. Charts help you spot trends faster; they make data easier to explain.

Need to clean up your sheet? Use Google Sheets’ remove duplicates feature. It keeps your database accurate, with no repeated entries.

Want to build reports? Learn how to create a chart in Google Sheets. It takes only a few clicks and adds real power to your spreadsheet. You’ll turn boring rows into easy-to-read visuals.

Don’t forget task management. A Google Sheet to-do list template can track deadlines and goals. It fits right into your database—one tool for many jobs.

Google Sheets is more than a grid. With clever use, it can become a lightweight database, tracker, and visualizer—all in one place.

Need more functionality? Install ChartExpo to take your Google Sheets database even further.

How much did you enjoy this article?

GSAd1
Start Free Trial!
152587

Related articles

next previous
Google Sheets12 min read

Google Sheet Lookup Table: A Complete Guide

A Google Sheet lookup table helps link and organize data fast. Click here to learn how to build, use, and troubleshoot lookup tables in Google Sheets.

Google Sheets10 min read

Google Sheet Travel Itinerary Template: A Visual Layout

A Google Sheet travel itinerary template helps you plan and track your trips. Learn how to create and customize templates for better travel organization.

Google Sheets10 min read

Forecasting in Google Sheets: A Complete Walkthrough

Forecasting in Google Sheets helps you predict trends using past data. Click here for simple steps, tools, and charts to improve planning and decision-making.

Google Sheets10 min read

Project Tracking in Google Sheets: A Visual Walkthrough

Project tracking in Google Sheets helps manage tasks and deadlines in one place. This guide shows how to build, use, and improve trackers with smart visuals.

Google Sheets8 min read

Google Sheets Add-Ons for Modern Spreadsheet Users

Google Sheets add-ons make your spreadsheets more powerful. This guide covers the top add-ons, the best for data analysis, and how to install and use them.

ChartExpo logo

Turn Data into Visual
Stories

CHARTEXPO

  • Home
  • Gallery
  • Videos
  • Services
  • Pricing
  • Contact us
  • FAQs
  • Privacy policy
  • Terms of Service
  • Sitemap

TOOLS

  • ChartExpo for Google Sheets
  • ChartExpo for Microsoft Excel
  • Power BI Custom Visuals by ChartExpo
  • Word Cloud

CATEGORIES

  • Bar Charts
  • Circle Graphs
  • Column Charts
  • Combo Charts
  • Comparison Charts
  • Line Graphs
  • PPC Charts
  • Sentiment Analysis Charts
  • Survey Charts

TOP CHARTS

  • Sankey Diagram
  • Likert Scale Chart
  • Comparison Bar Chart
  • Pareto Chart
  • Funnel Chart
  • Gauge Chart
  • Radar Chart
  • Radial Bar Chart
  • Sunburst Chart
  • see more
  • Scatter Plot Chart
  • CSAT Survey Bar Chart
  • CSAT Survey Chart
  • Dot Plot Chart
  • Double Bar Graph
  • Matrix Chart
  • Multi Axis Line Chart
  • Overlapping Bar Chart
  • Control Chart
  • Slope Chart
  • Clustered Bar Chart
  • Clustered Column Chart
  • Box and Whisker Plot
  • Tornado Chart
  • Waterfall Chart
  • Word Cloud
  • see less

RESOURCES

  • Blog
  • Resources
  • YouTube
SIGN UP FOR UPDATES

We wouldn't dream of spamming you or selling your info.

© 2025 ChartExpo, all rights reserved.