Categories
Why is the Google Sheet profit and loss template critical? Managing finances can be challenging, especially for small businesses and startups. Yet, financial clarity is essential for success. This template offers a simple way to track income, expenses, and profits.
A Google Sheet profit and loss template helps address this by providing real-time visibility into financial performance. It integrates well with 3-statement financial modeling, offering deeper insights into your business.


Imagine knowing exactly where your money goes every month. This template allows you to spot trends, identify savings opportunities, and set realistic goals. When paired with a digital dashboard, it turns data into actionable visuals that drive smarter decisions.
Accurate financial records are not just useful but also essential. Investors and stakeholders expect transparency. P&L templates and AI for data analytics provide precise reporting and valuable insights for financial reviews and funding opportunities.
The P&L template in Google Sheets saves time and reduces errors compared to manual calculations. Whether you’re managing a startup or a side hustle, this tool can simplify your financial planning.
By using it, you gain control over your business’s financial health. That control can mean the difference between growth and struggle.
First…
Definition: A profit and loss statement template in Google Sheets helps monitor a business’s revenues and costs. It determines profits by subtracting costs from revenue. This flexible and user-friendly template makes it perfect for companies of any size.
Google Sheets allows access from anywhere. Updates happen in real-time, ensuring accurate financial tracking. The template is helpful when preparing a profit and loss statement for a small business. Why? It’s easy, quick, and ensures clear insights.
The template organizes data, highlights trends, and simplifies decision-making. It’s a practical tool for managing finances efficiently and preparing for tax or investor reporting.
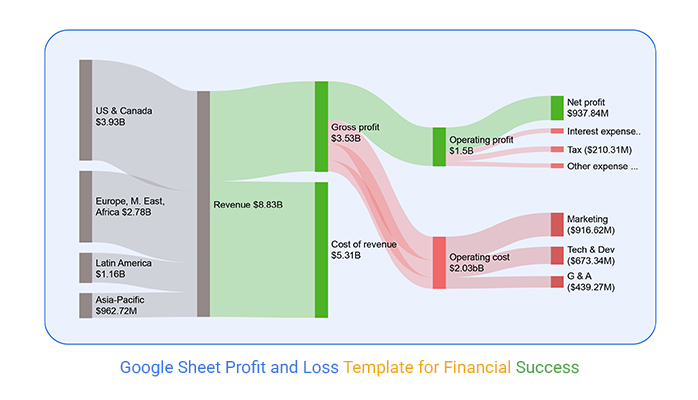
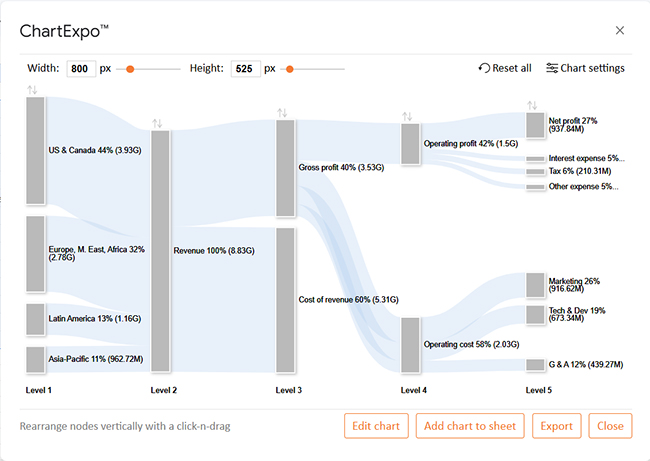
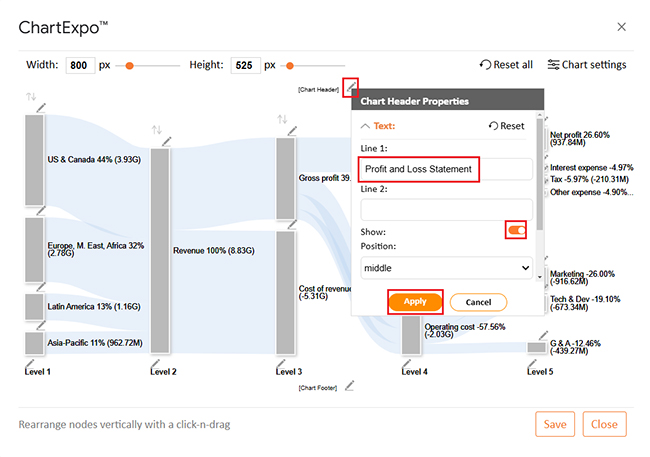
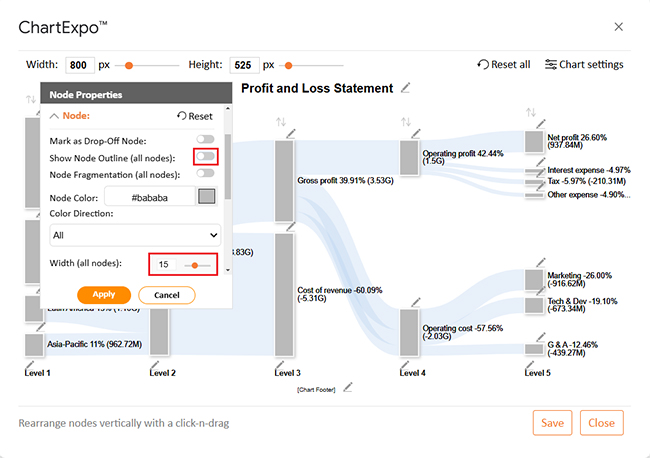
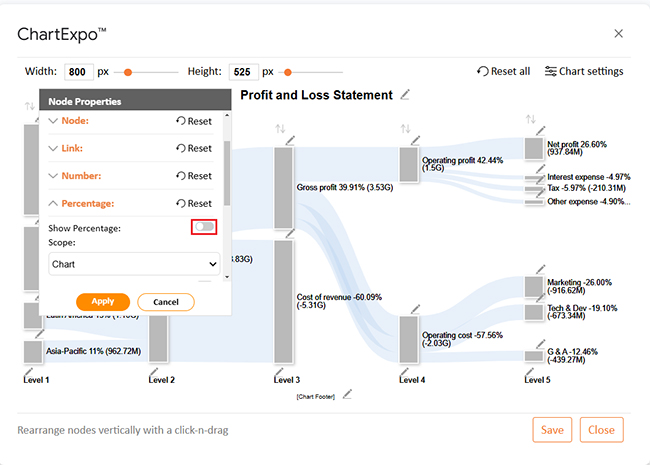
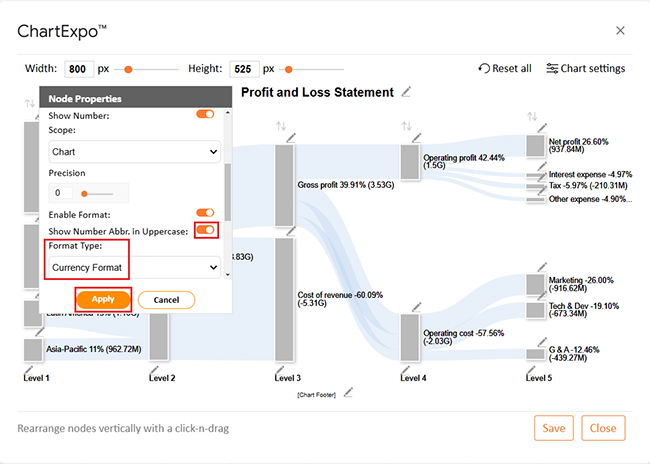
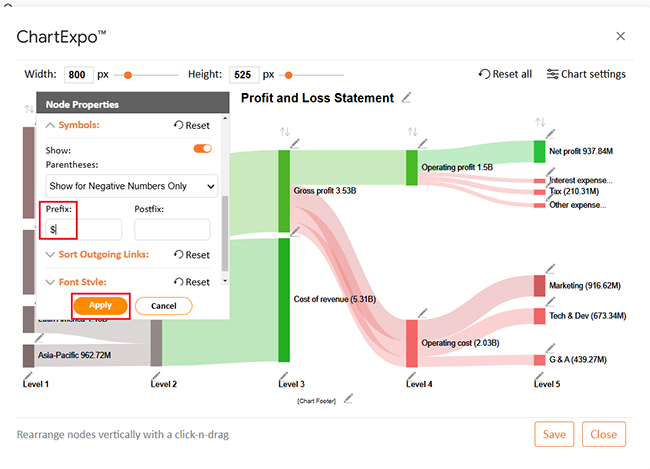
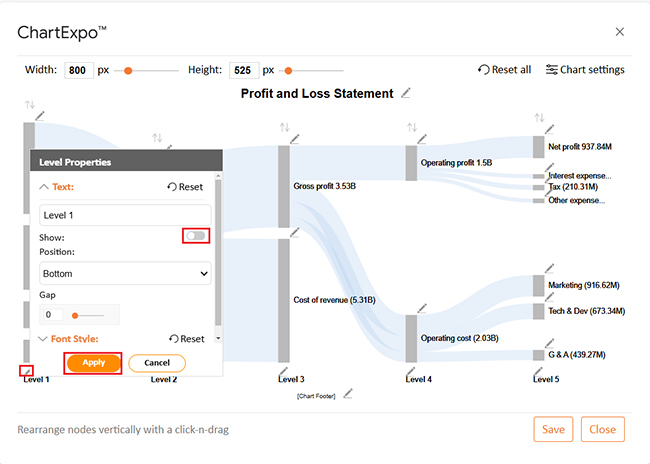
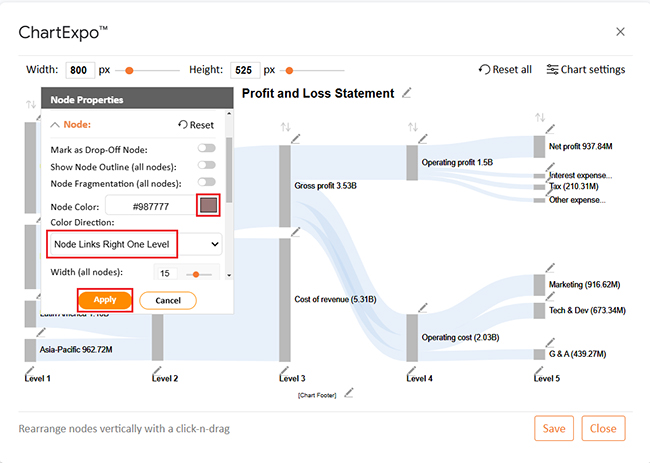
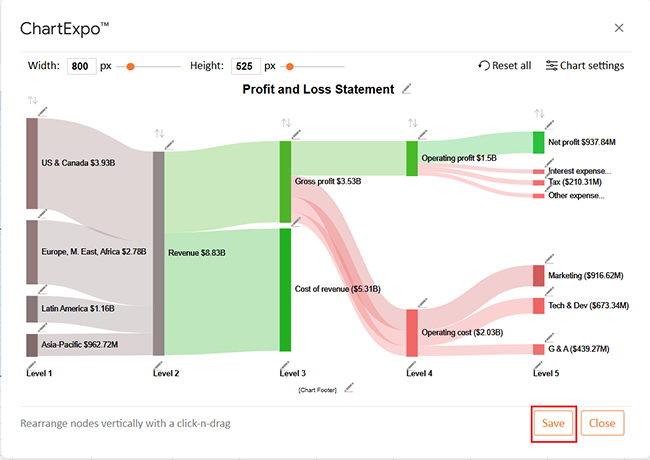
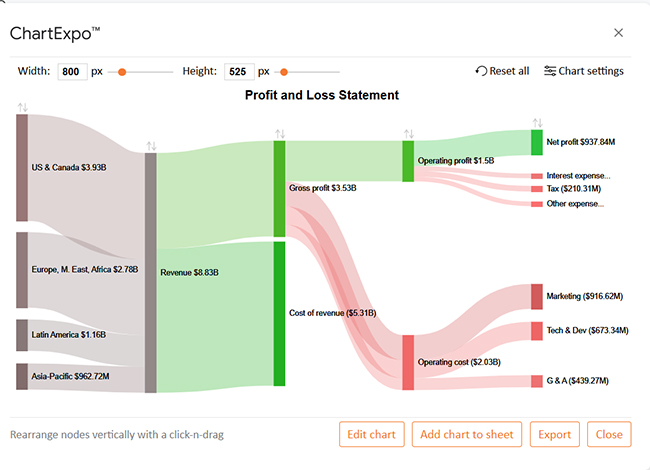
Visualizing Financial Flow with a Sankey Diagram Maker Based on a Google Sheets Profit and Loss Template
Visualizing Financial Flow with a Sankey diagram in Google Sheets Based on a Google Sheets Profit and Loss Template
Tracking finances can be overwhelming in this era of information overload. However, the Google Sheet profit and loss template simplifies the process. It’s innovative, efficient and effective.
How?
Your profit and loss statement is the story of your business’s financial health. It shows where your money is coming from, where it’s going, and what’s left. Let’s break it down:
Profit and loss templates in Google Sheets are not one-size-fits-all. Whether you’re managing a small startup or a growing business, there’s a template to fit your needs. Here are the popular options:
Why does the Google Sheets profit and loss template matter?
Simple—it organizes your numbers and gives you clarity.
But here’s the real value: data-driven decision-making. Turning raw data into insights is crucial, and Excel often struggles to make it visually compelling. That’s where ChartExpo comes in. This chart maker transforms your Google Sheets into a powerhouse of insightful, easy-to-read visuals and is considered the best graph to show profit and loss.
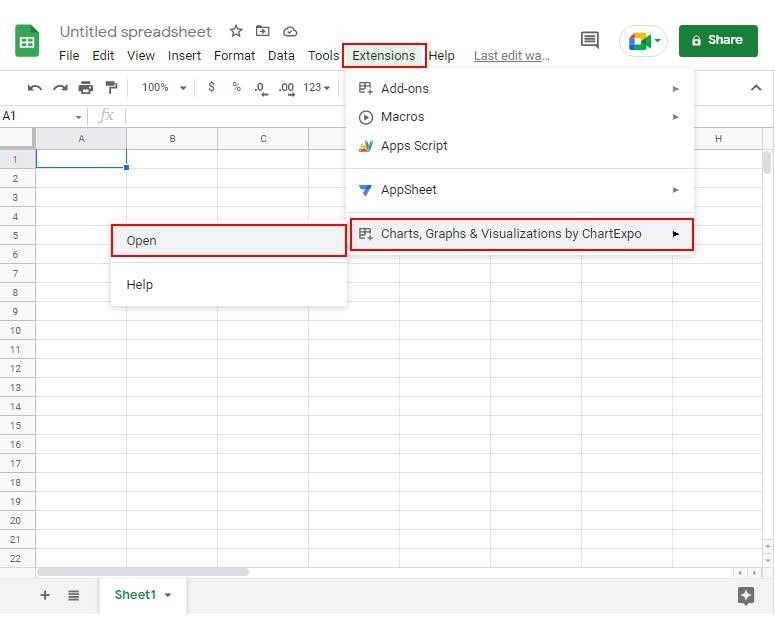
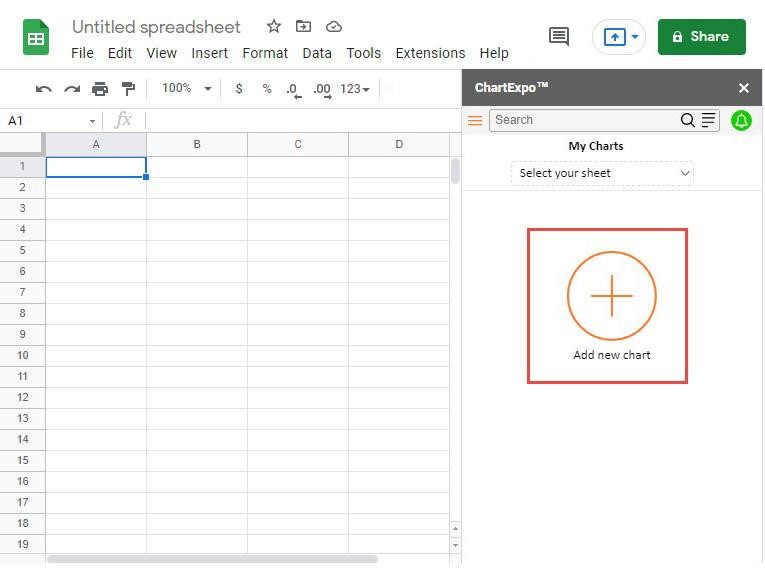
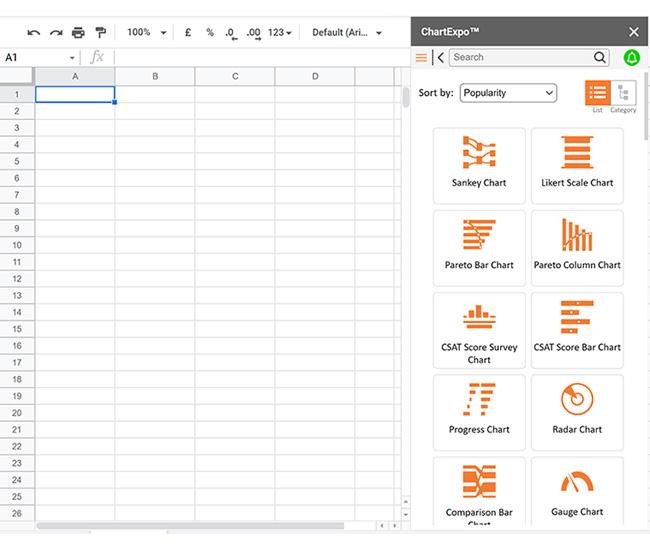
How to Install ChartExpo in Google Sheets?
ChartExpo charts are available both in Google Sheets and Microsoft Excel. Please use the following CTAs to install the tool of your choice and create beautiful visualizations in a few clicks in your favorite tool.
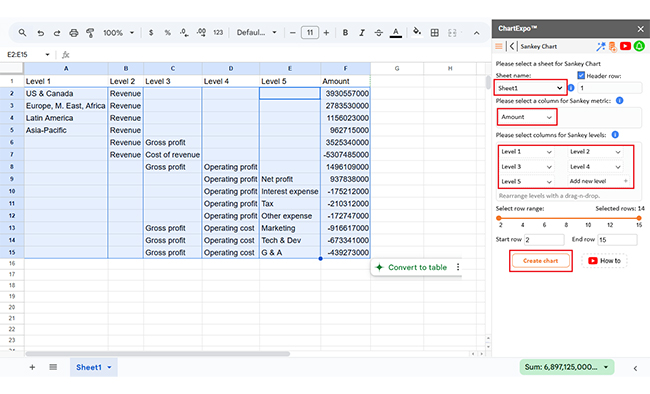
Let’s learn how to analyze financial statements in Excel using ChartExpo.
| Level 1 | Level 2 | Level 3 | Level 4 | Level 5 | Amount |
| US & Canada | Revenue | 3930557000 | |||
| Europe, M. East, Africa | Revenue | 2783530000 | |||
| Latin America | Revenue | 1156023000 | |||
| Asia-Pacific | Revenue | 962715000 | |||
| Revenue | Gross profit | 3525340000 | |||
| Revenue | Cost of revenue | -5307485000 | |||
| Gross profit | Operating profit | 1496109000 | |||
| Operating profit | Net profit | 937838000 | |||
| Operating profit | Interest expense | -175212000 | |||
| Operating profit | Tax | -210312000 | |||
| Operating profit | Other expense | -172747000 | |||
| Gross profit | Operating cost | Marketing | -916617000 | ||
| Gross profit | Operating cost | Tech & Dev | -673341000 | ||
| Gross profit | Operating cost | G & A | -439273000 |
Managing finances can feel overwhelming, but the monthly profit and loss template in Google Sheets simplifies the process. It brings clarity, saves time, and keeps you in control of your business’s financial health.
Want to keep your finances in check? Your secret weapon is a profit and loss (P&L) template in Google Sheets. It’s simple, powerful, and customizable.
Here’s how to make the most of this template:
Yes, Google Sheets offers a profit and loss (P&L) template. It’s easy to access from the template gallery. The template helps track income, expenses, and profitability. You can customize it to fit your specific business needs.
To show profit in Google Sheets, subtract your expenses from your revenue. Use a formula like =Revenue – Expenses. Ensure your income and expense categories are correctly listed, then format the result to highlight the profit.
The profit and loss template in Google Sheets is a powerful financial management tool. It organizes income, expenses, and profits and is versatile enough to benefit businesses and individuals.
This template saves time by automating calculations. It reduces the risk of errors and ensures accurate data, making tracking financial performance less overwhelming. It’s also compatible with the income statement template in Excel, offering flexibility for those using multiple platforms.
Its customization options make it suitable for any business. From startups to large companies, anyone can adapt the template to fit specific needs. Its use is flexible. It allows you to choose the best graph to show profit and loss for clear visualization.
Another key advantage is real-time collaboration. Teams can access and update the template simultaneously, ensuring everyone stays informed and aligned. Features like pivot reporting enhance analysis, making extracting insights from complex data easier.
The insights it provides are invaluable for better decision-making. It helps identify trends, manage budgets, and improve financial planning. With it, you can focus on growth and sustainability.
The Google Sheet profit and loss template is more than just a spreadsheet. It’s a tool that brings clarity and control to your financial management. By using it, you take a step closer to economic success.
Pro tip: Install ChartExpo to visualize and analyze your data more effectively.
How much did you enjoy this article?


SUMPRODUCT in Google Sheets handles multi-condition calculations without extra columns. Master its syntax, uses, and errors. Read on!

An annual budget template in Google Sheets organizes your yearly finances, tracks every dollar, and reveals spending patterns. Read on!

Learn the best graph to show profit and loss with practical examples and use cases. Discover how to visualize your business data, track trends, and make smarter financial decisions.


