20% Effort = 80% Result.
Learn how you can simplify.
For every complex problem you face, there is a simple solution.
You don’t solve complexity with more complexity.
Pareto Chart is an insightful visualization that helps decision-makers solve complex problems easily.
Google Sheets
Microsoft Excel
Free 7-day trial (no purchase necessary). Pricing starts at $10 per month.
 ChartExpo for Google Sheets is
 used by 690,000+ users worldwide!
How to Install YouTube Videos
How to create a Pareto Chart
Pareto Chart Excel: How-to
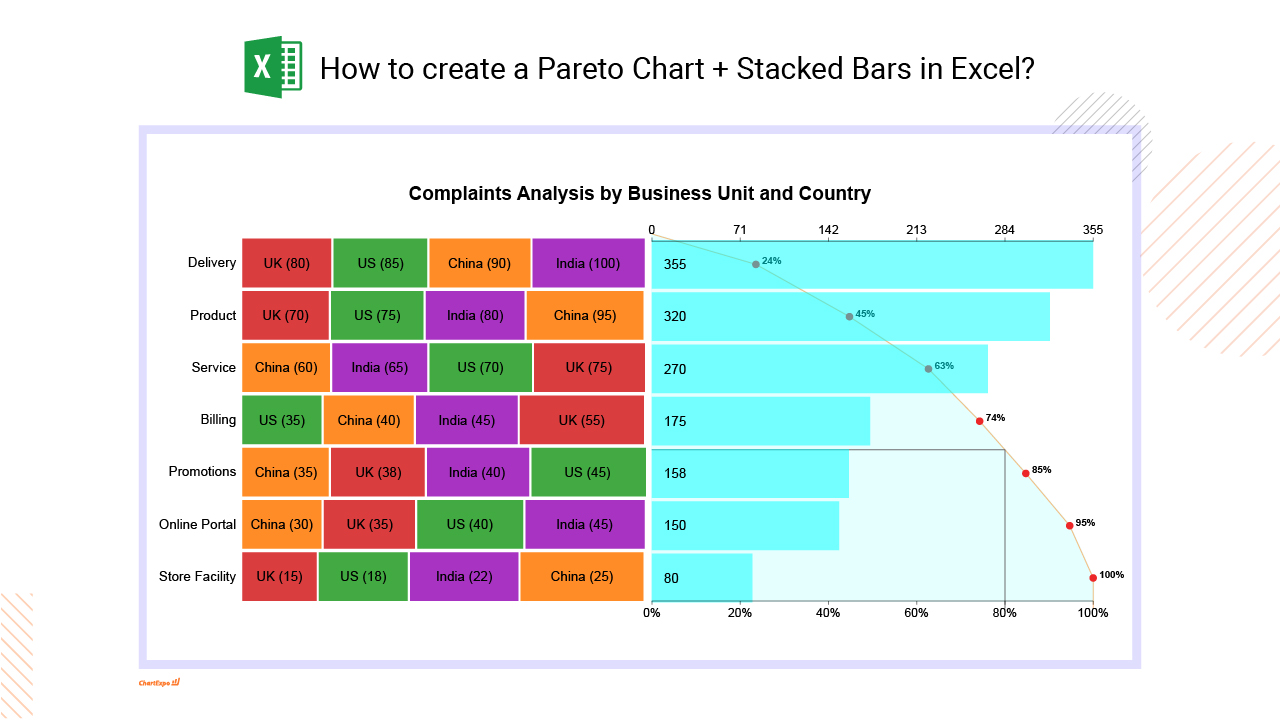
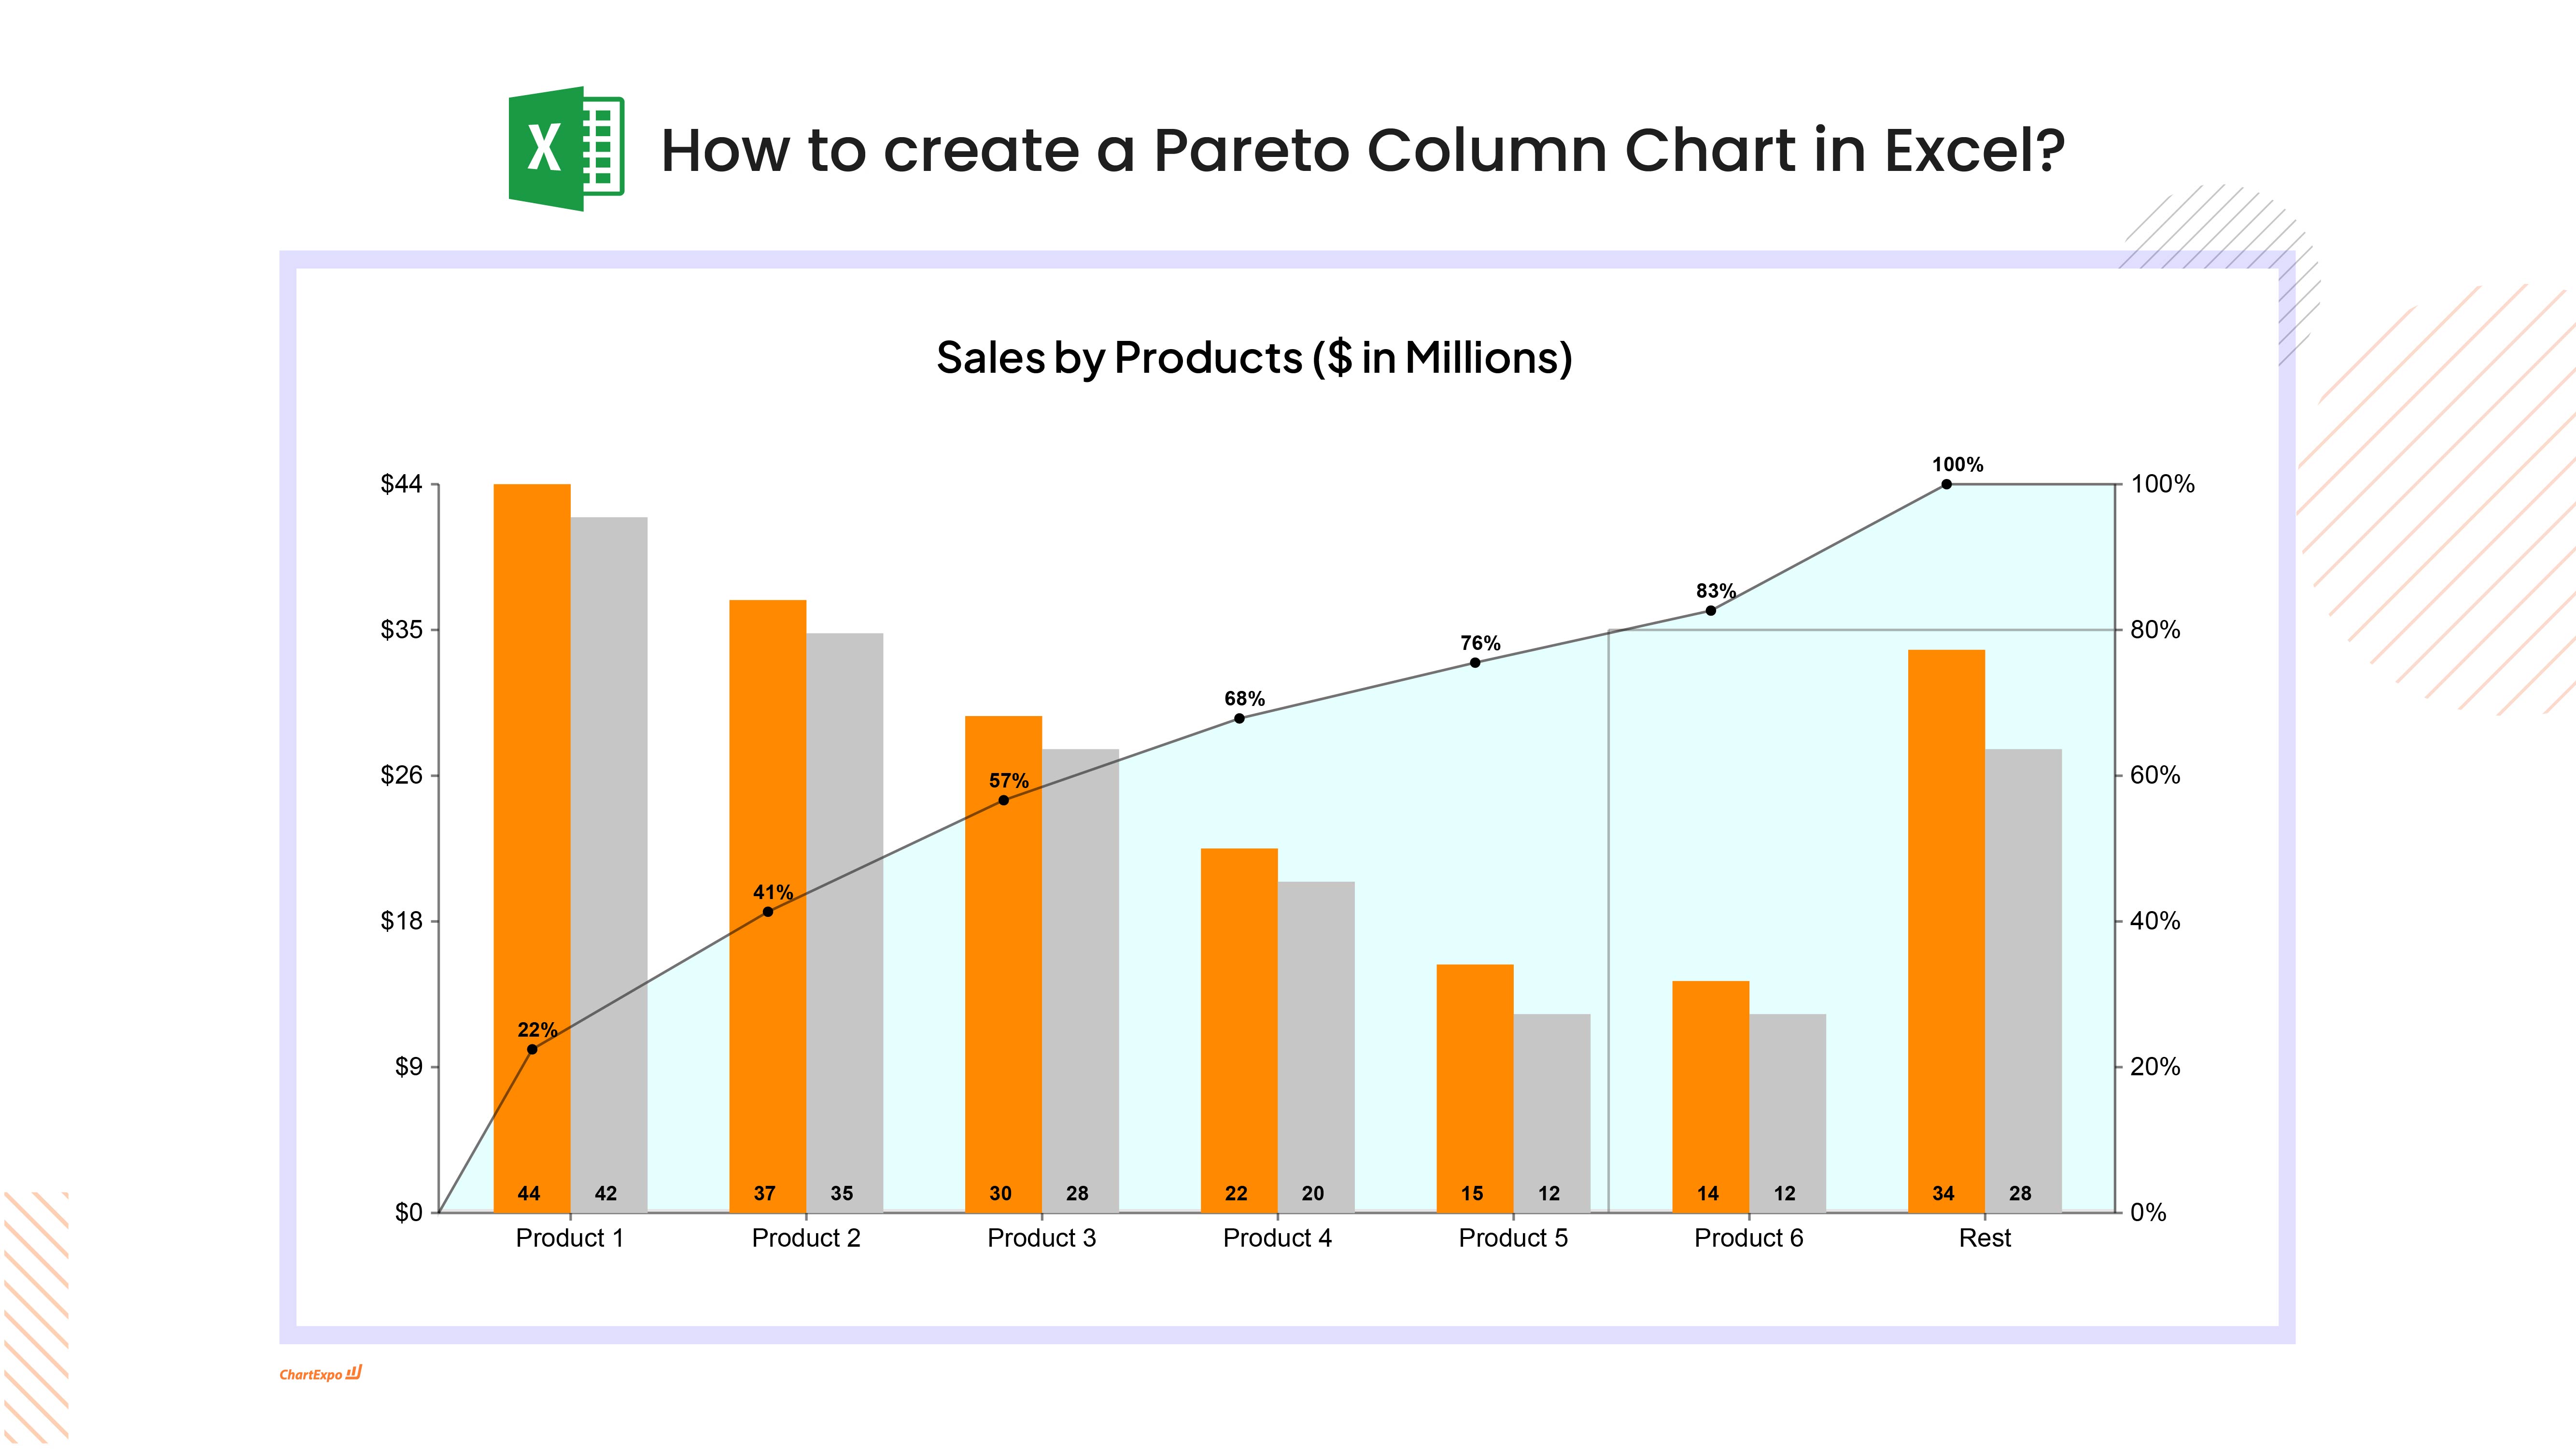
Here's how-to create a Pareto Chart in Excel:
-
Install Add-in: Install the ChartExpo add-in for Excel from the Microsoft AppSource store; it provides a simple, no-code Pareto Chart Maker.
-
Prepare Data: Include one categorical column (for example, Causes or Items) and one numeric column (for example, Frequency or Impact); sort the data in descending order to highlight the vital few versus the trivial many like a Pareto table.
-
Open ChartExpo: In Excel, click the Add-ins icon, then select ChartExpo to begin building your visualization that illustrates the Pareto Principle.
-
Choose Chart Type: From the available charts in ChartExpo, choose the Pareto Chart option to show bars for frequency or impact and a cumulative percentage line for your Pareto Chart Excel workflow.
-
Select the Data: Highlight the data cells in Excel, including headers, so ChartExpo correctly maps categories and values into the layout typical of a Pareto Graph Excel.
-
Create the Pareto Chart: Click “Create Chart From Selection” to generate the chart. The chart displays bars sorted by impact and a cumulative line that clearly shows the 80/20 Rule.
-
Customize Look: Adjust colors, cumulative line styling, labels, and other settings; add titles or annotations as needed to match your presentation or report when refining a Pareto Diagram Excel.
-
Export: Export the finished chart as PNG, PDF, or SVG for reports, presentations, or dashboards, and reuse it for ongoing Pareto analysis.
Pareto Chart Google Sheets: How-to
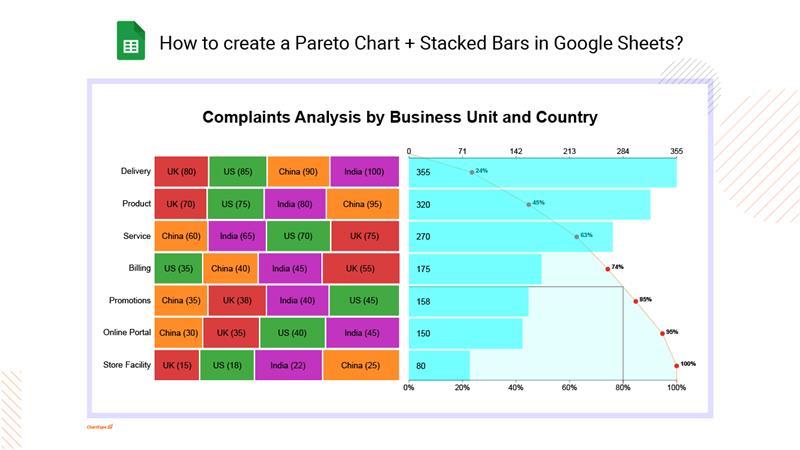
Here's how-to create a Pareto Chart in Google Sheets:
-
Install the Add-on: Install the ChartExpo add-on for Google Sheets from the Google Workspace Marketspace store. This is the first step in How to create a pareto chart in Google Sheets.
-
Prepare your Data: Build a Pareto table with one categorical column (causes, items, or labels) and one numeric column (frequency, cost, or impact), sorted in descending order to highlight the 80/20 Rule.
-
Open Extensions: In Google Sheets, go to Extensions and launch ChartExpo, a Pareto Chart Maker that streamlines Pareto analysis.
-
Select Pareto Chart: From the chart gallery, select the Pareto Chart, also known as a Pareto Graph.
-
Map your Data Fields: In the ChartExpo sidebar, map your category and value columns so the Pareto Plot reads the correct data.
-
Create Chart: Click Create Chart button to generate the chart; bars plus a cumulative line emphasize the vital few versus the trivial many in line with the Pareto Principle, producing a clear Pareto Diagram.
-
Customize: Use ChartExpo options to adjust colors, titles, labels, and cumulative line styling for maximum clarity and presentation impact on your Pareto Chart.
-
Export: Export as PNG, PDF, or SVG for easy sharing in presentations, reports, or dashboards.
What Is a Pareto Chart?
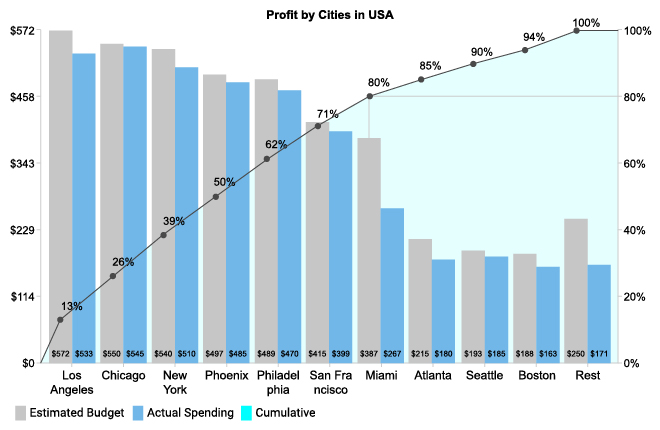
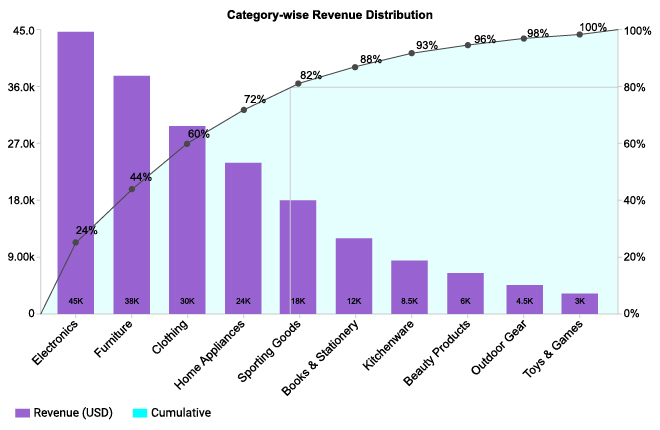
A Pareto Chart helps you identify which factors have the biggest impact on a result. It combines Pareto bar chart data with a cumulative percentage line so you can instantly see which issues contribute most to an outcome.
This visual is also known as a Pareto Graph, Pareto Plot or Pareto Diagram and it's widely used in decision-making, process improvement, and quality control.
The method is based on Pareto analysis, rooted in the 80/20 Rule. In many situations, 80 percent of outcomes stem from just 20 percent of causes. A Pareto Diagram helps you focus on those “vital few” instead of the many minor contributors.
Key Components and Purpose
A complete Pareto Chart includes:
- Categories arranged from highest to lowest impact
- Bars showing frequency or magnitude
- A cumulative percentage line
- A break point showing which factors matter most
Its purpose is to highlight the most influential causes so teams can prioritize time, budget, and actions effectively.
Common Uses
Organizations use Pareto Charts to discover which problems or opportunities deserve attention first. You’ll see them used in:
- Quality improvement and defect reduction
- Operational efficiency and cost control
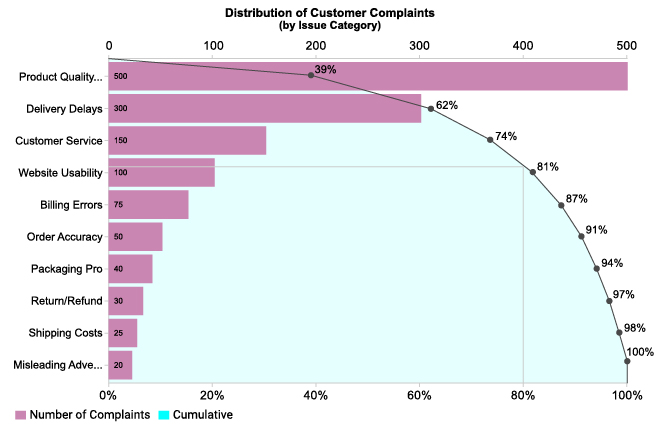
- Customer feedback and complaint analysis
- Sales performance and profitability insight
A well-built Pareto Plot shows where improvement efforts will deliver the highest return.
How a Pareto Chart Works
The logic behind the chart is based on the 80/20 Rule. The process is simple:
- List the contributing factors you want to analyze
- Sort them from most impactful to least impactful
- Measure cumulative contribution as you move down the list
- Identify the 20 percent of causes responsible for 80 percent of results.
This helps teams take faster action and improve outcomes with less effort.
How to Interpret a Pareto Chart
To read a Pareto Diagram effectively:
- Tallest bars highlight top-impact causes
- The curve shows how impact accumulates.
- A steep early rise confirms the “vital few”
- A flat tail shows low-impact categories
Once you identify the key contributors, you can resolve them before addressing smaller issues.
Types of Pareto Charts
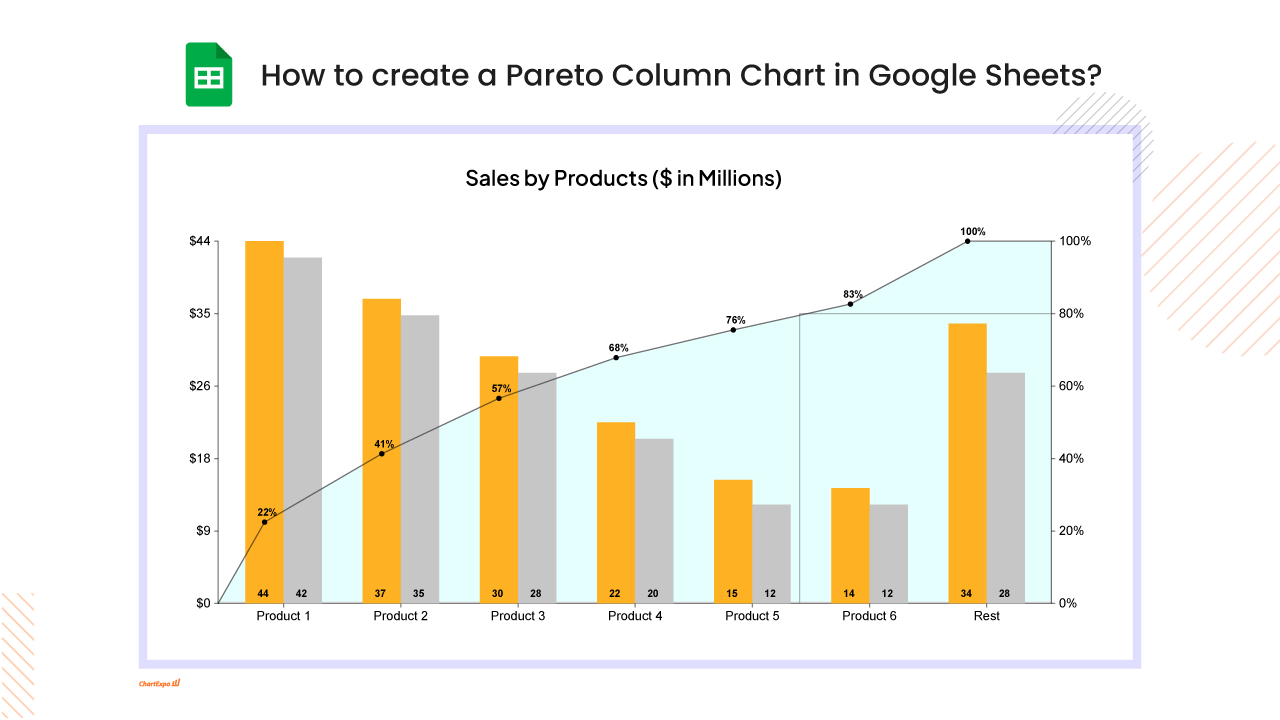
- Vertical Pareto Chart: Vertical ranked bars plus cumulative percent in one glance.
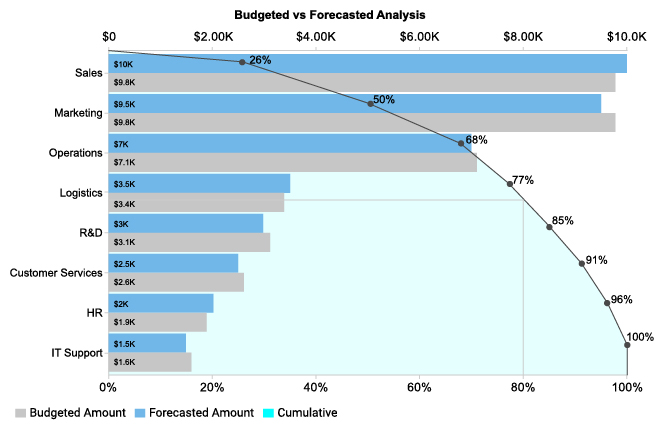
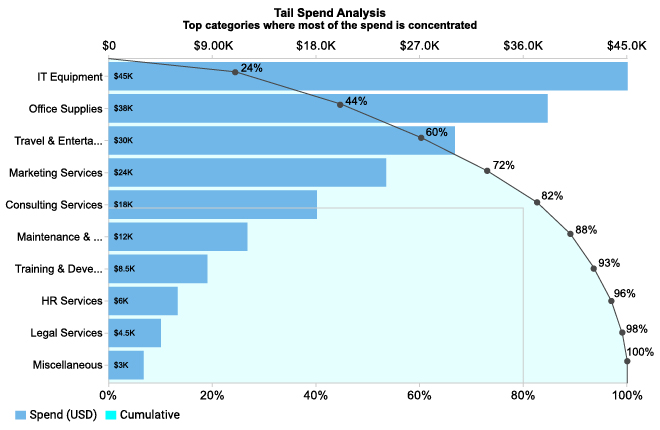
- Horizontal Pareto Chart: Horizontal ranked bars with cumulative percent, handles long labels cleanly.
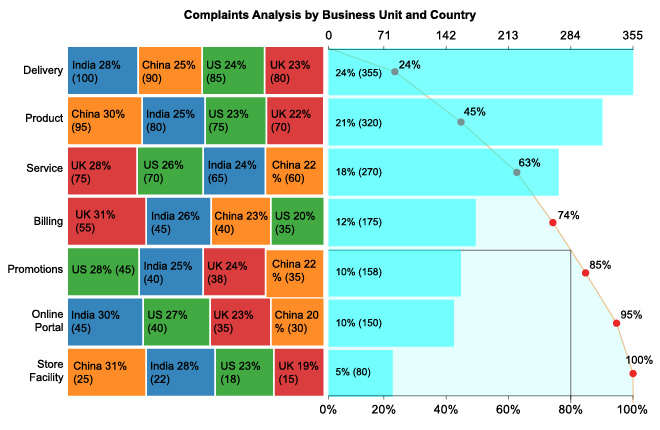
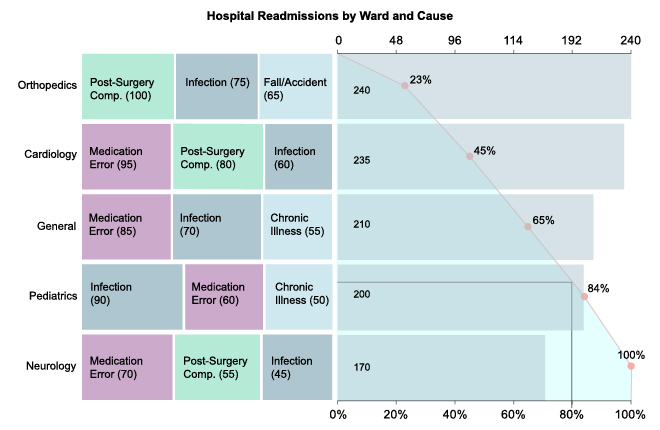
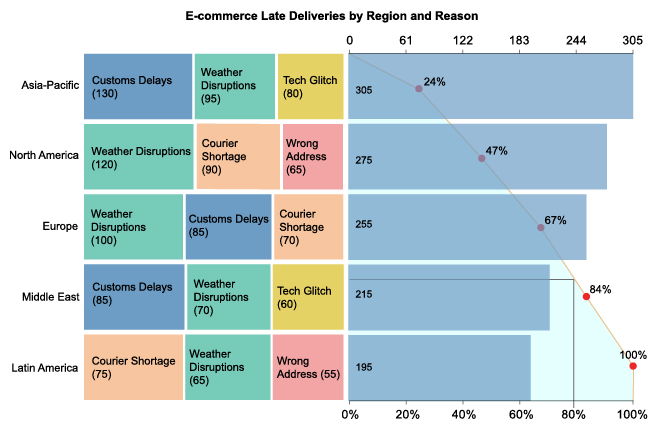
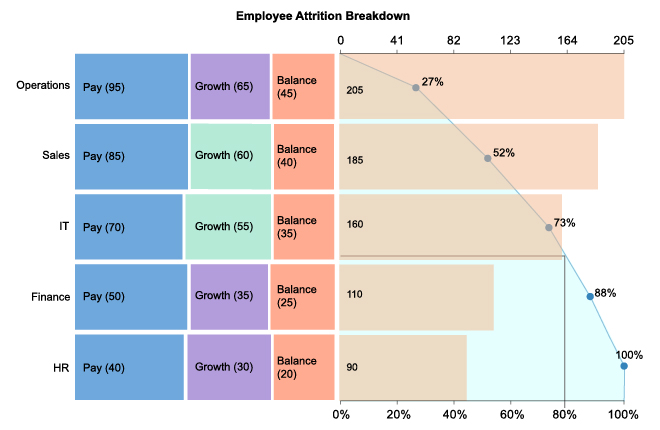
- Stacked Pareto Chart: Shows total impact plus subcategories mix in one view.
- Comparative Pareto Chart: Two aligned Paretos (e.g., Before vs After, Region A vs B, Q1 vs. Q2, etc.) with matched category order.
Applications of Pareto Charts
A Pareto Analysis is useful across industries. Common examples include:
- Quality Control: Find defect sources and reduce scrap
- Sales: Identify top products driving revenue
- Customer Service: Rank complaint causes by frequency
- Supply Chain: Prioritize reasons for delivery delays
- Healthcare: Monitor major causes of medical errors
Benefits of Using a Pareto Chart
- Reveals the most impactful issues immediately
- Improves prioritization and resource allocation
- Strengthens quality control and process improvement
- Works for small and large datasets
- Easy to share and communicate across a team
Using a Pareto Chart Generator speeds up insight-sharing and prevents manual calculation errors.
Pareto Charts for Quality Control
In manufacturing and QA, the Pareto Plot is one of the most valuable tools available. It quickly shows which defect types cause most loss, helping teams eliminate issues that matter most. Many businesses use a Pareto Chart template to track improvements month over month.
Pareto Chart Examples
Common real-world Pareto Diagram examples include:
- Defects by type or production stage
- Customer complaints grouped by cause
- Product profitability ranked by revenue
- Support tickets by frequency
- Shipment delays by source
These Pareto chart samples demonstrate how the 80/20 distribution appears in real operational data.
Pareto Chart Maker
A modern Pareto Chart creator lets you build insights quickly without formulas or manual sorting. With ChartExpo, you can:
- Build a Pareto Graph online
- Import data from Excel or Google Sheets
- Customize labels, lines, colors, and thresholds
- Export your visual as PNG, PDF, JPG, and more
It’s one of the fastest ways to convert raw numbers into decisions.
Key Takeaways
A Pareto Chart highlights the few causes responsible for most results. By pairing bars with a cumulative curve, it reveals where to focus first for maximum impact.
Whether using Excel, Google Sheets, or a Pareto Chart maker, Pareto analysis helps you optimize performance and improve outcomes with less effort.
ChartExpo Pricing
ChartExpo for
Google Sheets
$10*
per month
(no purchase necessary)
*pricing starts at $10
per user per month.
Only in-app purchase available
ChartExpo for Google Sheets
single-user purchase video.
ChartExpo for Google Sheets
domain-users purchase video.
ChartExpo for Google Sheets
single-user installation video.
ChartExpo for Google Sheets
admin installation video.
ChartExpo for
Microsoft Excel
$10*
per month
(no purchase necessary)
*pricing starts at $10
per user per month.
Only in-app purchase available
ChartExpo for Excel single-user
purchase video.
ChartExpo for Excel domain-users purchase video.
ChartExpo for Excel single-user
installation video.
ChartExpo for Excel admin
installation video.
Custom Pricing
Videos
4:18
6:07
7:37
5:33
Blogs
Tail Spend Analysis: A Complete Walkthrough
Tail spend analysis helps reduce overlooked procurement costs. Discover how managing tail spending can improve efficiency and save money in business.

Management Reporting: What Executives Actually Want to See
Get better insights with management reporting. Track growth, efficiency, and financial performance. Learn how reports drive business decisions and strategy.
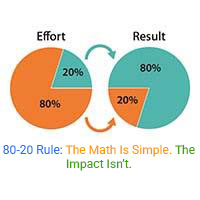
80-20 Rule: The Math Is Simple. The Impact Isn’t.
80-20 rule missteps can cost growth and alignment. Are you focusing on the right 20% or missing what matters?
Best Types of Charts and Graphs for Data Visualization
Discover the best types of charts and graphs for visualizing data. You will also learn how to create different types of graphs, charts.
Sales Tracking Spreadsheet for Better Insights
A Spreadsheet for Sales Tracking organizes data, tracks performance, and analyzes trends.
